 Gibson RS1,
Principles of Nutritional
Assessment: Development of
Gibson RS1,
Principles of Nutritional
Assessment: Development of
Nutrient Reference Values
3rd Edition August, 2024
Abstract
This chapter describes the evolving process of setting nutrient reference values (NRVs) from a single value to a multi-level approach designed to address multiple users and needs. This multi-level approach with some modifications has been adopted by several authoritative groups. However, discrepancies in the terminology and methodologies has led to an initiative to develop a four-step framework for harmonizing the process for deriving two core NRVs. The feasibility of the proposed framework has been tested with three exemplar micronutrients (zinc, iron, folate) on two high-risk population subgroups — young children and women of reproductive age. The framework can be applied across countries and a variety of population subgroups, while taking into account culturally and context-specific food choices and dietary patterns. Derivation of the two core NRVs depicted in the framework — the Average Requirement (AR) and Safe Upper Level of Intake (UL) — is presented here. Details of additional NRVs used are also described. They include the Recommended Intake (RI) (analogous to the RDA or RNI) used to guide intakes of individuals, the Lower Reference Intake (equivalent to the AR −2SD), and a Safe or Adequate Intake value used when insufficient information is available to set an AR. Details of the different methods used to establish recommendations for energy and macronutrients are also described. A review of the NRVs currently in use by the United Kingdom, USA and Canada, European Union, and WHO/FAO is also presented, together with the potential sources of discrepancy. In a final section under “Future directions”, reasons for harmonizing the process to derive NRVs globally are emphasized together with the six core values considered essential for the success of this initiative.
CITE AS:
Gibson RS. Principles of Nutritional Assessment.
Nutrient Reference Values. https://nutritionalassessment.org/nrv/
Email: Rosalind.Gibson@Otago.AC.NZ
Licensed under CC-BY-4.0
( PDF )
8a.1 Development of Nutrient Reference Values
The first set of nutrient reference values (NRVs) was produced by the Technical Commission on Nutrition, League of Nations, (1938). The recommendations of this Commission formed the basis for the first Canadian Dietary Standard compiled by the Canadian Council on Nutrition (1940). The United States Food and Nutrition Board (in 1943) prepared the first U.S. Recommended Dietary Allowances (RDAs) for protein, energy, and eight vitamins and minerals. This was followed by periodic revisions of the U.S RDAs and a number of joint publications by the World Health Organization / Food and Agriculture Organization on recommendations for different groups of nutrients (FAO/WHO, 1974; FAO/WHO, 1988). By 1989, the U.S RDAs included 25 vitamins and minerals in addition to protein and energy. Until this time, these reports provided a single estimate of requirements (i.e., the RDA or equivalent) that was sufficient to meet the needs of almost all individuals in a specific life-stage group. Nevertheless, despite being set for individuals, the RDAs were being applied to population data and used for many different purposes. This misuse of the RDA led to the development of new approaches to address multiple users and needs. The first country to adopt a framework that embraced three nutrient reference levels was the United Kingdom (COMA,1991) (Section 8a.4). This was followed by the release by the U.S. Food and Nutrition Board (FNB) of a new paradigm of Dietary Reference Intakes (DRIs) (National Academic Press, 2000). Their approach, developed jointly by the U.S. and Canada, also provided multiple reference levels for each nutrient and included for the first time an upper intake value (UL) as well as the concept of reducing the risk of chronic diseases This new multi-level approach was soon adopted with some modifications by other authoritative bodies worldwide, including in China; Korea and Southeast Asia; Germany, Austria, Switzerland; Australia and New Zealand; and Mexico. Most established an Estimated Average Requirement (EAR) and a RDA (or equivalent) at two standard deviations above the EAR, although the exact terms used differed. Some authorities also included a Tolerable Upper Intake Level (UL) for certain nutrients, and in many cases, a safe or adequate intake value (or range) when insufficient information was available to set an EAR (King et al., 2007). One of the latest developments includes the introduction of a systematic review process to identify data relevant to the derivation of NRVs. This initiative was introduced in 2007 by the EURopean micronutrient RECommendations Aligned (EURRECA) Network of Excellence (NoE) (Dhonukshe-Rutten et al., 2013), and used in the U.S. and Canada for the first time for the revision of the NRVs for vitamin D and calcium (IOM, 2011). More recently, efforts have been made to overcome some of the challenges encountered when setting nutrient reference values for chronic disease prevention; these efforts are on-going (Yetley et al., 2017). There is now considerable interest in providing a framework for harmonizing the process to derive NRVs that can be applied across countries and a variety of population subgroups, while taking into account culturally and context-specific food choices and dietary patterns. This international harmonizing initiative first began in 2005 with the development and publication of several background review papers and a consensus report on “Harmonization of nutrient intake values” (King and Garza, 2007).| Recom- mendation |
Recom mended terms | USA/ Canada | UK | European Union/ EFSA | WHO/ FAO |
|---|---|---|---|---|---|
| Umbrella term for the set of recom- mendations | NRV | DRI | DRV | DRV | |
| Average requirement | AR | EAR | EAR | AR | |
| Recommended intake level | RI | RDA | RNI | PRI | RNI |
| Lower reference intake | LRNI | LTI | |||
| Adequate intake | AI | AI | SIV | AI | |
| Safe upper level of intake | UL | UL | SUL | UL | UL |
| Appropriate macronutrient distribution range | AMDR | AMDR | RI | Population mean intake goals |
8a.2 Harmonization of methodological approaches to derive Nutrient Reference Values
An initial organizing framework for deriving NRVs, developed in the 2005 workshop (King and Garza, 2007), is depicted in Figure 8a.2.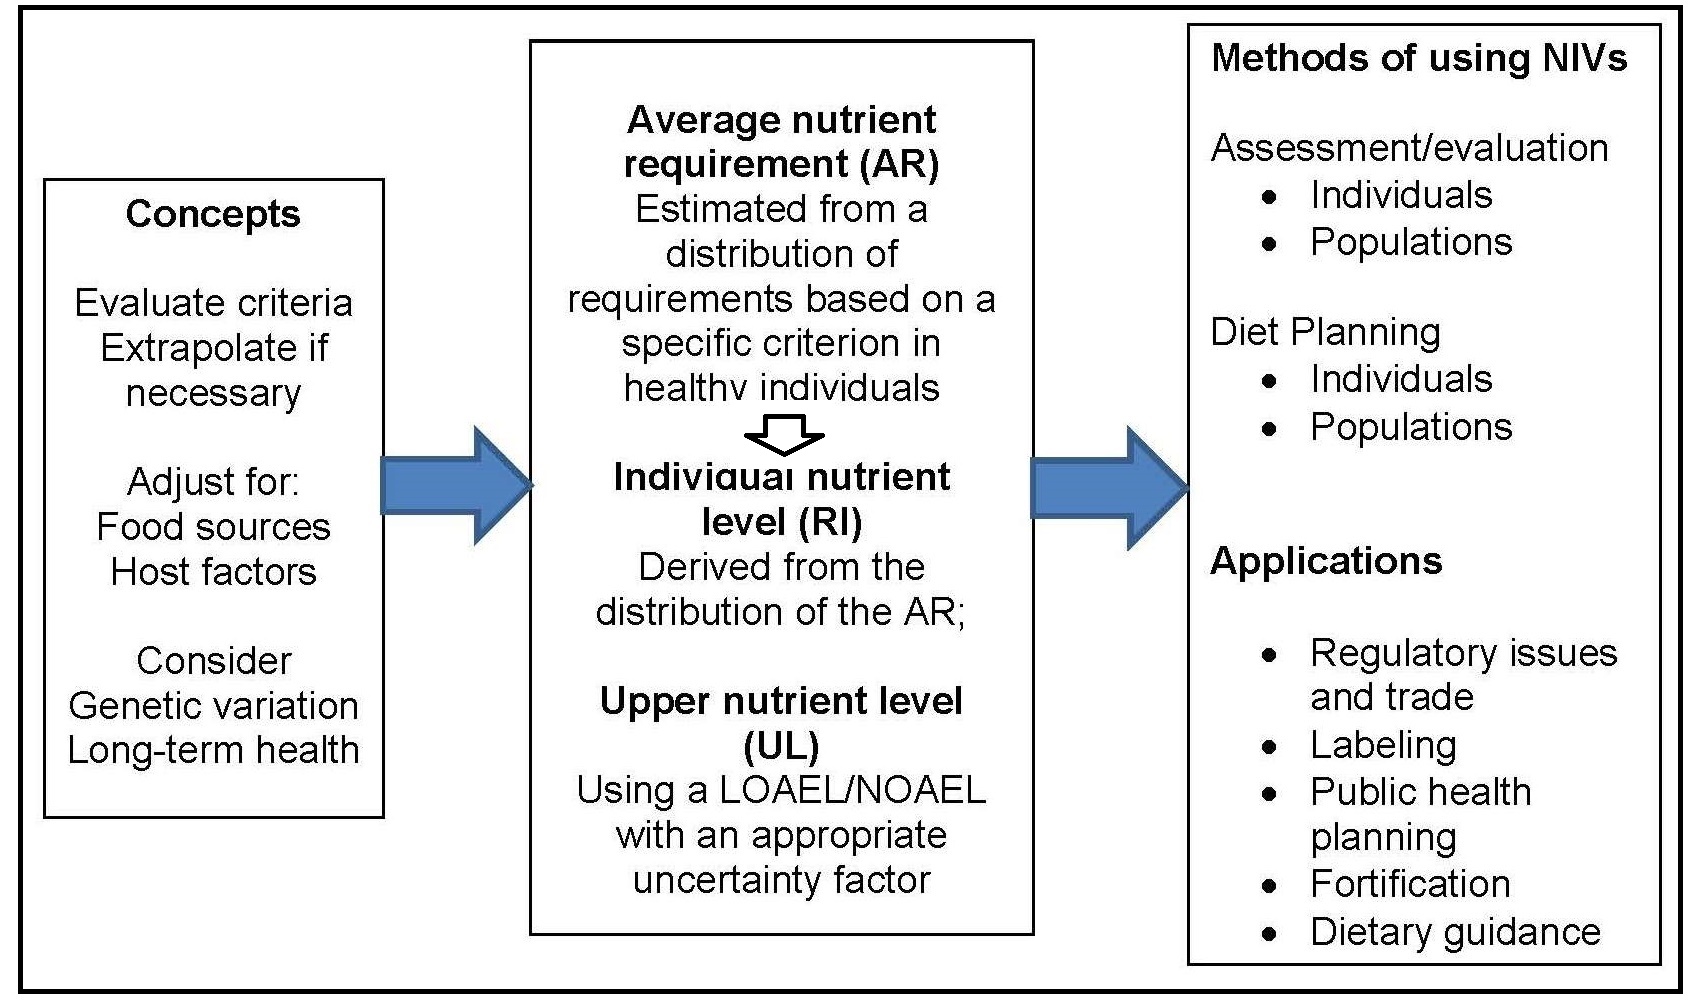
- Be based on the mean nutrient intake of a specific population;
- Be established for all essential nutrients and food components that have public health relevance;
- Include acceptable macronutrient distribution ranges for carbohydrates, protein, and fat that reduce chronic disease risks associated with the intake of these macronutrients;
- Consider nutrient-nutrient interactions* and quantify them, if possible; and
- Consider subpopulations with special needs, keeping in mind, however, that reference values are intended for apparently healthy** individuals.
- Choosing the appropriate tools and resources;
- Collecting relevant data from the tools and other resources;
- Identifying the best approach for the nutrient under consideration; and
- Deriving the two core nutrient reference values, the average requirement (AR) and the tolerable Upper Limit (UL).
8a.2.1 Choosing the appropriate tools and resources
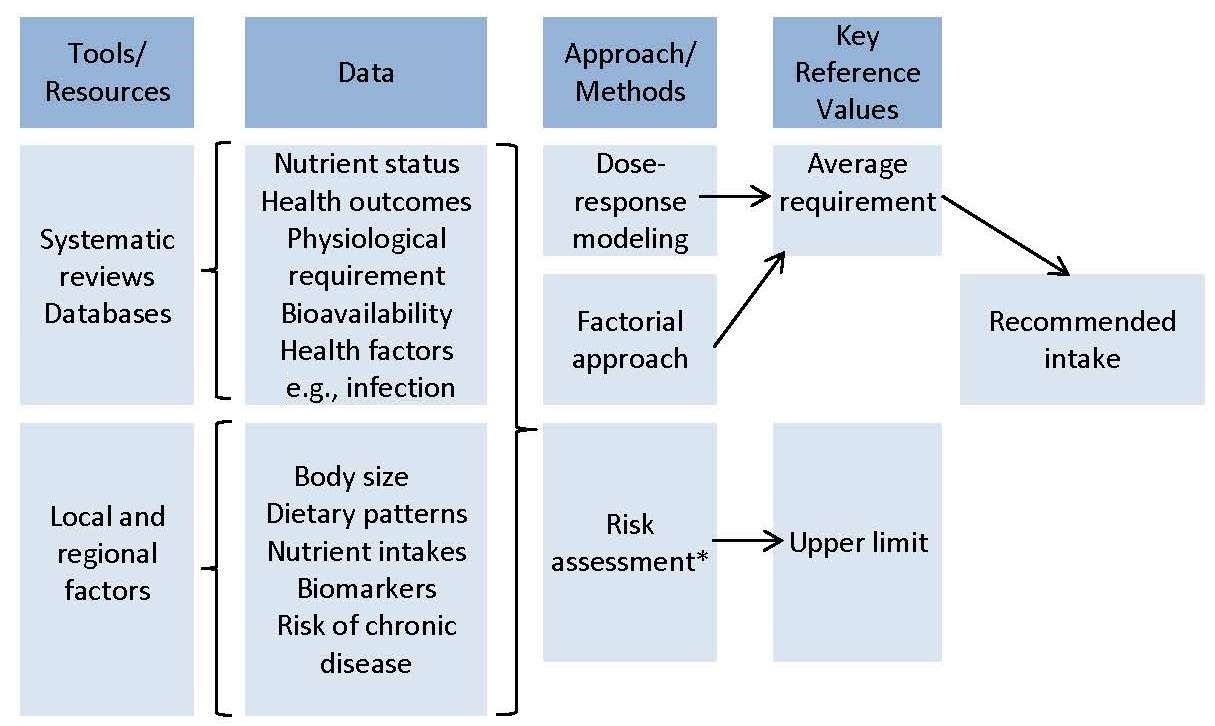
The primary tools and resources needed to develop the NRVs are: systematic reviews, comprehensive databases, and information about relevant local and regional factors that can influence the NRVs, as shown in Figure 8a.3. The EURECCA network applied the systematic review process to identify data relevant to the derivation of NRVs, using six micronutrients as examples; see Hooper et al., 2009; Van 't Veer et al., 2013; and Dhonukshe-Rutten et al., 2013 for more details. Subsequently, systematic reviews of biomarkers of status for vitamin B12, zinc, iodine, copper, riboflavin, magnesium, vitamin D, polyphenols, n-3 long-chain polyunsaturated fatty acids, and selenium were published (Allen et al., 2009; Pérez-Jiménez et al., 2010; Witkowski et al., 2011). These existing systematic reviews can be updated, or new systematic reviews initiated, where necessary. Efforts have been made to harmonize the protocols for systematic reviews (Moher and Tricco, 2008). The first step is to use the PICO/PECO model to define the search terms and concepts for the systematic review; this model is described in Box 8a.1.Box 8a.1: The PICO/PECO Model
The elements in the model are:
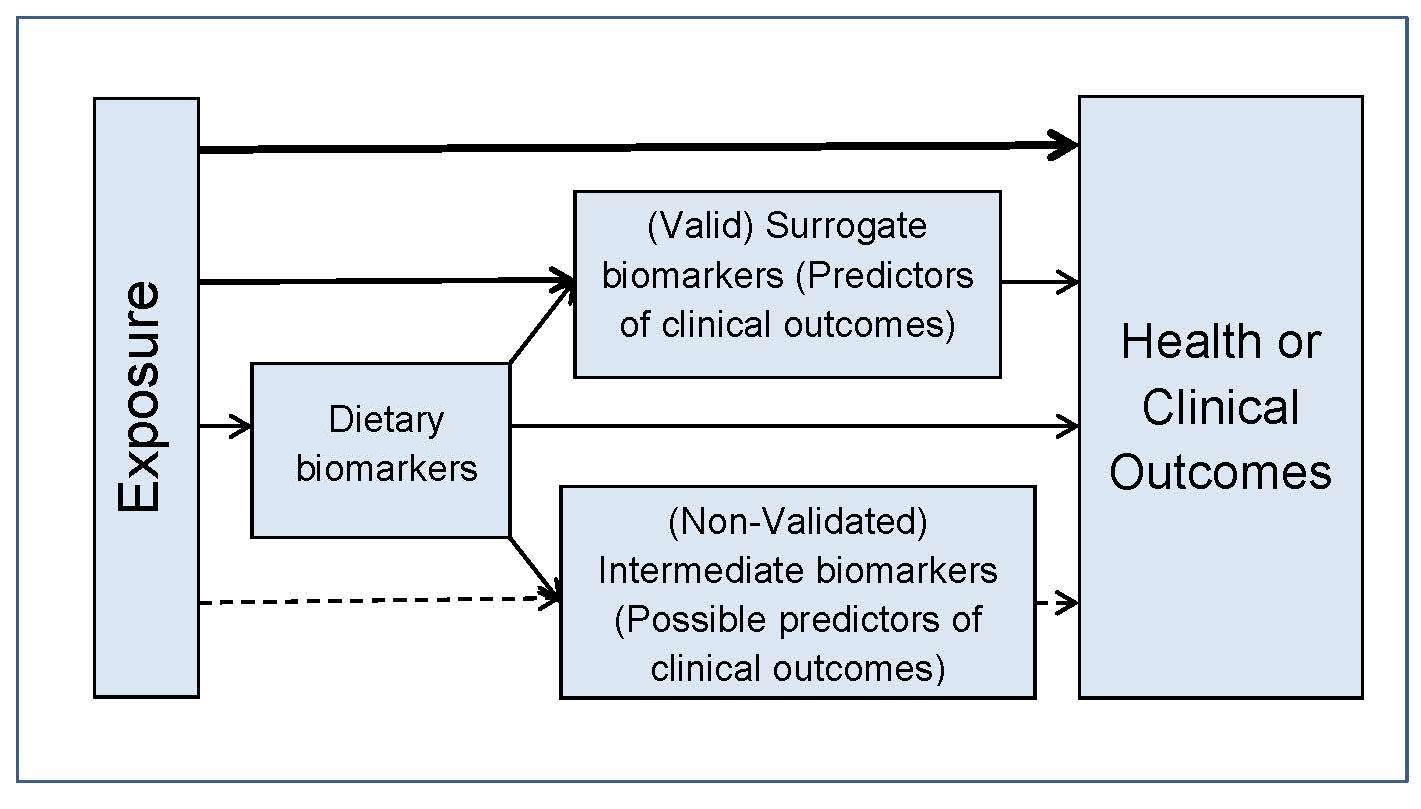
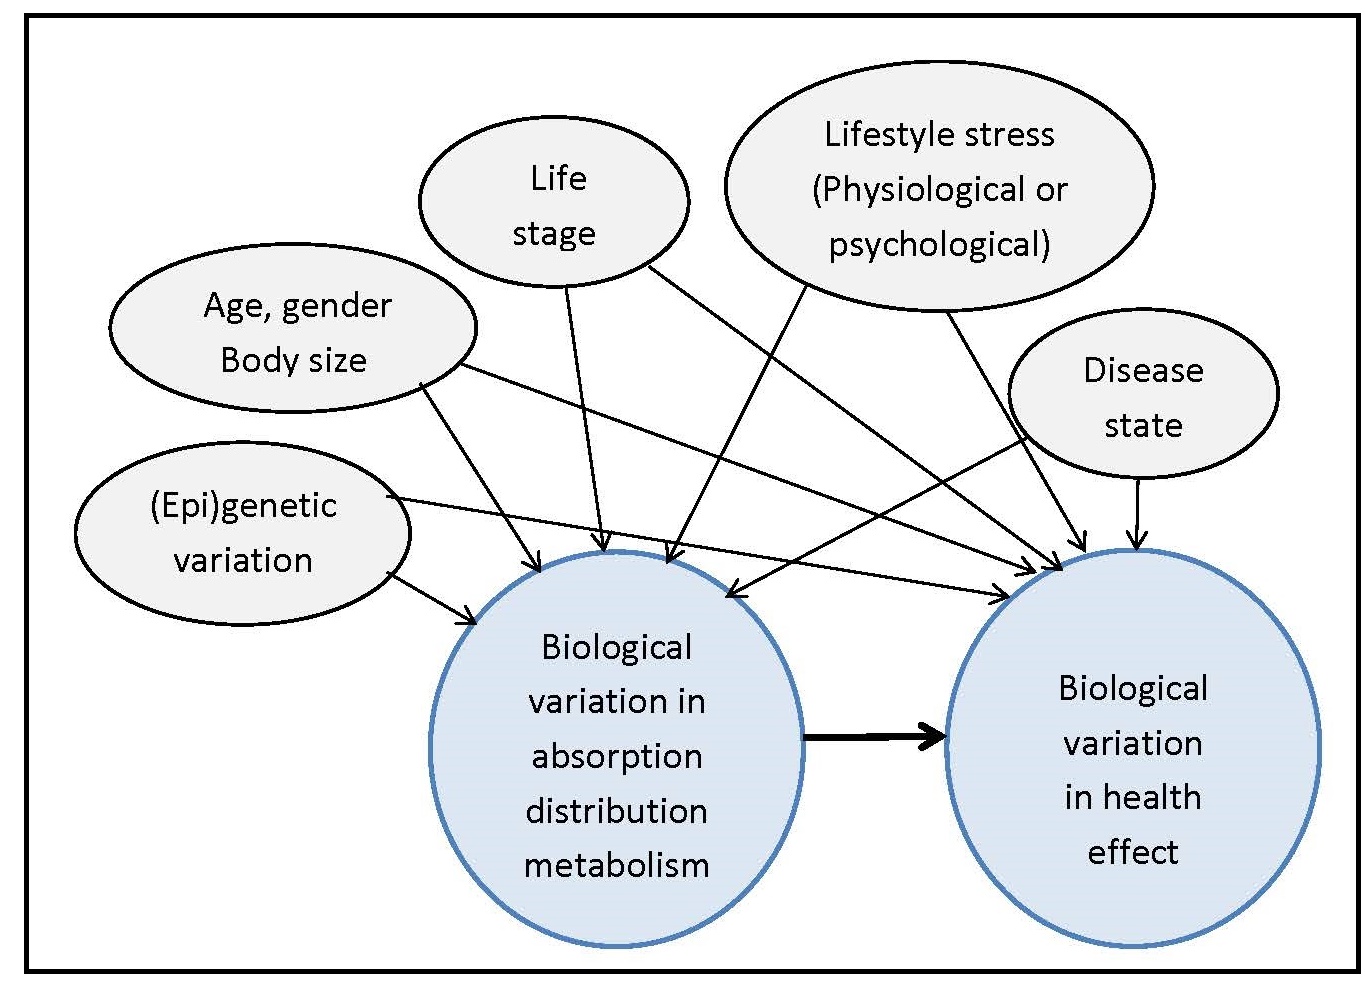
In addition to using the PICO/PECO model, construction of a
predefined analytic framework (e.g., a causal pathway) is also
recommended to help identify systematic review questions. An
example for a generic analytic framework for NRVs is depicted in
Figure 8a.4.
- P = Population: How would you describe the population subgroup? What are the most important characteristics of the population?
- I/E = Intervention/Exposure (I/E): What primary intervention or exposure are you considering?
- C = Comparison: What is the main alternative to compare with the intervention?
- O = Outcome: What is the outcome or effect being considered?
8a.2.2 Collecting data from the tools
The second step is to collect the data generated from the tools that are essential for selecting the biomarkers of status, surrogate outcomes, and health/clinical outcomes. Data on the dietary factors with the potential to influence nutrient bioavailability and the health factors (e.g., infection) that can affect nutrient requirements must also be included.8a.2.3 Identifying the best approach for deriving the NRVs for the nutrient of interest
Once the relevant data have been collated, the evidence appraised and integrated using the appropriate resources, and any sources of uncertainty identified, the third step is to identify the best approach for deriving the NRVs for the nutrient under study. The decision on which approach to use depends on the availability of data, and the types and quality of studies reviewed (Section 8a.2.1). Three approaches are frequently used: factorial approach, balance studies, and an intake (dose)-response assessment. Limitations of each of these approaches were noted by Claessens et al. (2013). Table 8a.2| Type of study | Measurement | Examples |
|---|---|---|
| Nutrition intervention studies (randomized, placebo- controlled studies) | Functional outcome | Calcium fracture rate with increased calcium intake via supplements or placebo |
| Biochemical measurements | Red blood cell folate response to varying levels of folate | |
| Depletion/repletion studies | Biochemical measurements | Leukocyte ascorbate concen- trations for vitamin C Urinary excretion of 4-pyridoxic acid for vitamin B6 |
| Balance studies | Controlled intake and excretion | Protein requirements |
| Factorial estimation | Measure losses + bioavailability | Iron & zinc requirements |
| Epidemiologic observational studies | Estimate intake and measure losses | Iodine intake and excretion |
| Functional outcome | Vitamin A and night-blindness | |
| Observed intakes in healthy populations | Dietary intake data | Vitamin K |
8a.2.4 Deriving the Average Requirement (AR) for a nutrient
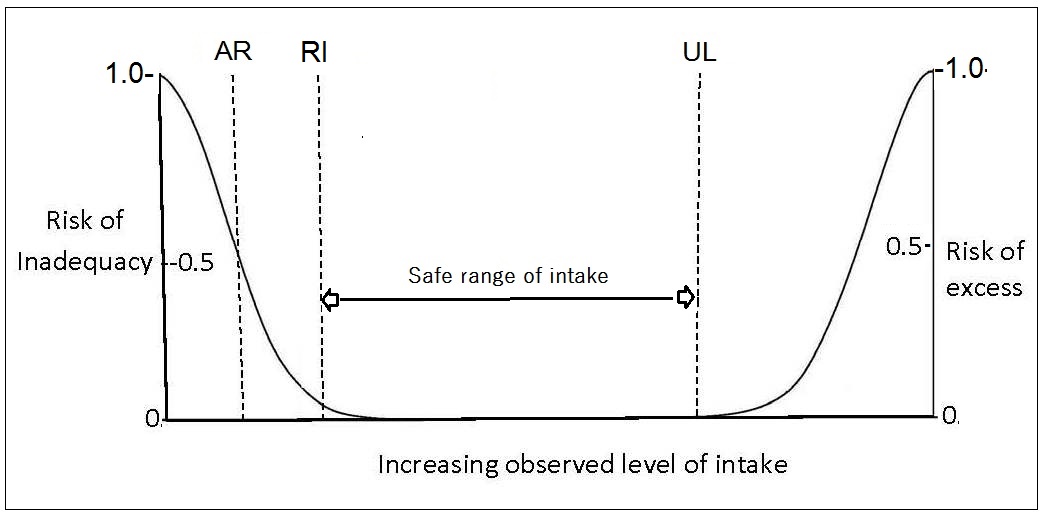
The requirements for a specific nutrient vary from individual to individual and thus form a distribution of requirements. For most nutrients except iron, this variation in requirements is assumed to follow a normal symmetrical distribution as shown in Figure 8a.5,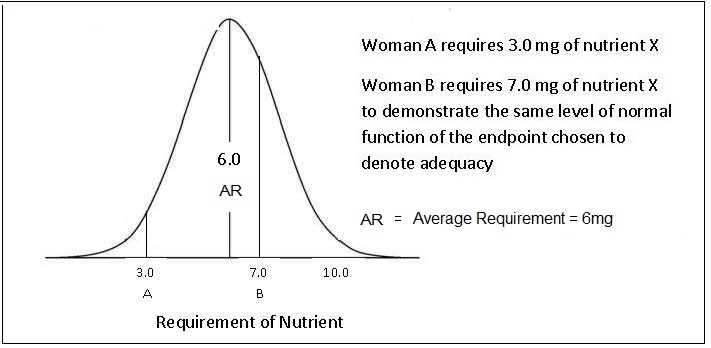
“the amount of nutrient that is estimated to meet the nutrient requirement of half the healthy individuals in a specific life-stage and sex group”.For certain groups (e.g., the elderly, infants, children, pregnant and lactating women), the requirements are often extrapolated from measurements made on young adults, because of the paucity of relevant research data available for these "understudied” life-stage groups. Various methods of scaling (both interpolation and extrapolation) can be used to define values for these subgroups based on known data for other populations (e.g., adults). Extrapolation can be based on body size, lean body mass, energy intakes, or activity levels, although the methods and factors used are not always transparent and consistent across expert groups; see Atkinson and Koletzko (2007) for more details.
8a.2.5 Deriving the Safe Upper Levels of Intake
The Safe Upper Levels of Intake (ULs) represent daily intakes, that if consumed chronically over time, will have a very low risk of causing adverse effects. Intakes from all sources are considered: food, water, nutrient supplements, and pharmacological agents. The UL is defined as:“The highest level of habitual nutrient intake that is likely to pose no risk of adverse health effects in almost all individuals in the general population (King and Garza, 2007).”The ULs are based on a toxicological risk assessment model involving a four-step process:
Box 8a.2: Four-step toxicological risk assessment model
The dose-response assessment is built upon three toxicological terms:
no-observed-adverse-effect level (NOAEL), lowest-observed-adverse-effect level (LOAEL), and uncertainty factor (UF).
These terms are defined in Box 8a.3.
- identification of risk of toxicity;
- dose-response assessment;
- assessment of the prevalence of intakes outside the reference values; and
- characterization of risks associated with excess intake
Box 8a.3: Dose-response assessment
At present, ULs are only set for those nutrients for which there
is strong, high quality evidence. Like ARs, ULs vary by age
and sex and tend to be lower for young children and pregnant
women. The goal is to have less than 5% of a population
subgroup with an intake greater than the UL, including intakes
from supplements and fortified foods
(IOM, 1998).
This goal can sometimes be challenging for
population subgroups consuming fortified cereals
(Arsenault and Brown, 2003).
For more details on the derivation of ULs, refer to
WHO/FAO (2005).
- NOAEL is the highest continuing intake of a nutrient at which no adverse effects have been observed in the individuals or groups studied. In some cases, it may be derived from experimental studies in animals. When sufficient data are not available to define a NOAEL, then a LOAELis defined.
- LOAEL is the lowest continuing intake at which an adverse effect has been identified.
- UNCERTAINTY FACTORS (UFs) are used to address gaps in the data and incomplete knowledge (e.g., variability in response within the population; extrapolation from experimental animal to human data). The estimate for the magnitude of the uncertainty factor for each nutrient should be based on the approach of Renwick et al. (2004).
8a.3 A review of Nutrient Reference Values set by the UK, U.S./Canada, European Union, and WHO/FAO
Before reviewing the NRVs established by each of the four individual authorities, it is stressed again that the process of setting nutrient reference values has evolved from setting a single value, equivalent to the RI, to specifying multiple reference values. In addition to establishing the two core NRVs — the Average Requirement (AR) and Safe Upper Level of Intake (UL) — for a specific nutrient and described in Sections 8a.2.4 and 8a.2.5, other NRVs are often specified and used for multiple purposes, some with a focus on optimizing health and preventing chronic diseases rather than the prevention of nutritional deficiencies. The more important of these other NRVs (the RI, LRI, and AI) are listed in Table 8a.1 and summarized below. The reader is advised to consult Table 8a.1 for a comparison of the recommended terminology with the terms currently used by these four authorities (Lupton et al., 2016). In addition, the problems of setting NRVs for energy and some macronutrients, as well as NRVs for Chronic Disease Prevention, have also been faced by all four authorities. Comments on these difficulties are also considered below. Nevertheless, many of the principles used previously to define NRVs remain the same (Box 8a.4); see Section 8a.2 for more details.
Box 8a.4: Underlying principles in defining NRVs
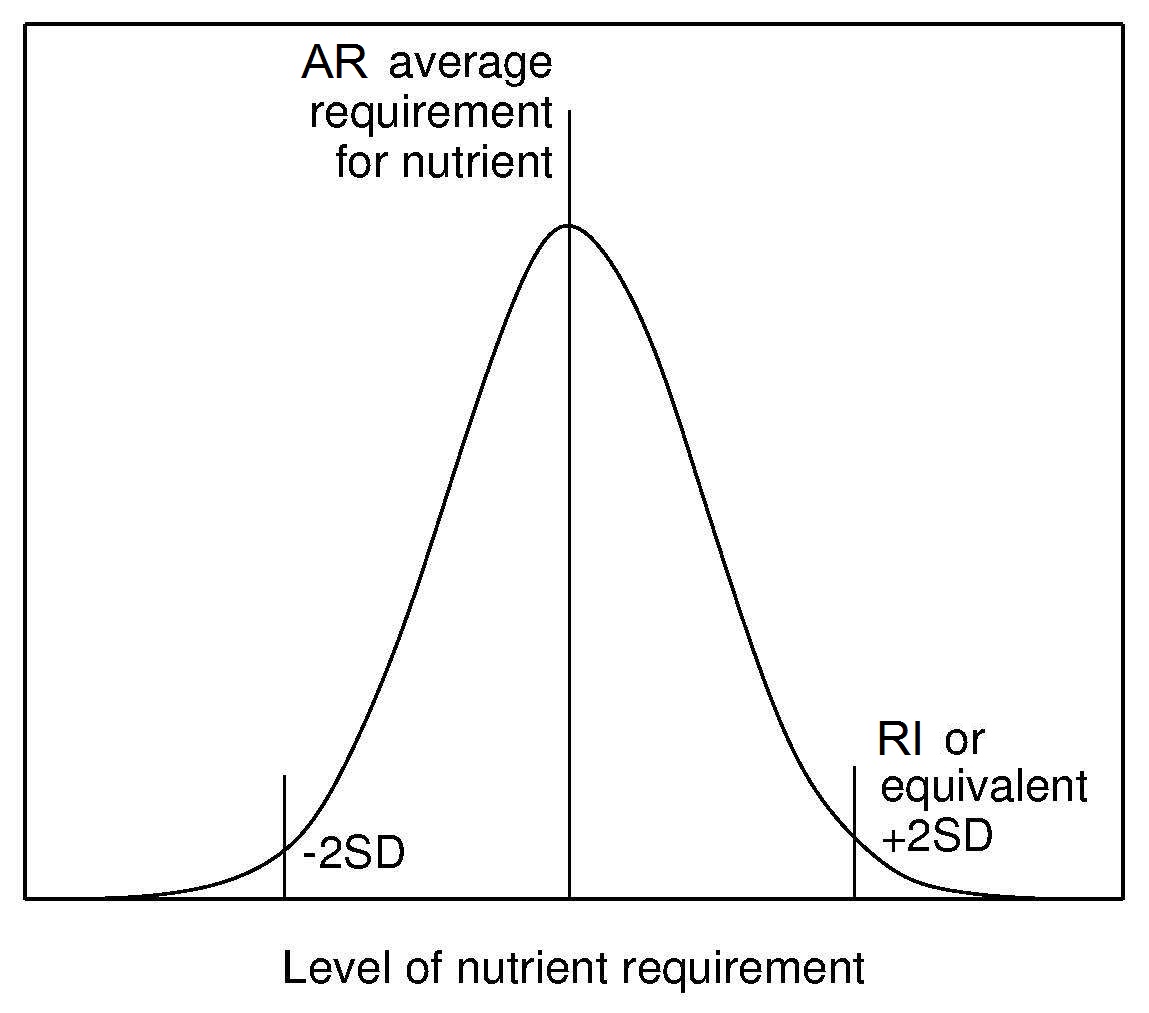
Recommended Intake (RI) (or equivalent) has been
established by all authoritative groups. The RI is derived from the
AR and its distribution (Figure 8a.6)
and is used to assess intakes and plan diets for individuals.
Currently, the convention has been to add 2SD to
the observed AR to cover the needs of most (i.e., 98%)
of individuals of the population. This means that an individual
whose intake is equal to RI98 (i.e., AR + 2SD of the AR)
has a 98% probability that their intake meets
their needs (Figure 8a.6).
In the initial harmonization initiative in 2005
(King and Garza, 2007)
it was suggested that in the future countries might wish to choose a lower percentile
level deemed to represent an acceptable risk for nutrient inadequacy
for an individual in their country instead of the conventional 98% (i.e., RI98).
To date, this suggestion has not been adopted.
Lower Reference Intake (LRI) (or equivalent) is also derived from the AR and its distribution and is set at 2 SD below the AR for each nutrient. This reference level represents the lowest intake that will meet the needs of some individuals. It has been established only by the UK and EFSA (Table 8a.1).
Adequate Intake (AI) (or equivalent) is applied when
there is not enough information to
establish an AR for a specific nutrient. The AI
is defined as the
observed or experimentally derived usual intake by a population
group that appears to sustain health
(King and Garza, 2007).
The methods used to estimate the AIs vary. For example, for infants < 6mo,
AIs are generally based on mean nutrient intakes (except vitamin D)
supplied by human milk, whereas for children and adults the
AIs can be derived from observed median intakes from
national survey data, based on limited experimental data,
or in some cases, epidemiological studies
(Trumbo et al., 2013).
In general, mean usual nutrient intakes at the population
level at or above the AI indicate a low probability of inadequacy.
No assumptions can be made, however, about the prevalence of
inadequate intakes when the mean intake of a group falls
below the AI. Likewise, if an individual's usual intake equals or
exceeds the AI, the diet is almost certainly adequate but again when
the usual intake of an individual falls below the AI, no estimate can be made
of the probability of nutrient inadequacy (IOM, 2000).
As noted previously, the Harmonization
Committee urged that strenuous efforts should be made to
establish an AR for each nutrient so that the inappropriate
use of an AI can be avoided.
Energy Requirements are based on the average requirements (AR)
for energy of individuals in a
specified sex and life-stage group. The recommendations are
not appropriate for the
definition of requirements at the individual level. Adding an
increment equivalent to 2SD to the average
energy requirement would result in a recommendation that
exceeds requirements and lead to overweight and obesity over the
long term. Energy requirements are derived with the
assumption that the requirements for all other nutrients are met
(King et al., 2007).
The energy requirement is defined by FAO/WHO/UNU
(2004)
as:
- Set for a particular group of individuals with specified characteristics, consuming a specified diet;
- Refer to the average daily need over a reasonable period of time, although the latter has seldom been defined; hence, the suggested amounts do not have to be consumed every day, but omissions or shortfalls must be balanced by increased intake on other occasions;
- Refer to levels of intake needed to maintain health in already healthy individuals; they do not allow for illnesses or stresses in life;
- Based on the typical dietary pattern of the country and may not be appropriate for persons following atypical diets;
- Consider possible interactions that involve nutrients and other dietary components and quantify them, if possible; and
- Assume that requirements for energy and all the other nutrients are met.
“The amount of food energy needed to balance energy expenditure in order to maintain body size, body composition, and a level of physical activity consistent with long-term good health. This includes the energy needed for optimal growth and development of children, for the deposition of tissues during pregnancy, and for the secretion of milk during lactation consistent with the good health of mother and child.”The criterion chosen on which to base the AR for energy is the total energy expenditure (TEE). When body weight and composition is stable in normal-weight individuals, the energy requirement is equal to TEE . In the past TEE for some life-stage groups was estimated indirectly by estimating the amount of energy consumed from self-reported food intakes and equating it with the amount of energy expended. This procedure was used by FAO/WHO/UNU (1985) and the United Kingdom (COMA,1991) to set the energy requirement for young children, but has now been abandoned in view of the concerns about the underestimation of energy intakes due to under-reporting; see Chapter 7 for more details. The doubly labeled water method (DLW) method is the most accurate method for measuring TEE in free-living individuals and is now used by several authoritative groups including FAO/WHO/UNU (2004), the U.S. IOM (2005 and the UK SACN (2012); see Chapter 7 for details of the DLW method. TEE measured with DLW method includes the energy used to synthesize growing tissues but does not include the additional energy content of the tissue constituents (basically fat and protein) laid down during normal growth and pregnancy, or the milk produced during lactation. Appropriate Macronutrient Distribution Range (or equivalent) serves as a guide to the distribution of percentage energy consumed as protein, fat, and carbohydrate said to be consistent with both the maintenance of health and a reduced risk of diet-related chronic disease, while providing adequate levels of essential nutrients. Increasingly, recommendations are being made for the contribution of free sugars as percentage of energy from total carbohydrate, as well as daily intakes of salt, dietary fiber, fruits and vegetables. (WHO, 2012; WHO, 2015), Although in general the range of intakes set are comparable, their meaning and application differ, with those of the United Kingdom (Section 8a.4.6), EFSA (Section 8a.6.6) and WHO (Section 8a.7.6) being population mean intake goals, whereas those established by the United States and Canada (Section 8a.5.6) are intended for individuals. NRVs for Chronic Disease Prevention are being developed by several authoritative groups. However, several challenges have been encountered; these are itemized in Box 8a.5:
Box 8a.5: Challenges in defining NRVs for chronic disease prevention
A Chronic Disease Risk Reduction (CDRR) has been established for sodium in relation to the benfits of a reduced intake
of sodium on cardiovascular disease risk, hypertension risk, systolic blood pressure
and diastolic blood pressure. The CDRR for sodium was defined as:
- Relationships between diet and chronic disease are multifactorial in nature, and dependent on a variety of both nutritional and non-nutritional factors. These may include baseline risk for chronic disease by an individual, nutrient-diet or nutrient-nutrient interactions, and environmental and other lifestyle factors;
- Chronic diseases develop over a long period making it difficult to accurately measure dietary patterns over such a long period of exposure;
- Published intervention trials are often conducted in selected subgroups, such as individuals with an already increased risk of disease or history of disease, frequently with intervention dosages that are relatively high and which have relatively short follow-up periods.
- Evidence from observational studies can be compromised by uncertainty arising from problems of confounding, bias, and inaccuracy;
- Use of a validated dietary biomarker of nutrient exposure requires an estimate of the nutrient intake that corresponds with the clinical outcome;
- Challenges arise with the selection of meaningful and suitable outcome indicators for the chronic disease or an intermediate surrogate biomarker as a valid predictor of the chronic disease.
- Surrogate biomarkers are often required because the exposure and outcome are separated by such a long time period that clinical signs or symptoms may not be observed for many years. Criteria developed for a qualified surrogate biomarker are available in IOM (2010).
“The intake above which intake reduction is expected to reduce chronic disease risk within an apparently healthy population.” (NASEM, 2019)For further discussion of these challenges and proposed solutions, see Yetley et al. (2017).
8a.4 U.K. Dietary Reference Values
The United Kingdom was the first country to adopt a frame-work for developing Nutrient Reference Values and these are termed “Dietary Reference Values” (DRVs) in COMA,1991; the frame-work used is depicted in Figure 8a.1. The generic term “Dietary Reference Values” was used to embrace three reference levels: the “Estimated Average Requirement” (EAR = AR), the “Reference Nutrient Intake” (RNI = RI), and the “Lower Reference Nutrient Intake” (LRNI, set at 2SDs below the AR). The term “reference values” was adopted in an effort to prevent users interpreting the figures as recommended or desirable intakes. Instead, the expert panel hoped that users would select the figure most appropriate for its intended use (Beaton, 1998). UK Nutrient Reference Values for certain nutrients are not available for children < 5y of age. NRVs for thiamin and niacin equivalents were recalculated in 2011, based on the revised energy requirements established using a new approach (Section 8a.4.5) (SACN, 2012). The NRVs for vitamin D for males and females aged 1–18y were also revised in 2016 (SACN) and now include a recommendation for selected life-stage groups to take a daily vitamin D supplement, especially from October to March. A recent review of nutritional requirements of adults aged > 65y in the UK (Dorrington et al., 2020) has concluded there is evidence to support age-specific UK recommendations for those aged > 65y, for the RNIs for protein (1.2g per kg/d), calcium (1,000mg/d), folate (400µg/d), vitamin B12 (2.4µg/d) although to date, none of these suggested changes have been made by SACN (2016). In contrast, Dorrington et al. (2020) suggest that the current recommendations for the general population for sugars, dietary fiber and fatty acids, sodium and alcohol are probably appropriate for older adults.8a.4.1 U.K. Estimated Average Requirement (EAR = AR) for nutrients
The term “Estimated Average Requirement” (EAR) in COMA,1991 represents the level of the nutrients estimated to meet the nutrient requirement of 50% of the healthy individuals in a particular sex and life- stage group. The EAR is especially useful for evaluating the possible adequacy of nutrient intakes of population groups.8a.4.2 U.K. Reference Nutrient Intake (RNI)
Reference Nutrient Intakes (RNIs) were defined as 2SDs above the average requirement for each nutrient and represent the target for an individual's nutrient intake. The U.K. RNIs for minerals and vitamins are shown in Appendix 8a.1 and Appendix 8a.2 respectively. When data about variability in requirements were insufficient to calculate a SD, a coefficient of variation for the EAR of 10% was assumed. Habitual intakes above the RNI98 will be adequate for all but 2–3% of individuals in a specific sex and life-stage group. The RNI should not be used in relation to groups (COMA,1991).8a.4.3 U.K. Safe Upper Levels for Nutrients
Safe upper levels were set by the U.K Expert Group on Vitamins and Minerals (EVM, 2003). They represents an intake that can be consumed daily over a lifetime without significant risk to health. Intakes from all sources were taken into account. The EVM group defined ULs for vitamin B6, β-carotene, vitamin E, zinc, copper, selenium, boron and silicon, and also provided guidance for those nutrients for which the database was inadequate to establish a UL. Nutrients in this category included biotin, folic acid, niacin, riboflavin, pantothenic acid, thiamin, vitamin B12, vitamin A, vitamin C, vitamin D, vitamin K, chromium, cobalt, iodine, manganese, molybdenum, nickel, tin, calcium, phosphorus, magnesium, iron, iodine, chromium, tin, and potassium. Suggested levels for these nutrients would not be expected to be associated with any adverse effects. Nevertheless, the EVM acknowledged that for those nutrients for which the database was inadequate to establish a UL, the suggested levels may not be applicable to all life stages or for lifelong intake, and should not be used as a UL.8a.4.4 U.K. Additional Levels
Lower Reference Nutrient Intakes (LRNIs) were set by COMA,1991 at two standard deviations below the AR for each nutrient. The LRNIs represent the lowest intakes that will meet the needs of some individuals in the group. The LRNIs are used as a monitoring tool for the UK National Diet and Nutrition Surveys. Habitual intakes below the LNRI are almost certainly inadequate for most individuals. For confirmation, however, biological parameters should be measured, especially when the nutrient intake of the individual lies between the LRNI and the EAR. Safe Intake values were also set for some nutrients with important functions in humans, but for which the expert committee considered there were insufficient data to set DRVs (e.g., biotin, pantothenic acid, vitamin E, vitamin K, manganese, molybdenum, and chromium). Safe Intake was judged to be a level or range of intake at which there is no risk of deficiency and below a level where there is a risk of undesirable effects (COMA,1991).8a.4.5. U.K. Average Requirement for Energy
In view of the increasing risk of overweight and obesity in the U.K., the SACN (2012) adopted a prescriptive approach and identified energy requirement values in relation to the best estimates of healthy body weights. Using this prescriptive approach, an overweight group consuming the amount of energy recommended for a healthy weight group are likely to lose weight whereas those underweight should gain weight (SACN, 2011). The U.K average requirements for energy for adults of specified age, sex, and height assuming a median physical activity level (PAL) of 1.63 and expressed as MJ/d or kcal/d are available as tables in (SACN, 2011). Values given in the tables are derived from mean heights in 2009 for England (Health Survey for England 2009). These revised values apply to all adults unless energy expenditure is impaired, when a lower PAL value of 1.49 should be used. For children aged 1-18y, age and sex specific energy requirements, with PAL values ranging from 1.40 to 1.75, are presented, expressed as MJ/d or kcal/d. Separate tables for infants by age and sex who are breast-fed, fed breast-milk substitutes, mixed-feeding or unknown by age and sex are given, expressed as both MJ/kg or kcal/kg per day and MJ/d or kcal/day. The energy requirements for infants were adopted from FAO/WHO//UNU (2004). The new U.K. factorial approach to establish energy requirements is based on the assumption that total energy expenditure (TEE) (or EAR) is equal to BMR × PAL (SACN, 2011). This approach was developed in recognition of the large unpredictable variation between individuals (inter-individual variation) in discretionary activity. This large inter-individual variation in discretionary activities is attributed in part to spontaneous physical activity (SPA). SPA includes body movements associated with activities of daily living, changes in posture, fidgeting, and a propensity for locomotion. An additional issue recognized by SACN (2011), is that PAL values, previously assumed to be independent of body weight, appear to have a complex relationship with body weight (Millward, 2012). Conventionally, TEE is expressed as a multiple of Basal Metabolic Rate (BMR) and (PAL). Therefore: \[\small \mbox{TEE = PAL × BMR}\] Hence \[\small \mbox{PAL = TEE / BMR}\] In this new approach, the PAL values were derived directly from DLW measurements of TEE in a reference population instead of applying PAL values predicted from lifestyle information, as used earlier by COMA in 1991 and 1994. Hence, to extract PAL values, TEE values measured by DLW in a suitable adult reference population were divided by BMR calculated from prediction equations of Henry (2005) and applying healthy body weights equivalent to a BMI of 22.5kg/m2 and at the appropriate height of the adult population. from that same reference population (Tooze et al., 2007; Moshfegh et al., 2008). From the data on the distribution of PAL values in the adult reference population, PAL values for the 25th, median, and 75th percentiles corresponding to sedentary, low, and moderate activity were identified: i.e., 1.49; 1.63, and 1.78, respectively. A separate 2006 data set for children was compiled from all DLW measurements of TEE of children aged over one year. The BMR for children was estimated using the equations of Henry (2005), applying healthy body weight based on the 50th percentile of the UK‑WHO Growth Standards (aged 1–4y) and the 50th percentile of the UK 1990 reference for children and adolescents aged > 4y. From these data, PAL values for children aged 1–3y, 3 to less than 10y, and 10–18y were identified. To account for the cost of energy deposition during growth of the children (not included in TEE measured by DLW), the PAL values were adjusted by a simple +1% adjustment of PAL (PAL × 1.01). This results in acceptably low levels of error for children aged 1–18y. Adjusted median PAL values for the three age groups were 1.40, 1.58, and 1.75. The reader is advised to consult SACN (2012) for more details.8a.4.6 U.K. Adequate Macronutrient Distribution Range (AMDR)
The United Kingdom also proposed recommendations for carbohydrate, sugars, fats, and fatty acids. These are not defined in the same way as those for the micronutrients. They represent average intakes for populations and not for individuals, which are consistent with good health, and are expressed as a percentage of daily total energy intake and as a percentage of food energy (i.e., excluding the contribution from alcohol). Table 8a.3| Dietary component | UK1, 2 | WHO2 | US/Canadian AMDRs |
|---|---|---|---|
| Total Fat* | Reduce to less than 35% of food energya (excluding alcohol) | 15–30% | 20–35% |
| Saturated Fat | Reduce to less than 11% of food energyb (excluding alcohol) | <10% | As low as possible with a nutritionally adequate diet |
| PUFAs | 6.5% | 6–10% | |
|
n-6 PUFAs (linoleic acid) | 5–8% | 5–10% | |
|
n-3 PUFAs α-linolenic acid | 1–2% | 0.6–1.2% | |
|
Trans fatty acids | < 2% | ≤ 1% | As low as possible with a nutritionally adequate diet |
| MUFAs | By differencec | UL not set | |
|
Totald carbo- hydrate** | 50% of food energyd with free sugars less than 5%e | 55–75% with free sugars <10% preferably <5% (25g/d) |
45–65% with added sugar < 5–15% total energy## |
| Protein | 15% | 10–15% | 10–35% |
| Cholesterol | No specific recom mendations | < 300mg/d | As low as possible with a nutritionally adequate diet |
| Dietary fiber | Adults 30g/d | Adults 25g/d | fTotal fiber AI: 19–50y: 25g/d > 51y: 21g/d |
|
Fruit and Vegetables | Increase to ≥ 5 portions (400g) of a variety of fruit and vegetables per day | ≥ 400g/d | 9–10 servings/d for Canadian adults 5–9 servings/d for U.S. adults |
| Alcohol | Should not provide more than 5% of energy in dietg | ||
| Salt (Adults) | Not > 6g/d (2.4g Na) |
Not > 5g/d (2g Na) |
< 2.3g/d; if ≥ 51y then < 1.5mg/dh### |
8a.5 United States and Canada: Dietary Reference Intakes
The United States and Canada have also adopted a paradigm for nutrient reference values that incorporates data to optimize health, prevent risk of chronic disease, and avoid deficiency. Their approach also provides multiple reference intakes for each nutrient to meet an expanding list of uses. Specifically, the U.S. Food and Nutrition Board has expanded their definition of requirements to:- Consider reduction in the risk of chronic degenerative disease, where possible
- Establish an upper level of intake designed to avoid risk of adverse health effects, where data exist
- Include components of food not conventionally considered to be essential nutrients (eg choline, carotenoids, lycopenes, boron, vanadium) but which may have a possible benefit to health.
8a.5.1 U.S. and Canadian Estimated Average Requirement (EAR = AR) for nutrients
This is defined as the median requirement for a specified criterion of adequacy for individuals of a certain life-stage and gender group. The specific criterion selected is defined by a specific function or biochemical measurement for each nutrient. Values for the EARs for nutrients are available in separate reports of the IOM (1997, 1998, 2000, 2001, 2002). When the mean usual intake of the group is equal to the EAR, 50% of the healthy individuals in that particular life-stage and sex group, meet their requirement and the other half of the group do not. Hence, usual intake at this level is associated with a 50% risk of inadequacy (Barr et al.,2003). As noted earlier (Section 8a.2.4), each EAR refers to the average daily nutrient intake of apparently healthy persons over time, and this quantity does not have to be consumed every day. The EAR is especially useful for evaluating the possible adequacy of nutrient intakes of population groups. U.S. and Canadian EARs for elements and vitamins are included in Appendix 8a.3 and Appendix 8a.4 respectively.8a.5.2 U.S. and Canadian Recommended Daily Allowance (RDA = RI)
This refers to the intake level that meets the daily nutrient requirements of almost all (≈ 98%) of the individuals in a specific life-stage and sex group. Values are given in the separate reports of the IOM (1997, 1998, 2000, 2001, 2002) (Barr et al., 2003). If the variation in requirement is well defined and symmetrically distributed, then the RDA is set at two standard deviations above the EAR: intakes at this level have a probability of adequacy ≈ 98% \[\small \mbox{RDA} _{98} \mbox{ = EAR + (2 SD)}\] If a coefficient of variation (CV) for the EAR of 10% is assumed, and as CV=SD/EAR, then . \[\small \mbox{RDA} _{98} \mbox{ = EAR + (0.1 × EAR) + (0.1 × EAR)}\] Or: \[\small \mbox{RDA} _{98} \mbox{ = 1.2 × EAR }\] Alternatively, if the CV is 15%, then: \[\small \mbox{RDA} _{98} \mbox{ = 1.3 × EAR }\] When the DRIs were first derived, a CV of 12.5% for protein, 15% for copper, molybdenum, and niacin, and 20% for both vitamin A and iodine was applied (King et al., 2007). No RDA was proposed when there was not enough data to establish an EAR for that nutrient. Because the usual intake at the level of the RDA98 is, by definition, associated with a very low (2–3%) risk of inadequacy to an individual, the RDA98 is used as a recommended intake when assessing intakes and planning diets for individuals. For example, the appropriate target for phosphorus intake for a woman aged 31–50y is the RDA of 700mg. The RDA should not be used to assess the intakes of groups. RDA values for elements and vitamins are shown in Appendix 8a.3 and Appendix 8a.4 respectively.8a.5.3 U.S. and Canada: Tolerable Upper Intake Level (UL) for nutrients
The Tolerable Upper Intake level (UL) for nutrients is the highest usual daily nutrient intake level likely to pose no risk of adverse health effects for almost all individuals in a life-stage and sex group. ULs have not been set for some nutrients with limited scientific data. Details of the adverse health effects used to set the ULs are given in the IOM reports (2000, 2001, IOM, 2011). For some nutrients such as vitamin C, vitamin A, vitamin D, calcium, phosphorus, magnesium, copper, zinc, iron, selenium, iodine, and manganese, the UL refers to the total intake from all sources, including food, fortified food, water, supplements, and medications, where relevant. For others such as niacin and folate, the UL applies to forms from supplements, fortificants, and medications. The UL for magnesium represents intake from pharmacological agents only and does not include intake from food and water. In some cases, the form of the nutrient for the UL differs from that used for the RDA; examples include vitamin E, niacin, and folate. The UL should be used by health professionals to ensure that nutrient intakes are not too high. As intake increases above the UL, the risk of adverse health effects increases. The UL is based on risk-assessment methodologies similar to those used in toxicological studies (1998). Figure 8a.1 shows the relationship of the observed level of intake to the risk of inadequacy and toxicity for the EAR, RDA, and the UL reference values.8a.5.4. U.S. and Canada Additional Levels
Adequate Intake (AI) was also defined by the IOM and refers to a recommended average daily nutrient intake level based on observed or experimentally derived approximations or estimates of the nutrient intake by a group (or groups) of apparently healthy people. As noted earlier, for infants aged 0–6mo, the AI represents the nutrient intake values (except vitamin D) supplied by human milk (Allen et. al., 2018). The observed or derived intakes are assumed to be adequate. The AI is used when there are not enough scientific data to establish an AR (e.g., for fluoride, chromium, manganese, total fiber, and vitamins pantothenate, choline, and biotin), and is used as an intake goal for individuals. If the an individual's usual intake equals or exceeds the AI, their intake is almost certainly adequate, but if it falls below the AI, no estimate of the probability of nutrient adequacy can be made (IOM, 2000). Recently, AIs have also been set for sodium and potassium (NASEM, 2019).8a.5.5 U.S. and Canada: Estimated Energy Requirements
Estimated energy requirements (EER) were compiled by the IOM, and are detailed in IOM (2005). The EER is defined as the average energy intake required to maintain current body weight and physical activity level (PAL) (and to allow for growth or milk production, where relevant) in healthy, normal-weight individuals of a specified age, gender, height, weight, and PAL. Tables provide values as well as equations based on height, weight, sex, age, and level of activity to predict TEE. The EER values were based on DLW measurements of energy expenditure, and where relevant, the energy content of the tissue constituents (basically fat and protein) laid down in growing infants and children. When body weight and composition is stable in normal-weight individuals, the energy requirement is equal to total energy expenditure. Several regression equations were developed for estimating the energy requirements of different life-stage and gender groups. Separate equations for individuals with a normal body weight (ie BMI 18.5–24.9kg/m2) and those overweight or obese (BMI > 25kg/m2) were developed. An example for the equation for normal-weight men aged 19y and above is given below: \[\small\mbox{EER = 661.8 − (9.53 × Age [years])}\] \[\small\mbox{ + PA × (15.91 × Weight [kg] + 539.6 × Height [m])}\] Where PA = physical activity coefficient corresponding to a given physical activity level (PAL). Table 8a.4.| Height (m) | Weight (kg) for BMI of 18.5 kg/m2 | Weight (kg) for BMI of 24.99 kg/m2 | PAL2 | EER3 (kcal/d) BMI of 18.5 kg/m2 | EER3 (kcal/d) BMI of 24.99 kg/m2 |
|---|---|---|---|---|---|
| 1.50 | 41.6 | 56.2 | Sedentary Low active Active Very active | 1,848 2,009 2,215 2,554 | 2,080 2,267 2,506 2.898 |
| 1.65 | 50.4 | 1.50 | Sedentary Low active Active Very active | 2,068 2,254 2,490 2,880 | 2,349 2,566 2,842 3,296 |
| 1.80 | 59.9 | 81.0 | Sedentary Low active Active Very active | 2,301 2,513 2,782 3,225 | 2,635 2,884 3,200 3,370 |
| Physical activity category | PAL (multiples of basal energy expenditure) | Description | Physical Activity Coefficient (PA) M ≥ 19y F ≥ 19y |
|---|---|---|---|
| Sedentary | 1.0 to < 1.4 | Activities of daily living (ADL) only | 1.00 1.00 |
| Low active | ≥ 1.4 to < 1.6 | ADL plus walking about 2 miles/d (1.5/2.9)* or equivalent | 1.11 1.12 |
| Active | ≥ 1.6 to < 1.9 | ADL plus walking about 7 miles/d (5.3/9.9)* or equivalent | 1.25 1.27 |
| Very active | ≥ 1.9 to < 2.5 | ADL plus walking about 17 miles/d (12.3/22.5)* or equivalent | 1.48 1.45 |
8a.5.6. U.S. and Canada Acceptable Macronutrient Distribution Range
The Acceptable Macronutrient Distribution Range (AMDR) of intakes is defined as a range of intakes for a particular energy source associated with reduced risk of chronic disease, while providing adequate levels of essential nutrients (IOM, 2002). They are intended for use by individuals, and have been established for carbohydrate, protein, total fat, n-6 poly-unsaturated fatty acids, and α-linolenic acid, as shown in Table 8a.3. Individuals should have intakes that fall within the limits of the AMDRs. If the usual intake of an individual is below or above the AMDR, there is a potential for increased risk of both inadequate intakes of essential nutrients and chronic diseases (IOM, 2002). Note that IOM have also defined an EAR and RDA for protein.8a.6 European Dietary Reference Values
In 1993, the Scientific Committee for Food of the European Community (SCEC, 1993) proposed three reference values for each nutrient (Box 8a.6).
Box 8a.6 SCEC Dietary Reference Values
subsequently, over a seven-year period, the
European Food Safety Authority (EFSA)
has generated separate
publications on the NRVs for water, fats,
carbohydrates, dietary fiber, protein, energy and 14 vitamins and
13 minerals, as well as a summary report
(2017).
- Average Requirement
- Population Reference Intake
- Lower Threshold Intake
8a.6.1 European Average Requirements (ARs) for nutrients
The Average Requirement defined by EFSA is the mean requirement of a specific gender and life-stage group. The group was assumed to have a normal, symmetrical distribution, with the exception of the iron needs of menstruating women (2017). The EFSA ARs for vitamins, minerals, and trace elements for adults only shown in Table 8a.6. For the ARs for all life-stage groups for minerals and vitamins, see Appendix 8a.5 and Appendix 8a.6 respectively.8a.6.2 European Population Reference Intake (PRI = RI)
EFSA (2017) defined “Population Reference Intakes” as the intake level adequate for virtually all people in a population group. It corresponds conceptually with the RI98, and hence represents the AR + 2SD. The EFSA PRIs for vitamins, minerals, and trace elements for adults only are given in Table 8a.6 For the PRIs for all life-stage groups for minerals and vitamins, see Appendix 8a.7 and Appendix 8a.8 respectively. For some life-stage groups where no data were available, interpolation or extrapolation was used by EFSA to set ARs and PRIs. The reference heights and body weights used by EFSA for children aged 0–2y are from the WHO Child Growth Standard (WHO, 2006), whereas for older children 2–18y they use data from European children (van Buuren et al., 2012). Details of the reference body weights for children and adults used for scaling are given in (EFSA, 2017). Details of the criteria used to set the DRVs for infants (7–11mos, children (1–17y), adults, and pregnant and lactating women together with the type of studies used are also presented.8a.6.3 European Tolerable Upper Intake Level for nutrients
The Tolerable Upper Intake Level (UL) was defined by EFSA as the maximum level of total chronic daily intake of a nutrient (from all sources — food, supplements, fortificants, water) judged to be unlikely to pose a risk of adverse health effects in humans (2017). ULs for six vitamins and eight minerals were established by SCEC in 2006 which are available in a summary report (EFSA, 2018). This report also provides updated information for the UL for vitamin D for infants aged 0–6mo and 6–12mo.8a.6.4. European Additional Levels
| Nutrient | Average Requirement (AR) | Population Reference Intake (PRI) |
|---|---|---|
| Protein (g) | 0.66 g/kg/BW/d | 0.83 g/k/BW/d |
| Vitamins | ||
| Vitamin A (µg/d) | 570 (490) | 750 (650) |
| Thiamin (mg/MJ) | 0.072 | 0.1 |
| Riboflavin (mg/d) | 1.3 | 1.6 |
| Niacin (mg NE/MJ) | 1.3 | 1.6 |
| Vitamin B6 (mg/d) | 1.5 (1.3) | 1.7 (1.6) |
| Cobalamin(µg/d) | 4.0*** | 4.0 |
| Vitamin C (mg/d) | 90 (80) | 110 (95) |
| Folate (µg DFE/d) | 250 | 330 |
| Minerals | ||
| Calcium (mg/d) | 860*, 750** | 1000*, 950** |
| Phosphorus (mg/d) | 550*** | |
| Potassium (mg/d) | 3500*** | |
| Trace elements | ||
| Iron (mg/d) | 6 (7^, 6^^) | 11 (16^; 11^^) |
| Zinc (mg/d) | 7.5;9.3;11.0;12.7 (6.2;7.6;8.9;10.2) |
9.4;11.7;14.0;16.3 (7.5;9.3;11.0;12.7) |
| Copper (mg/d) | 1.6*** (1.5***) | |
| Selenium (ug/d) | 70*** | |
| Iodine (ug/d) | 150*** |
8a.6.5. European Average Requirement for Energy
The average requirements (ARs) for energy expressed as MJ/d for population groups within Europe are presented for specified age groups, and by gender for selected physical activity levels (PALs), depending on age (Table 8a.7); they are of limited use for individuals. ESFA also chose total energy expenditure (TEE) as the criterion on which to base the AR for energy for both adults and children. However, they determined TEE factorially from estimates of resting energy expenditure (REE), plus the energy needed for various levels of physical activity (PAL) associated with sustainable lifestyles in healthy individuals. The equation is shown below: \[\small\mbox{TEE = PAL × REE}\] where PAL is a given physical activity level, and REE is resting energy expenditure. Table 8a.7.| Age | PAL=1.4 M F | PAL=1.6 M F | PAL=1.8 M F | PAL=2 M F |
|---|---|---|---|---|
| 18–29y | 9.8 7.9 | 11.2 9.0 | 12.6 10.1 | 14.0 11.2 |
| 30–39y | 9.5 7.6 | 10.8 8.7 | 12.2 9.8 | 13.5 10.8 |
| 40–49y | 9.3 7.5 | 10.7 8.6 | 12.0 9.7 | 13.4 10.7 |
| 50–59y | 9.2 7.5 | 10.5 8.5 | 11.9 9.6 | 13.2 10.7 |
| 60–69y | 8.4 6.8 | 9.6 7.8 | 10.9 8.8 | 12.1 9.7 |
| 70–79y | 8.3 6.8 | 9.5 7.7 | 10.7 8.7 | 11.9 9.6 |
8a.6.6 EFSA Reference Intake Ranges for Macronutrients
Reference Intake Ranges for Macronutrients have also been set by EFSA and are available in the 2017 summary report . The Reference Intake Ranges are defined as the intake range for macronutrients, expressed as a percentage of the energy intake and are intended as population averages. They apply to ranges of intakes that are adequate for maintaining health and associated with a low risk of selected chronic diseases. Table 8a.8| Adults ≥18 | Pregnancy | Lactation | |
|---|---|---|---|
| Total Carbohy- drates (E%)(a) | 45–60 | ||
| Dietary fiber (g/d)(b) | 25 | ||
| Total Fat (E%)(a) | 20–35 | 20–35 | 20–35 |
| SFA | ALAP | ALAP | ALAP |
| LA (E%)(b) | 4 | 4 | 4 |
| ALA (E%)(b) | 0.5 | 0.5 | 0.5 |
| EPA+DHA (mg/d)(b) | 250 | 250 | 250 |
| DHA (mg/d)(b) | +100–200(c) | +100–200(c) | |
| TFA | ALAP | ALAP | ALAP |
8a.7 WHO/FAO Nutrient Reference Values
When vitamin and mineral requirements for a specific country are not available, the most recent NRVs in the WHO/FAO (2004) report are often used. In this report WHO/FAO defined three levels shown in Box 8a.7:
Box 8a.7 WHO/FAO Nutrient Reference Values
- Estimated Average Requirement
- Recommended Nutrient Intake
- Tolerable Upper Nutrient Intake Level
8a.7.1 WHO/FAO Requirement (R = AR) for Nutrients
The requirement is defined by WHO/FAO as an average daily nutrient intake level that meets the needs of 50% of the “healthy” individuals of a particular age and gender. It is based on a given criteria of adequacy which varies depending on the specified nutrient. Where necessary, an allowance for variations in nutrient bioavailability has been included. However, a requirement has been set by WHO/FAO for only a few nutrients. In the interim, Allen et al. (2006) have calculated the ARs from the RNIs for a limited range of vitamins and minerals for infants, children and adults. The conversion factors used were based on SDs derived by the U.S. Food and Nutrition Board of the Institute of Medicine (FNB/IOM) for calculating the U.S and Canadian RDAs. They are tabulated in Annex C of Allen et al. (2006). These calculated ARs are shown in Appendix 8a.9 .8a.7.2 WHO/FAO Recommended Nutrient Intake (RNI = RI))
The Recommended Nutrient intake requirement is defined as a daily nutrient intake set at the requirement (AR) plus 2SD. This meets the nutrient requirements of almost all apparently healthy individuals in an age and sex-specific population group. Thus, it is equivalent to, and derived in the same way as individual requirements set by COMA (1991) for the U.K., by IOM (2001) for the U.S. and Canada, and by EFSA (2017) in Europe. When the standard deviation for the nutrient requirement is unknown, WHO/FAO (2004) has generally assumed a CV of 10%–12.5%, although there are exceptions for some nutrients (e.g., zinc, see below). RNI values for dietary iron and zinc are based on estimates that meet the normative storage requirements, and are adapted from earlier reports (FAO/WHO, 1988; 1996). In these reports the normative requirement was defined as the mean requirement to maintain a level of tissue storage that is judged to be desirable. In Table 8a.9,| Age group | Assumed weight (kg) | Bioavailability High Mod. Low | ||
|---|---|---|---|---|
| Infants & children | ||||
| 0–6mo | 6 | 1.1a | 2.8b | 6.6c |
| 7–12mo | 9 | 0.8a | — | — |
| 7–12mo | 9 | 2.5d | 4.1 | 8.4 |
| 1–3y | 12 | 2.4 | 4.1 | 8.3 |
| 4–6y | 17 | 2.9 | 4.8 | 9.6 |
| 7–9y | 25 | 3.3 | 5.6 | 11.2 |
| Adolescents | ||||
| F. 10–18y | 47 | 4.3 | 7.2 | 14.4 |
| M. 10–18y | 49 | 5.1 | 8.6 | 17.1 |
| Adults | ||||
| F. 19–65y | 55 | 3.0 | 4.9 | 9.8 |
| M. 19–65y | 65 | 4.2 | 7.0 | 14.0 |
| F. > 65y | 55 | 3.0 | 4.9 | 9.8 |
| M. >65y | 65 | 4.2 | 7.0 | 14.0 |
| Pregnant women | ||||
| 1st trimester | — | 3.4 | 5.5 | 11.0 |
| 2nd trimester | — | 4.2 | 7.0 | 14.0 |
| 3rd trimester | — | 6.0 | 10.0 | 20.0 |
| Lactating women | ||||
| 0–3 mo | — | 5.8 | 9.5 | 19.0 |
| 3–6 mo | — | 5.3 | 8.8 | 17.5 |
| 6–12 mo | — | 4.3 | 7.2 | 14.4 |
8a.7.3 WHO/FAO Upper Tolerable Intake Level (UL) of Nutrients
The WHO/FAO Upper Tolerable Nutrient Intake Levels are defined for a limited range of nutrients as the maximum intake from food (including fortified products), water and supplements of that nutrient that is unlikely to pose risk of adverse health effects from excess in almost all (97.5%) apparently healthy individuals in an age and sex-specific population group. The ULs were developed using the model outlined in (WHO/FAO, 2006). In October, 2017, the WHO held a technical consultation entitled: “Risk of excessive intake of vitamins and minerals delivered through public health interventions — current practices and case studies”. The proceedings of this technical consultation are available in a special issue. The reader is advised to consult the following for further details: (Pike and Zlotkin, 2019).8a.7.4 WHO/FAO Additional Levels
WHO/FAO (2004) adopted additional terms for certain nutrients. For vitamin A, for example, they adopted the term “Recommended Safe Intake,” as was used in their earlier report (FAO / WHO, 1988), because of the lack of data for deriving a true mean requirement and variance for any group. The Recommended Safe Intake level is set to prevent clinical signs of deficiency and allow normal growth, but it does not allow for prolonged periods of infection or other stresses. As such, it represents the normative storage requirement plus 2SDs.8a.7.5 WHO/FAO Human Energy Requirements
Energy requirements set by FAO/WHO (2004) are presented by gender and selected age groups and are expressed as energy (as kJ or kcal) per day and energy per kilogram of body weight. Requirements are also expressed as multiples of Basal Metabolic Rate (BMR). The recommendations for dietary energy intake are also accompanied by guidelines for desirable physical activity levels: see FAO/WHO (2004) for more details. Note that, like the U.K and EFSA, the FAO/WHO energy requirements are specifically “prescriptive” in relation to body weights, defining suitable reference ranges consistent with long-term good health, amd should be applied to population groups and not to individuals. The FAO/WHO (2004). energy requirements are based on estimates of TEE in free-living persons measured by DLW or other methods (e.g., individually calibrated heart rate monitoring) that give comparable results. They also modified their earlier factorial estimates of energy requirements which used occupational-related mean values of physical activity levels (PALs). Instead FAO/WHO (2004). used a range of life-style PAL values for each of the three lifestyles — sedentary, active, vigorously active, and shown in Table 8a.10.| Category | PAL value |
|---|---|
| Sedentary or light-activity lifestyle | 1.40–1.69 |
| Active or moderately active lifestyle | 1.70 –1.99 |
| Vigorous or vigorously active lifestyle | 2.00–2.40* |
8a.7.6 WHO/FAO Population Average Intake Goals for Macronutrients
The WHO ranges of population nutrient intake goals for preventing diet-related chronic diseases are shown in Table 8a.3. The recommendations are expressed as a proportion of the daily total energy intake rather than the absolute amount, with the exception of cholesterol and sodium, which are given in mg/d and g/d, respectively. This approach was adopted because the desirable up or down change will depend on the existing intakes in a given population (Nishida et al., 2004). The recommendations represent the population average intake that is judged to be consistent with the maintenance of health (i.e., low prevalence of diet-related diseases) in a population (IOM, 2002). Hence these focus on the maintenance of low population risk rather than low individual risk. In general, most of the ranges set are comparable to those of the U.K and the U.S. and Canada, although the meaning and application of the ranges differ. Exceptions are the recommendations by WHO/FAO for total fat intake which take into account countries with usual fat intake (as % energy) > 30% and < 15%. Total fat (as % energy) of at least 20% is consistent with good health. The recommendation to restrict the intake of free sugars to less than 10% energy was made in view of the recognition that higher intakes of free sugars provide significant energy without supplying specific nutrients, and hence can have a negative impact on diet quality. In addition, increasing or decreasing intake of free sugars is associated with parallel changes in body weight, a relationship that exists irrespective of the level of the intake of free sugars. The excess body weight associated with intake of free sugars arises from excess energy intake. Free sugars include monosaccharides and disaccharides added to foods and beverages by the manufacturer, cook, or consumer, and sugars naturally present in honey, syrups, fruit juices and fruit juice concentrations. WHO emphasize that whole grain cereals, fruits and vegetables are the preferred sources of non-starch polysaccharides (NSP) (See Table 8a.3). They state that whole grain foods should together provide > 20g per day of NSP and > 25g/d of total dietary fiber. Note that fruits and vegetables do not include tubers (i.e., potatoes, cassava). In addition to the population nutrient intake goals presented in Table 8a.3, WHO also emphasize the importance of maintaining at the population level an adult median BMI of 21–23kg/m2, and for individuals a BMI in the range 18.5–24.9kg/m2, with the avoidance of a weight gain greater than 5kg during adult life. Physical activity is also highlighted with a recommendation for a total of one hour per day on most days of the week of moderate- intensity activity , such as walking.8a.8 Sources of discrepancies in Nutrient Reference Values
In light of the preceding discussion, it is not surprising that estimates for AR for nutrients and the RI98 derived from them vary among countries. Table 8a.11| Nutrient | IOM AR | EFSA AR | UK EAR |
|---|---|---|---|
| Vitamins | |||
| Vitamin A (µg/d) | 625 | 570 | 500 |
| Vitamin D (µg/d) | 10 | 15A | - |
| Vitamin C (mg/d) | 75 | 90 | 25 |
| Thiamin (mg/d) | 1.0 | 0.072/MJ | 0.80B |
| Riboflavin (mg/d) | 1.1 | 1.3 | 1.0 |
| Niacin (mg NE/d) | 12 | 1.3/MJ | 14.0B |
| Vitamin B6 (mg/d) | 1.4 | 1.5 | 1.2B |
| Vitamin B12 (µg/d) | 2 | 4A | 1.25 |
| Folate (µg DFE/d) | 320 | 250 | 150 |
| Minerals | |||
| Calcium (mg/d) | 800 | 860*; 750** | 525 |
| Phosphorus (mg/d) | 580 | 550A | 400 |
| Magnesium (mg/d) | 350 | 350A | 250 |
| Trace elements | |||
| Iodine (µg/d) | 95 | 150A | - |
| Iron (mg/d) | 6 | 6 | 6.7 |
| Selenium (µg/d) | 45 | 70A | - |
| Zinc (mg/d) | 9.4 | 7.5 9.3;11.0;12.7 | 7.3 |
- Disparities in philosophy about the most appropriate methodological approach to use
- Interpretation of data on which ARs are based
- Differences in selection of the criteria used to define nutrient adequacy
- Uncertainty in extent of metabolic adaption during pregnancy and lactation due to limited data
- Differences in number of life-stage groupings among countries
- Limited data on requirements for certain nutrients and life-stage groups
- Differences in scaling (both interpolation and extrapolation) for subgroups based on known data for other populations (e.g., adults)
- Varying bioavailability factors depending on the composition of habitual national diets
- Unknown factors influencing nutrient requirements.
8a.9 Future directions in harmonizing the process for deriving Nutrient Reference Values
Nutrient Reference Values are used to assess the adequacy of nutrient intakes and for planning diets at both the individual and the popula tion level. They also have several important applications in food and nutrition policy, food regulation and trade. However, as highlighted above, the terminology and methodological approaches that are used for setting NRVs differ markedly among countries resulting in discrepancies in NRVs worldwide. Such disparate recommendations lead to international discrepancies in health, food policies and trade, highlighting important reasons for harmonizing the process for deriving NRVs globally; these reasons are summarized in Box 8a.8.
Box 8a.8 Reasons for harmonizing the process of deriving NRVs globally
Recently, the feasibility of the new harmonized approach for deriving Nutrient
Reference Values on a global scale has been confirmed following testing
with three exemplar nutrients (zinc, iron, and folate) on two high-risk population
subgroups — young children
and women of reproductive age, as noted in Section 8.2. The success of
the new framework depicted in Figure 8a.3,
however, depends on six core values:
- Improve objectivity and transparency of values derived by different national, regional, and international groups
- Provide a common basis or background for groups of experts to consider the processes leading to the development of the Nutrient Intake Values (NIVs)
- Allow for low-income countries with limited resources to convene groups of experts to identify how to modify existing reference values to meet the specific food supplies or international policies
- Provide a common basis across countries and regions for establishing global food and nutrition policies (i.e., fortification policies, regulatory issues)
- NRVs are regularly updated
- The process is clear and transparent
- The methods are rigorous and relevant
- Factors influencing the NRVs are documented
- The strength of the evidence is determined
- The review is complete and efficient.