Gibson RS1,
& Friel JK2,
Principles of
Nutritional Assessment: Iron
3rd Edition
January 2024
Abstract
Dietary iron is present as heme and nonheme iron, each absorbed by different mechanisms. Once absorbed, the iron released can be stored or bound to plasma transferrin for distribution to other tissues. Quantitatively, most iron is used by immature red blood cells in the bone marrow for hemoglobin (Hb) production. Senescent erythrocytes are degraded by macrophages, and the iron released from catabolized Hb re-enters the circulation. Absorption of iron is modulated in response to the level of body iron stores and by the amount of iron needed for erythropoiesis. Hepatic hepcidin is the master regulator of iron homeostasis. Hepcidin levels are suppressed by iron depletion or increased iron demand (i.e., enhanced erythropoiesis), thereby increasing absorption and mobilization of iron from body stores into plasma. In contrast, when iron stores are replete (and during inflammation), hepcidin levels are increased, so iron cannot efflux into the circulation, thus preventing iron overload. Anemia is the most common sign of iron deficiency in low- and middle-income countries, with with infants, young children, and women of child-bearing age at greatest risk. Features of iron deficiency anemia (IDA) include impairments in work capacity and cognition, and possibly risk during pregnancy of low birthweight and prematurity. Despite low specificity and sensitivity, a low Hb concentration is the most widely used test for IDA. Development of IDA occurs in three stages, the first being a decrease in iron stores, reflected by a low serum ferritin, followed by iron-deficient erythropoiesis. At this stage, iron stores are exhausted (i.e., serum ferritin < 12µg/L), iron supply to the erythropoietic cells is progressively reduced, and decreases in transferrin saturation occur. At the same time, serum soluble transferrin receptor (sTfR) and erythrocyte protoporphyrin increase. Only in the third stage is there a decline in Hb, decreases in hematocrit and red-cell indices, and frank microcytic, hypochromic anemia, confirmed by examination of a stained blood film. This chapter describes how to assess the adequacy of dietary iron intakes, followed by details of the hematological parameters used to diagnose anemia, the serum biomarkers to identify iron depletion (serum ferritin), and iron deficient erythropoiesis (serum ferritin; serum iron; transferrin saturation; sTfR; and erythrocyte protoporphyrin). Advantages and limitations are discussed together with details of the measurement and interpretive criteria for each biomarker. Use of a regression modeling approach to adjust for the effect of inflammation on serum ferritin and sTfR is highlighted, in view of the challenge of distinguishing between IDA and anemia of chronic disease. The final section emphasizes the simultaneous use of multiple iron biomarkers to provide a more valid assessment of iron status and minimize misclassification that may occur when using a single measure. The advantages of using the “Total Body Iron Model” based on serum ferritin and sTfR expressed as body iron (mg/kg), with a cutoff of < 0mg/kg to define iron deficiency, is described. Finally, details of emerging iron indicators, notably hepcidin, non-transferrin-bound iron, and some reticulocyte indices, are presented. CITE AS: Gibson RS, and Friel JK. Principles of Nutritional Assessment: Iron. https://nutritionalassessment.org/iron/Email: rosalind.gibson@otago.ac.nz
Licensed under CC-BY-4.0
17.1 Introduction and functions of iron
The assessment of the iron status of the population is critical: iron deficiency is a widely recognized micronutrient deficiency, and a public health problem worldwide. The iron content of the human body is carefully regulated, normally containing about 3 to 4g of iron. Of this, about 65% is present in hemoglobin (Hb), the oxygen-carrying pigment of the red blood cells, that plays a critical role in transferring oxygen from lung to tissues. Hemoglobin is made up of four heme subunits, each with a polypeptide chain of globin attached. Each molecule of heme consists of a protoporphyrin IX molecule with one iron atom. In addition, about 3.5% of body iron is present in myoglobin, the oxygen-binding storage protein found in muscle. The structure of myoglobin is similar to Hb, except that it contains only one heme unit and one globin chain.17.1.1 Distribution of body iron in men and women
Table 17.1Amount of Iron | Male (mg) | Female (mg) |
% of Total |
---|---|---|---|
Total | 3000‑4000 | 2000‑3000 | 100 |
Hemoglobin | 2400 | 1700 | 65 |
Intracellular storage (ferritin and hemosiderin) | 1000 | 500 | 30 |
Myoglobin | 150 | 120 | 3.5 |
Transferrin- bound iron | 4 | 3 | 0.1 |
17.1.2 Absorption and metabolism of iron
Four main factors in the body operate to maintain iron balance and prevent iron deficiency and iron overload. These are: (a) intake, (b) absorption (c) storage, and (d) loss of iron. The interrelationship of these factors has now been described mathematically, so that the amount of storage iron can be predicted as long as iron losses and bioavailability of iron are known (Hallberg et al., 1998). In an iron-sufficient adult male, absorption of iron from the diet only contributes about 1mg/d, while for menstruating women, about 1.5mg/d is absorbed to compensate for menstrual blood loss. There are two different forms of iron in the diet, heme and nonheme, each absorbed primarily in the duodenum. Heme iron is derived mainly from Hb and myoglobin in red meat, poultry, and fish and is absorbed readily as the intact iron porphyrin. Absorption of heme iron ranges from 15‑35% and is little affected by dietary factors; absorption is regulated primarily in response to total body iron. As demand for body iron increases there is a corresponding upregulation in the uptake of heme iron and also in the rate of transfer to the duodenal enterocytes. Details of the exact mechanism controlling heme iron absorption are poorly understood (Anderson and Frazer, 2017). However, once absorbed, iron (Fe2+) is released from heme iron by heme oxygenase, after which the iron follows the same pathway as nonheme iron, as described below (EFSA, 2015). Nonheme iron (i.e., inorganic iron) is found primarily in plant-based foods, but also in meat, eggs, and some dairy foods. Liver, iron-fortified foods, and the seeds of legumes, such as beans, contain nonheme ion in the form of ferritin, although the mechanism whereby ferritin iron is absorbed is poorly understood (EFSA, 2015). Plant ferritin is readily released during cooking and digestion (Lynch et al., 2018). The absorption of nonheme iron is less efficient than heme iron and can range from 2‑20%, depending on the iron status of the individual and the simultaneous ingestion of other dietary components; some inhibit and others enhance nonheme iron absorption. Most of the food components classed as inhibitors generally act by binding iron in the gastrointestinal tract, preventing its absorption. In contrast, the enhancers act by forming complexes that can be taken up by the intestinal iron transport proteins, thus preventing the iron from binding to the inhibitors. Alternatively, they act by reducing the reactive ferric (Fe3+) iron to its less reactive and more soluble ferrous (Fe2+) state. Inhibitors of nonheme iron absorption include phytic acid, polyphenols, calcium, and peptides from partially digested proteins (e.g., soybean protein). Of these, phytic acid (myoinositol hexa-phosphate, IP6) is the main inhibitor of nonheme iron absorption from plant-based diets. However, traditional food processing methods such as soaking, germination, and fermentation can lower the phytic acid content, either by reducing the water-soluble phytate content, or by phytase hydrolysis converting the phytic acid to lower myo-inositol phosphate forms that no longer inhibit nonheme iron absorption (i.e., IP2; IP1) (Gibson et al., 2018). Polyphenol compounds from beverages such as tea, coffee, cocoa, and red wine, vegetables (spinach, aubergine), legumes (colored beans), and cereals such as red sorghum, also inhibit nonheme iron absorption. Their inhibitory effect is dose-dependent, the strength depending on the structure of the phenolic compounds, with the gallate-containing tea polyphenols having the largest inhibitory effect (Hurrell et al., 1999). Calcium inhibits both nonheme and heme iron absorption, although the inhibitory effect is weak and short-term, with a mixed effect on iron status and no reduction in Hb (Abioye et al., 2021). The mechanism is not well understood (Lynch et al., 2018). In contrast, ascorbic acid and muscle tissue from meat, poultry, fish and liver, enhance nonheme iron absorption when eaten in meals containing inhibitors (Lynch et al., 2018). Of these, ascorbic acid is the most potent enhancer of nonheme iron absorption through its ability to convert ferric (Fe3+) iron to ferrous (Fe2+) iron at low pH as well as its chelating properties (Conrad and Scade, 1968). The enhancing effect of ascorbic acid is dose-dependent and most marked when consumed with meals containing high levels of inhibitors, including phytate and polyphenols. Ascorbic acid can also enhance absorption of many iron fortification compounds (Hurrell et al., 2004), except NaFeEDTA (Troesch et al., 2009). The mechanism whereby muscle tissue enhances nonheme iron absorption is not clear. It may be linked to cysteine-containing peptides released during digestion, which have the potential to reduce ferric (Fe3+) iron to ferrous (Fe2+) iron and chelate iron as described for ascorbic acid (Taylor et al., 1986). The intestinal absorption of nonheme iron has been extensively studied; for details see Anderson and Frazer (2017). Briefly, the nonheme iron in foods that exists predominantly as ferric (Fe3+) iron is solubilized in the gastrointestinal lumen, where first it is reduced by duodenal cytochrome b reductase (DCYTB) to ferrous iron (Fe2+) before being transported by the iron-import protein divalent metal-ion transporter 1 (DMT1) into the enterocytes of the small intestine. When demand for iron is low, the iron can be stored within the cell as the iron storage protein ferritin. When the demand for body iron is high, iron is either taken up by mitochondria for the synthesis of heme, or exported into the circulation by the iron export protein ferroportin 1 (FPN1). To leave the cell and bind to plasma transferrin, however, Fe2+ must be oxidized back to Fe3+. This oxidation is catalyzed by a membrane-bound ferroxidase hephaestin. Transferrin-bound iron is then distributed via the circulation throughout the body to sites of utilization (Figure 17.1).
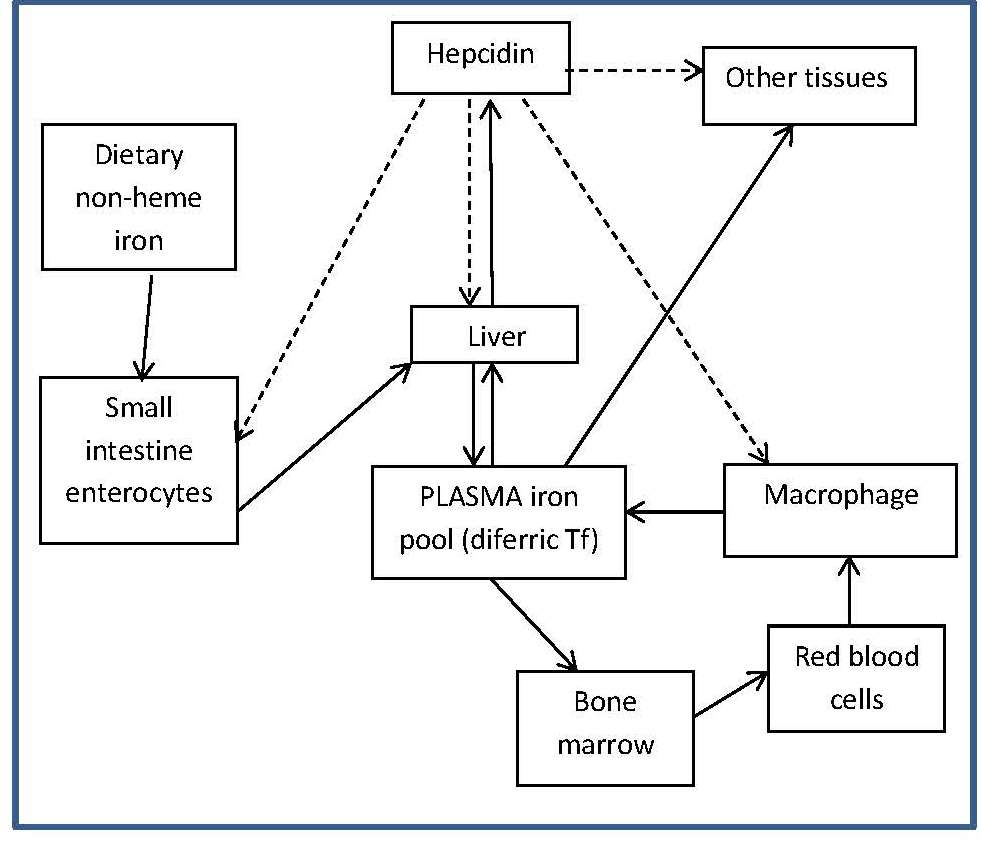
 Most of the iron is used by immature red blood cells in the bone marrow for Hb production. Cells can take up iron in a variety of forms. All nucleated cells are capable of using transferrin-bound iron, although some cell types can take up iron in other forms, including non-transferrin-bound iron, or iron present within ferritin, heme, or Hb. Uptake and storage of iron in cells is tightly controlled by iron regulatory proteins. These ensure the iron supply to the cell is maximized when the cell has an iron deficit. Alternatively, when the cell is iron replete, the supply of iron to the cell is restricted and storage promoted. For more details of the regulation of iron homeostasis at the cellular level, see Anderson and Fraser (2017). Whole-body iron levels are also strictly regulated. This regulation is mediated by the liver-derived peptide hepcidin which is responsible in part for the control of dietary iron absorption as well as the export of iron from body stores. When iron stores are low or iron utilization such as erythropoiesis is increased, and when plasma transferrin concentration is reduced, hepcidin production is suppressed, stimulating absorption and delivery of iron to the plasma from storage sites. As a consequence, more iron enters the circulation. In contrast, when hepatic storage iron and circulating transferrin concentrations are high, the production of hepcidin is increased, thereby reducing intestinal iron absorption and inhibiting the release of iron from body stores (Figure 17.1, Anderson and Frazer, 2017). Hepcidin production is also stimulated by cytokines such as interleukins 1 and 6 induced by inflammation (see “Acute and chronic inflammation” in Section 17.7.1 for more details). The primary storage sites for iron are the cells of the liver, spleen, and bone marrow. Iron is stored in the form of the soluble protein complex ferritin, or insoluble hemosiderin, as noted earlier. Iron from both forms of storage iron can be mobilized efficiently when required elsewhere in the body (Anderson and Frazer, 2017). The amount of iron in the stores varies widely, depending on iron status and sex. When the iron supply exceeds the cell’s functional needs, ferritin production in the liver is increased, whereas when the supply is insufficient, iron bound to ferritin will be mobilized from the liver store. Unlike many other micronutrients, there are no active pathways for excreting iron. Instead, mechanisms exist to maintain both cellular and whole-body iron levels within the optimal physiologic range, as noted above. Total daily iron losses are small and occur mainly in the feces (0.6mg/d), although very small amounts are also lost in desquamated skin cells and sweat (0.2‑0.3mg/d), and in urine (< 1mg/d). Most of the iron excreted in the feces is from unabsorbed dietary iron, although a small amount is systemic iron derived primarily from biliary secretions. Total daily iron losses are larger (≈ 1.3mg/d) in premenopausal women, because of the additional loss of iron in menstrual blood. On average, menstrual blood loss is 30‑40mL per cycle or 0.4‑0.5mg iron per day, although in some women it is much greater (Yip and Dallman, 1996). Most of the heme iron in erythrocytes is recycled for Hb synthesis at the end of the erythrocyte's functional lifetime (on average 120d). At this time, the erythrocytes are phagocytosed by specialized macrophages in the spleen, liver, and bone marrow. The heme iron is released from catabolized Hb and is either returned to the plasma via ferroportin where it is bound to transferrin, or it is incorporated into ferritin for temporary storage, depending on the iron status of the individual. Smaller quantities of iron are exported by other cells, particularly hepatocytes. This process is termed “iron turnover”; each day 25mg systemic iron is recycled, representing 0.66% of the total iron content of the body.17.1.3 Micronutrient interactions with the potential to affect iron absorption and/or metabolism
Deficiencies of iron, vitamin A, iodine, and zinc are major public health problems in low-income countries. They often occur concurrently, especially among infants, young children, and women of reproductive age living in impoverished settings. These high-risk groups all have high micronutrient requirements, but frequently low intakes of poorly bioavailable micronutrients. Interactions have been described between these micronutrients, although the mechanisms are not always fully understood. Iron-vitamin A interactions. Vitamin A may affect several stages of iron metabolism, including erythropoiesis, incorporation of iron into Hb, and the mobilization of iron from ferritin stores (Zimmermann et al., 2006). Vitamin A is also said to affect iron absorption, but whether the effect is determined by vitamin A and/or iron status is uncertain (Hurrell and Egli, 2010). Reports of a positive impact of vitamin A on Hb and some iron status indices have been observed in several vitamin A supplementation / fortification trials (Michelazzo et al., 2013), although the precise mechanism remains uncertain. Based on these reports, vitamin A deficiency is now recognized as a contributor to anemia, especially in children (Calis et al., 2008). Iron-iodine interactions. Numerous animal studies indicate that iron deficiency with or without anemia impairs thyroid metabolism (Hess et al., 2002). An iron-dependent enzyme, thyroperoxidase, acts by catalyzing the two initial steps in thyroid hormone synthesis (Hess et al., 2002). Iron deficiency may also reduce thyroid hormone synthesis by inducing alterations in the thyroid hormone feedback system (Lynch et al., 2018). In intervention studies in Morocco and the Ivory Coast, administration of both iron and iodine to iron-deficient goitrous children decreased goiter rates more effectively than did the administration of iodine alone (Zimmerman, 2002). Iron-zinc interactions. Iron and zinc appear to compete for absorption, possibly via the shared divalent metal transporter 1 (DMT1) and/or via transporters in the apical membrane of small intestine enterocytes; the mechanism remains uncertain (Kondaiah et al., 2019). This inhibitory effect only occurs when therapeutic doses (2‑3‑fold molar excess or higher, iron relative to zinc) are given to humans in aqueous solutions but not in a complex food matrix (Olivares et al., 2012). To date there is no evidence that this interaction is associated with any clinically significant adverse effects (Fischer-Walker et al., 2005; Lim et al., 2013), obviating concerns regarding the use of both iron and zinc supplements in public health programs. For a comprehensive review of the possible mechanisms for this iron-zinc interaction, see Kondaiah et al. (2019). Iron-cadmium and iron-lead. Iron deficiency is a risk factor for increased concentrations of cadmium and lead in the blood. For cadmium, this is likely due to increased absorption arising from the elevated levels of divalent metal transporter 1 (DMT) that occur in iron deficiency, but for lead, the mechanism is uncertain (EFSA, 2015).17.1.4 Deficiency of iron in humans
Iron deficiency may arise from inadequate intakes of dietary iron, poor absorption, excessive iron losses, or a combination of these factors. Individuals at greatest risk for iron deficiency include those with high iron requirements for growth (i.e., infants, children and pregnant women), and women of child bearing age with high menstrual losses. Several risk factors have been identified. In industrialized countries, prematurity or low-birthweight, the use of a non-iron-fortified formula, the introduction in young children to cow's milk in the first year of life, and exclusive breastfeeding after 6mos without the regular feeding of iron fortified complementary foods, are all frequently observed causal factors. Among pregnant women, diets low in iron-rich foods, a short interpregnancy interval, and increasingly, obesity, are implicated (Kemper et al., 2017). Additional contributing factors associated with an increased risk of non-anemic iron deficiency among women of child-bearing age with high menstrual losses may include low intake of flesh foods, recent blood donations, nose bleeds, and low body mass index (Heath et al., 2001). In some impoverished settings, additional factors causing iron deficiency may include: bleeding arising from exposure to parasitic helminths (e.g., hookworm) or schistosomiasis, impaired absorption from infection / inflammation or possibly chronic Helicobacter pylori gastritis. In rare cases, genetic disturbances in iron homeostasis arising from genetic mutations, such as in the TMPRSS6 gene, may result in iron-refractory iron deficiency anemia (i.e., iron deficiency that is resistant to oral iron therapy) (Lynch et al., 2018). Anemia is the most common symptom of iron deficiency. In the past, angular stomatitis, glossitis, sideropenic dysphagia, and koilonychia (spoon nails) were also considered physical manifestations of iron deficiency, although rarely observed today.Consequences | |
---|---|
Pregnancy | Increased risk of anemia and maternal morbidity Increased risk of prematurity and lower birth weight Higher infant mortality |
Infants and young children | Motor and cognitive developmental delays in infancy Effects on emotional maturation Poorer academic achievement in school-age children who were iron deficient in early childhood Increased risk of severe morbidity from malaria in children < 5y Increased prevalence and duration of upper respiratory tract infections in children |
All ages | Impaired physical performance and earning capacity Suboptimal response to iodine in populations with endemic goiter and increased risk of impaired thyroid function in the presence of iodine deficiency Increased risk of chronic lead poisoning in high-lead environments Increased risk of “restless leg syndrome” |
Outcome | IDA OR (95% CI) | Non-IDA OR (95% CI) |
---|---|---|
LBW | 1.17 (0.95‑1.43) | 1.43 (0.82‑2.50) |
SGA | 0.77 (0.68‑0.87) | 1.20 (0.85‑1.70) |
PTB | 1.07 (0.68‑1.70) |
17.1.5 Food sources and dietary intakes
High-iron foods include liver, kidney, mussels, and red meat. Foods with a medium iron content include chicken, processed meat, fish, and legumes (non-heme iron only). Milk and milk products and many fruits and vegetables are poor sources of dietary iron (USDA, 2019). Flesh foods are especially important because of their high content of bioavailable heme iron, and their enhancing effect on nonheme iron absorption (Hallberg and Rossander, 1984). Ground water may also be an important source of iron in some countries. Studies have found positive associations between consumption of ground water with a high iron content and biomarkers of iron status and Hb in Bangladesh (Merrill et al., 2011; Rahman et al., 2016). In many industrialized countries, cereal products fortified or enriched with iron, provide the most dietary iron, followed by meat, poultry, and fish, and then vegetables and fruits (Gregory et al., 1990; McLennan and Podger, 1998; Russell et al., 1999). As an example, based on data from nine European countries, cereal products contributed more than 20% and up to 49% of the iron intake in all population groups except infants (EFSA, 2015). In the U.S. NHANES III survey (2003‑2006), about 40% of the iron in the diets of individuals > 2y was contributed by foods fortified or enriched with iron (Fulgoni et al., 2011). Data on iron intakes are available from several nationally representative surveys. In the U.S. NHANES III survey (1988‑1994), the median usual intakes of iron for adult women and men were 12mg/d, and 16‑18mg/d, respectively (IOM, 2001). For adult Europeans (> 18y), average intakes ranged between 9.4 and 17.9mg/d (EFSA, 2015). In general, average iron intakes of males tend to be slightly higher than females because males generally consume larger quantities of food each day (EFSA, 2015). The bioavailability of iron from mixed Western-style diets (for individuals with no iron stores) is estimated to range from 14‑18%, provided the diets contain ample quantities of flesh foods and ascorbic acid. In low-income countries, however, dietary iron absorption is often probably only about 5‑12% for individuals with no iron stores because in these plant-based diets the proportion of heme iron is low, while the content of absorption inhibitors is often significant (WHO/FAO, 2005). The rise in the variety of food products fortified with iron has prompted research on the properties of iron fortificants. Factors affecting their choice include absorbability (i.e., the highest relative bioavailability (RBV) compared with ferrous sulfate), absence of unacceptable changes to the sensory properties (i.e., taste, color, texture) of the food vehicle, and the cost of the fortificant. The iron compounds used for fortification or for enrichment can be divided into three categories — water soluble; poorly water soluble but soluble in dilute acid; water insoluble and poorly soluble in dilute acid. Almost all enter the common nonheme iron pool in the gastrointestinal tract and are absorbed like native nonheme iron compounds. The third category, however, — water insoluble and poorly soluble in dilute acid — do not fully enter the common nonheme iron pool, and their absorption is poor. The compounds currently used as iron fortificants in order of frequency of use are : (1) ferrous sulfate; (2) ferrous fumarate; (3) encapsulated ferrous sulfate or encapsulated ferrous fumarate; (4) electrolytic iron (a pure form of iron powder with a small particle size) or ferric pyrophosphate; (5) sodium-iron-ethylene-diamine-tetra-acetic-acid (NaFeEDTA); and (6) iron amino acid chelates, particularly iron-glycinate chelates (Lynch et al., 2018). The newer iron fortificants such as NaFeEDTA and ferrous bisglycinate provide better protection against nonheme iron absorption inhibitors. Sodium iron EDTA is used in China to fortify wheat products, whereas ferrous bisglycinate, although expensive, is especially suited to the fortification of liquid whole milk and dairy products. For a detailed review of iron fortificants, see WHO (2006).17.1.6 Effects of high intakes of iron
Cases of acute iron toxicity have been reported, mainly among children who accidentally ingest medicinal iron supplements (IOM, 2001). More common are adverse gastrointestinal effects including nausea, vomiting and diarrhea following the administration of high doses of iron supplements, especially when they are taken without food (Brock et al., 1985). Excessively high intakes of iron supplements may induce copper deficiency by an adverse effect on copper absorption, although this effect may only occur when copper status is low or marginal (Cohen et al., 1985). High intakes of iron supplements taken without food may reduce zinc absorption (Sandström et al., 1985), but generally not when iron supplements or iron fortificants, such as “sprinkles”, are taken with food (Olivares et al., 2012; Esamai et al., 2014; Davidsson et al., 1995), as noted earlier. In anemic Cambodian women, however, a daily multi-micronutrient supplement containing 60mg of iron consumed with food blunted the increase in serum zinc observed among the women receiving the same supplement without iron; no data on zinc absorption were collected (Holmes et al., 2019). Possible toxic effects of rising iron stores over time have been implicated in the pathogenesis of several common diseases of aging. However, evidence for a causal relationship in the general population between the level of dietary iron intake or body iron content and risk for cancer (Turner and Lloyd, 2017) and coronary heart disease (Hunnicutt and Xun, 2014) remains inconclusive. Moreover, there is no evidence that dietary iron is associated with arthritis, diabetes mellitus, or neurodegenerative disease (EFSA, 2015). Certain genetic mutations can cause iron overload. One of the most well-known examples is hereditary hemochromatosis arising from a mutation in HFE gene that results in a reduced or negligible expression of hepcidin. This results in an inability to limit absorption of dietary iron, so iron accumulates in many organs. Hemochromatosis is relatively common in Northern European populations (Beutler et al., 2002); heterozygotes for the mutation associated with hemochromatosis, however, do not appear to be at an increased risk of iron overload. Iron overload has also been associated with other genetic defects such as atransferrinemia, aceruloplasminemia, and Friedreich ataxia. African iron overload, previously termed “Bantu cirrhosis”, is also thought to have a genetic component in addition to the excessive intakes of iron from food and beer prepared in iron utensils (EFSA, 2015). Iron overload may also result from the multiple blood transfusions used to treat certain inherited disorders such as iron-loading anemia (e.g., β‑thalassemia). In most iron overload syndromes, iron is sequestered in ferritin and hemosiderin in all tissues throughout the body. Concern has been raised that supplementation of iron given in non-physiological amounts can increase the risk of bacterial and protozoal infections (see “malaria” in Section 17.11.1 for more details). As approximately 40% of the population in the world is exposed to malaria and it is endemic in over 100 countries, resolving this concern is essential. Neuberger et al. (2016) reviewed the available evidence based on a meta-analysis of 35 randomized controlled trials (31,955 children). They concluded that oral iron supplementation does not increase the risk of clinical malaria provided regular malaria prevention or management services are provided. Therefore, in resource-poor settings, routine iron supplementation can be given to children without screening for anemia or for iron deficiency provided regular malaria surveillance and treatment services are provided. However, such services for malaria are not always available in low-income countries. For a review of the safety and benefits of iron supplements for pregnant women in low-income countries, consult Mwangi et al. (2017). Recommendations by the World Health Organization (WHO) on the prevention and control of iron deficiency in infants and young children in malaria-endemic areas are available (WHO, 2007). Instead of using iron supplements, a safer strategy for improving iron status may be the use of lower quantities of iron provided within a food matrix (i.e., fortified food); see Prentice et al. (2017) for more details. The U.S. Food and Nutrition Board has set the Tolerable Upper Intake Level (UL) based on the gastrointestinal side effects associated with high levels of iron consumed on an empty stomach. The UL for iron for adults, including pregnant and lactating women ≥ 19y is 45mg/d, whereas the level for infants and children 1‑18y is 40mg/d (IOM, 2001). No UL has been set for iron by the European Food Safety Authority — EFSA (2006; 2015) or by WHO/FAO (2005).17.1.7 Biomarkers of exposure
To estimate exposure to the intake of dietary iron, conventional dietary assessment methods must be used. The method selected depends on several factors, including the study objective, the setting, and available resources; for more details, see Chapter 3. Estimates of habitual usual iron intakes are needed in view of the length of time required by iron status biomarkers to reach a steady state in response to changes in dietary intakes. Usual iron intakes are also essential to estimate the prevalence of inadequate intakes for population groups and for the investigation of associations between dietary intakes and health outcomes. Details of the statistical adjustments for converting observed iron intakes to usual iron intakes can also be found in Chapter 3. Alternatively, for large-scale population studies, a food frequency questionnaire (FFQ) that is designed to assess intakes of iron-rich foods and iron-absorption modifiers over a longer time period may be used, provided the FFQ has been validated for the study setting (see Chapter 3, Section 3.1.6). As noted earlier, inadequate intakes of poorly available dietary iron are a major concern in the plant-based diets of many low-income countries. Bioavailability is defined as the extent to which the iron is absorbed from the diet and used for normal bodily functions (Lynch et al., 2018). Several algorithms have been developed to predict the bioavailability of iron based on dietary data that include the form of the iron (i.e., heme or nonheme) and the content of known absorption modifiers in a meal. Of the algorithms available, the model of Hallberg and Hulthén (2000) is the most detailed, taking into account the effects of all known modifiers of nonheme iron absorption as well as interactions, with adjustments for the iron status of the individual. However, as with all the other algorithms developed, the model of Hallberg and Hulthén only predicts nonheme iron absorption so assumptions about the intake and absorption of heme iron must be made. Furthermore, the model is difficult to apply, in part because of incomplete food composition data for the absorption modifiers. Indeed, all algorithms have limitations and often underestimate bioavailability, with a 3-fold variation in estimates when using different algorithms (Beard et al., 2007). In view of the limitations of the algorithms to estimate iron bioavailability, FAO/WHO (2002) have developed a qualitative approach to estimate iron absorption based on data on iron absorption from typical meals in Asia, India, Latin America, and Western countries. Applying the FAO/WHO approach, diets can be categorized as having a low, intermediate, or high bioavailability based on the major food sources of iron, as shown in Box 17.1. The estimates of absorption given in Box 17.1 refer to nonanemic persons with normal iron transport (i.e., with normal Hb) with no iron stores. When individuals have iron deficiency anemia, absorption may be increased by 50% (i.e., increasing to percentages of 7.5, 15, and 22.5, respectively, for the low-, intermediate-, and high-bioavailability diets). Note that for Western-type diets, FAO and WHO now propose two categories of bioavailability — 12% and 15% — depending on the meat content of the diet; see Gibson and Ferguson (2008) for further details.
Box 17.1. Using the FAO/WHO qualitative approach to
estimate iron bioavailability
Uses the data on major food sources to estimate iron bioavailability
Recently a new approach to calculate dietary iron
bioavailability has been developed using a probability
model. The approach is based on calculated iron
requirements, data on daily total iron intake, and the
distribution of serum ferritin values in the population
sample; total iron absorption at any level of
iron status can be estimated
(Dainty et al., 2014).
Unlike
the earlier algorithms, this new approach does not require
data on iron absorption modifiers or the heme content of
the diets.
Using the approach described above, data from a
representative group of adults from the U.K.
National Diet and Nutrition Survey were used to estimate
total iron absorption from a mixed Western style diet,
using a target serum ferritin concentration of 30µg/L for
iron storage status. At this level, estimates for the
predicted iron absorption for men and premenopausal
women were 16% and 18%, respectively
(EFSA, 2015).
Note an interactive tool is available
(Fairweather-Tait et al., 2017)
that could be adapted for use in populations
consuming habitual plant-based diets with low-iron
bioavailability, provided the appropriate correction for the
impact of inflammation on serum ferritin concentrations is
performed, when necessary (see “Acute and
chronic inflammation” in
Section 17.7.1 for more details).
Nevertheless, because both the iron requirements and
dietary iron must be in a steady state for at least a year
when applying this approach, it is not suitable for certain
groups such as children, pregnant women, or immediately
after the onset of menopause.
Uses the data on major food sources to estimate iron bioavailability
- Low-bioavailability diet (iron absorption of about 5%): a simple, monotonous diet containing cereals, roots, and/or tubers, and negligible quantities of meat, fish, or ascorbic acid-rich foods;
- Intermediate-bioavailability diet (iron absorption of about 10 percent): consists mainly of cereals, roots, and/or tubers, and minimal quantities of food of animal origin and ascorbic acid, both of which promote iron availability;
- High-bioavailability diet (iron absorption of about 12 or 15%): a diversified diet containing generous quantities of meat, poultry, fish and/or foods containing high amounts of ascorbic acid.
17.1.8 Interpretation of iron intakes
The final stage of the assessment of exposure to the intake of iron is to evaluate the usual intakes of the population or an individual in relation to the nutrient reference values (NRVs); see Chapter 8a for details of the derivation of the NRVs. To estimate the physiological requirements for iron, the factorial approach, based on estimates of the quantity of absorbed iron needed to replace iron losses, is used by most expert groups, including WHO/FAO (2005), IOM (2001), and EFSA (2015). Next, adjustments are made to the estimates of physiological requirements to yield a dietary iron requirement (i.e., Average Requirement; AR) by taking into account the bioavailability of iron in the habitual diet. The chosen bioavailability factors (see Chapter 8a, Section 8a.8 for more details) are partly responsible for differences in the dietary iron requirements (i.e., ARs) across countries. Therefore, care must be taken to ensure that the dietary iron requirements chosen for the evaluation of iron intakes are appropriate for the habitual diet of the population under study. Some expert groups (e.g., IOM, 2001; EFSA, 2015) apply a fixed bioavailability factor for iron to estimate the dietary requirement (AR), even though the efficiency of absorption may vary with life-stage and health status. Others, including WHO/FAO (2005), do not present average dietary requirements (ARs) for iron, instead providing only estimates of Recommended Intakes (RIs) from which the ARs for dietary iron can be derived. These calculated AR values are available in WHO (2006) and are the values that should be used to evaluate the prevalence of inadequate intakes of population groups in a low-income setting. In the higher-income countries, however, the AR values set by IOM (2001) or EFSA (2015) may be appropriate. The full-probability approach must be applied to estimate the prevalence of inadequate intake for iron for certain population subgroups, notably children (1‑8y), menstruating adolescents (14‑18y) and adult women, because their iron requirements are not symmetrical about the AR. For the details of the application of the full probability approach both manually and using appropriate software, see Chapter 8b. For the manual calculation, the reader is also advised to consult Gibson and Ferguson (2008). To estimate iron bioavailability in the diet of an individual, the qualitative model of FAO/WHO (2002) (Box 17.1.) that takes into account the major food sources of iron and the presence of potential absorption modifiers can be used. Alternatively, bioavailability can be calculated from an appropriate iron algorithm. Inferences can then be made about the adequacy of the iron intake of the individual by comparing the difference between the estimate of the usual iron intake and the corresponding selected values for the AR and RI, taking the assumed bioavailability into account. For details on the guidelines for the qualitative interpretation of individual iron intakes, see Chapter 8b.17.1.9 Introduction: biochemical biomarkers of iron status
In the past, iron deficiency has been assumed to cause 50% of all cases of anemia worldwide. The proportion is now thought to be much lower. In a systematic review, Petry et al. (2016) estimated that only 25% of the anemia in pre-school children, and 39% in non-pregnant women of reproductive age, is attributable to iron deficiency. In their review, unlike in many earlier studies, the probable exposure of a country to infection and chronic inflammatory conditions was taken into account. Their findings highlighted the challenge of distinguishing between anemia due to iron deficiency and that due to inflammation (i.e., anemia of chronic disease). This is a concern in low-income countries and in the elderly who are also at high risk for inflammation (see “Acute and chronic inflammation” in Section 17.7.1 for more details). The gold standard test for the diagnosis of iron deficiency anemia is a stained bone marrow aspirate or biopsy. This provides a semi-quantitative estimate of the size of the body iron store. However, this test is invasive and costly, and requires an experienced person to evaluate the stained specimen, and so is not commonly used (Lynch et al., 2018). Instead, several hematological parameters are used to diagnose anemia, along with serum-based iron biomarkers and biomarkers of inflammation to identify iron deficiency or iron deficiency anemia; these are discussed in detail in the following sections. For a summary table of each of these measures, and their advantages and limitations, the reader is referred to Lynch et al. (2018). Three stages in the development of iron deficiency anemia can be recognized and are best characterized by the use of multiple biomarkers (Section 17.10). The three stages are the following: Iron depletion, the first stage, is characterized by a progressive reduction in the amount of storage iron in the liver. At this stage, the supply of iron to the functional compartment is not compromised so levels of transport iron and hemoglobin are normal. However, the progressive depletion of iron stores will be reflected by a fall in serum ferritin concentrations. Iron-deficient erythropoiesis, the second stage, is characterized by the exhaustion of iron stores and is also referred to as “iron deficiency without anemia”. At this stage the iron supply to the erythropoietic cells is progressively reduced and decreases in transferrin saturation occur (Section 17.6). At the same time, there are increases in serum transferrin receptor (Section 17.9) and erythrocyte protoporphyrin concentrations (Section 17.8). Hemoglobin levels may decline slightly at this stage, although they usually remain within the normal range. Iron-deficiency anemia, the third and final stage of iron deficiency, is characterized by the exhaustion of iron stores, declining levels of circulating iron, and presence of frank microcytic, hypochromic anemia (i.e., red blood cells are small and contain less Hb than normal). The main feature of this stage is a reduction in Hb (Section 17.2), arising from the restriction of iron supply to the bone marrow. Decreases in the hematocrit (Section 17.3) and red-cell indices also occur (Section 17.4). Examination of a stained blood film allows confirmation of the presence of hypochromia (a lower Hb than normal) and microcytosis (abnormally small red-blood cells).17.2 Hemoglobin
Iron is an essential component of the Hb molecule, the oxygen-carrying pigment of red blood cells. Each Hb molecule is a conjugate of a protein (globin) and four molecules of heme, as noted earlier. Anemia develops when circulating red blood cells are insufficient to meet physiological oxygen-carrying needs, and is identified by a Hb concentration below a defined cutoff-value. Measurement of the Hb concentration in whole blood is probably the most widely used test for iron-deficiency anemia, even though only a subset of anemic individuals in a population will have iron deficiency anemia. Anemia may also be due to malaria, infection, hemoglobinopathies, or deficiency of several other micronutrients besides iron.Reference | Hemo- globin | Serum ferritin | Serum iron |
---|---|---|---|
Dawkins et al. (1979) | — | 15 (M, F) | — |
Gallagher et al. (1989) | 1.6 (F) | 15 (F) | — |
Statland and Winkel (1977) | — | — | 29 (F) |
Statland et al. (1976) | — | — | 27 (F) |
Statland et al. (1978) | 3 (M, F) | — | — |
Pilon et al. (1981) | — | 15 (M, F) | 29 (M, F) |
Romslo and Talstad (1988) | — | 13 (M, F) | 33 (M, F) |
Borel et al. (1991) | 4 (M, F) | 14 (M) | 27 (M) |
Borel et al. (1991) | 4 (F) | 26 (F) | 28 (F) |
17.2.1 Factors affecting Hb concentrations
Daily biological variation in Hb concentrations is significant (Van Wyck et al., 2011; Sennels et al., 2011). Hemoglobin values tend to be lower in the evening than in the morning, by amounts of up to 10g/L. Within-subject day-to-day variation is low (CV≈3%) (Table 17.4). Age is an important determinant, particularly for infants and children. Hemoglobin concentrations are higher (130‑180g/L) at birth (Lorenz et al., 2013) than any other time in life, reflecting fetal adaption to the oxygen- deficient environment of the uterus. After birth, Hb concentrations fall, reaching their lowest point at about 2mos This fall is probably due to the sudden decrease in erythropoiesis arising from the increase in oxygen delivery to the tissues (Zierk et al., 2015). (Figure 17.2). Thereafter, Hb concentrations gradually rise (Domellöf et al., 2002a), with a marked increase at puberty in males as a result of accelerated growth (Figure 17.2). The arrow shows the point when 50% of the population reach Tanner stage PH2 (i.e., the appearance of pubic hair), emphasizing the sex-dependent changes after puberty (Zierk et al., 2015). Around the fifth decade of life, Hb levels decline. Several factors have been implicated in this decline, including the development of anemia of chronic disease with aging. Sex differences in Hb are apparent at 6mos, with boys having slightly lower Hb concentrations than girls. Such discrepancies appear to be greater in infants with a birth weight < 3500g (Domellöf et al., 2002). By the second decade of life, however, females have values that change very little after 12y (Table 17.5). In young adults, the Hb concentration for men is on average about 20g/L higher than for women, due to testosterone which results in both a larger body size and larger erythrocyte mass. For women, the trend for lower Hb values is due to chronic menstrual blood loss. These sex-related differences, although diminishing gradually with increasing age, remain (Table 17.5).Age (y) | Females | Males |
---|---|---|
1‑2 | 122.0 (7.34) | |
3‑5 | 124.4 (7.57) | |
6‑11 | 130.9 (7.92) | |
12‑15 | 134.3 (9.27) | 142.4 (10.0) |
16‑19 | 133.7 (8.21) | 152.9 (10.03) |
20‑49 | 134.8 (9.12) | 153.0 (9.68) |
50‑69 | 136.5 (9.82) | 150.1 (10.64) |
≥ 70 | 135.6 (10.68) | 145.3 (12.87) |
Altitude (metres above sea level) | Measured Hb adjustment (g/L) |
---|---|
< 1000 | 0 |
1000 | − 2 |
1500 | − 5 |
2000 | − 8 |
2500 | − 13 |
3000 | − 19 |
3500 | − 27 |
4000 | − 35 |
4500 | − 45 |
Smoking status | adjustment (g/L) |
Non-smoker | 0 |
Smoker (all) | −3 |
0.5‑1 packet/d | −3 |
1‑2 packets/d | −5 |
≥ 2 packets/d | −7 |
17.2.2 Interpretive criteria — use of the distribution of hemoglobin reference values
At the population level, Hb concentrations can be evaluated by comparison with a distribution of Hb reference values using percentiles. The reference values are obtained from a cross-sectional analysis of a reference sample group, which in most cases consists of an apparently “healthy” population sampled during a nationally representative survey and assumed to be disease-free. Consequently, some of the participants in the sample will have Hb concentrations lower than normal because they are affected by some of the factors, discussed above, known to influence Hb concentrations. Nevertheless, such reference distributions are often used as a standard for comparison with the Hb distribution measured in a study population. Examples of the reference distributions of Hb concentrations compiled in this way are shown below:- U.S. Tables of mean, SEM, selected percentiles (5th, 10th, 25th, 50th, 75th, 90th, 95th ) for Hb (g/L) by age and sex for persons randomly selected to participate in the U.S. NHANES III (1988‑1994) population. See Appendix 17.1 (IOM, 2001). Children fed human milk and pregnant and lactating women were excluded, but not potentially iron deficient individuals.
- Results from two of the earlier U.K. Diet and Nutrition Surveys (Gregory et al., 1990; Gregory et al., 2000; present the mean, median, and lower and upper 2.5 or 5th percentiles for Hb for adults and older children respectively. Information dealing with UK National Survey years 9‑11 (2016‑2017 and 2018‑2019) includes methodological details. A condensed (“zipped”) comprehensive set of data tables based on information from the U.K. National Survey (years 1‑9) includes more recent data on Hb.
- U.S. Tables of mean, SEM, selected percentiles (5th, 10th, 25th, 50th, 75th, 90th, 95th ) for Hb (g/L) by age and sex (but not race) for a “healthy” reference sample based on data from the U.S. NHANES III 1988‑1991 survey in which those with a higher risk of iron deficiency and pregnant women were excluded. Exclusion criteria were based on an abnormal value or missing value for 3 of the 4 tests (free erythrocyte protoporphyrin, transferrin saturation, serum ferritin, and mean cell volume (MCV)) (Looker et al., 1997).
- U.S. Tables of mean, SEM, selected percentiles (2.5th, 5th, 50th, 80th, 95th, 97.5th for Hb (g/L) for a “healthy” reference sample from U.S. NHANES III by sex for nine age groups ranging from 10y‑75+y for three major racial categories (Mexican Americans, non-Hispanic black, and non-Hispanic white). Several exclusion criteria were applied; see Cheng et al. (2004) for further details and additional plots. The same team of investigators have also compiled reference distributions for Hb (g/L) by waist circumference according to sex and the same three major U.S. racial categories for individuals 25‑55y based on U.S. NHANES III data from 2005‑2010 (Vuong et al., 2014).
- International Tables of mean, median, gestational age-specific smoothed percentiles (3rd, 10th, 50th, 90th, 95th, 97th ) for maternal Hb (g/L) for a “healthy” reference sample of pregnant women who received optimal antenatal care (Ohuma et al., 2020). The actual values for the percentiles for maternal Hb from 14‑40wk gestational age are presented in Appendix 17.2. They are derived from prospective data on healthy, well-nourished women (n=3502) living in eight countries whose healthy babies were followed up to 2y. Equations are also provided to allow calculation of any desired percentiles for maternal Hb according to gestational age in weeks; see Ohuma et al. (2020) for more details. Note when gestational age is unknown, then the median value for Hb (g/L) of the maternal Hb percentiles should be used. These median values are: 98, 101, 104, 118, 131, 133, and 137g/L for the 3rd, 5th, 10th, 50th, 90th, 95th, and 97th percentiles, respectively.
17.2.3 Hemoglobin cutoff values
Individuals in a population can be classified as “at risk” by comparing Hb concentrations with either statistically predetermined reference limits drawn from the reference distribution, or clinically or functionally defined “cutoff values”. For Hb, where a single reference limit has been defined, in most cases this has been set at the 5th percentile of a “healthy” reference distribution or one in which the population sampled are assumed to be disease free, as noted in Section 17.2.2. Technically, a statistically defined reference limit is not a “cutoff value” because it has not been linked with physiological or health outcomes, so these two terms should not be used interchangeably. Nevertheless, invariably, the term “cutoff values” is applied irrespective of the method used to define them. For more details, see Chapter 15: Evaluation of nutritional biomarkers. Table 17.7 compares the Hb “cutoff” values (g/L) set in 1968 by WHO (WHO, 1968) and by Looker et al. (1997) for the United States. The WHO cutoffs were based initially on data from small studies of predominantly Caucasian Europeans and Canadians, whereas the U.S. Hb data were from the NHANES III survey (1988‑1991). In both cases, the cutoffs set are based on the 5th percentile values of the reference distribution, although the latter compiled by Looker et al. (1997) comprised a “healthy” reference sample because those with conditions known to affect Hb concentrations were excluded, as noted in Section 17.2.2. Technically because these “cutoff-values” were statistically derived rather than being linked with physiological or health outcomes, they both should be referred to as “reference limits”, as noted above. Concern has been raised over the appropriateness of these statistically derived reference limits for defining anemia among certain age groups and ethnicities (Johnson-Spear and Yip, 1994; Beutler and Waalen, 2006; Jorgensen et al., 2019). As a result, Addo et al. (2021) have used cross-sectional data from a multinational sample across 27 nutrition surveys from 25 countries to re-examine the appropriateness of using the 5th percentile WHO (1968) Hb cutoffs across countries for preschool children and nonpregnant women. Only data from “healthy” individuals were included, so persons with iron deficiency (ferritin < 12µg/L for children or < 15µg/L for women), vitamin A deficiency (serum retinol-binding protein or retinol < 0.70µmol/L), inflammation (C‑reactive protein (CRP) > 5mg/L or α‑1‑acid glycoprotein (AGP) > 1g/L), or known malaria, were excluded.Hemoglobin cutoff value (g/L) | |||
---|---|---|---|
Age (y) | Males and Females | Males | Females |
NHANES III (from Looker et al., 1997). | |||
1‑2 | < 110 | ‑ | ‑ |
3‑5 | < 112 | ‑ | ‑ |
6‑11 | < 118 | ‑ | ‑ |
12‑15 | ‑ | < 126 | < 119 |
16‑19 | ‑ | < 136 | < 120 |
20‑49 | ‑ | < 137 | < 120 |
50‑69 | ‑ | < 133 | < 120 |
≥ 70 | ‑ | < 124 | < 118 |
INACG / WHO / UNICEF | |||
0.5‑5 | < 110 | ‑ | ‑ |
5‑11 | < 115 | ‑ | ‑ |
12‑13 | < 120 | ‑ | ‑ |
Men | ‑ | < 130 | ‑ |
Pregnant women | ‑ | < 110 | |
Nonpregnant women | ‑ | < 120 |
Anemia — Hemoglobin (g/L) | ||||
---|---|---|---|---|
Population | No anaemia | Mild | Moderate | Severe |
Children, 6‑59mos | ≥ 110 | 100‑109 | 70‑99 | < 70 |
Children, 5‑11y | ≥ 115 | 110‑114 | 80‑109 | < 80 |
Children, 12‑14y | ≥ 120 | 110‑119 | 80‑109 | < 80 |
Non-pregnant women, ≥ 15y | ≥120 | 110‑119 | 80‑109 | < 80 |
Pregnant women | ≥ 110 | 100‑109 | 70‑99 | < 70 |
Men, ≥ 15y | ≥ 130 | 110‑129 | 80‑109 | < 80 |
Trigger levels for the pre- valence of anemia (%) | Category of public health significance |
---|---|
≤ 4.9 | No public health problem |
5.0‑19.9 | Mild public health problem |
20.0‑39.9 | Moderate public health problem |
≥ 40 | Severe public health problem |
Individual women (for clinical use) | |
---|---|
Gestational age- specific cutoff (normative percentile) | Probable diagnosis |
< 3rd percentile | Low Hb concentration |
3rd‑4.99th percentile | At high risk of low Hb concentration |
5th‑9.99th percentile | At moderate risk of low Hb concentration |
≥ 10th percentile | Normal Hb |
17.2.4 Using hemoglobin distribution to assess population iron status
The distribution of Hb can be used in large-scale field studies to assess the iron status of a population (Yip et al., 1996). This simplified approach is designed to assess the prevalence and etiology of anemia, based solely on Hb, and is especially useful when it is not feasible to use multiple biochemical tests for iron status because of cost or operational constraints. It is also useful in developing countries where factors other than inadequate intakes of dietary iron, such as parasitic infections and genetic Hb disorders, often affect red cell production and thus interfere with the interpretation of iron status measures. The Hb distribution approach involves comparing the Hb distribution curves for men, women, and children of the study population, with optimal Hb distributions derived from a “healthy” reference sample. These have been compiled from U.S. NHANES II (Pilch and Senti, 1984) and NHANES III (Looker et al., 1997) populations by excluding subjects with biochemical evidence of iron deficiency, as noted earlier. Figure 17.5 depicts the Hb distributions for the NHANES II reference samples. These distributions can be used as a standard for comparison with the Hb distributions from other surveys. If anemia is prevalent in the target population then the Hb distribution will be shifted to the left relative to the reference. The distribution approach can also indicate when inadequate dietary intake of iron is the main factor causing iron deficiency in a population. If this is the case, then the Hb distributions for children and women are both affected. Both subgroups will have significantly lower median Hb values when compared with their respective reference distributions, whereas the median of the distribution for adult men in the target population is virtually unaffected. For example, comparison of the Hb distributions for school-aged children from Zanzibar with the corresponding U.S. reference sample for African Americans shows a marked shift of Hb concentrations (Figure 17.6). In Zanzibar, the decreased Hb levels were related to gastrointestinal blood loss as a result of hookworm infection rather than inadequate dietary iron intake.17.2.5: Measurement of hemoglobin
Hemoglobin can be determined in fasted or non-fasted blood samples and is best determined using venous blood, anticoagulated with EDTA. Alternatively, capillary blood from the heel, ear, or fingerpricks, collected in heparinized capillary tubes can be used, although less precise compared to measurements on venous blood. This is primarily because interstitial fluid may dilute capillary samples (Burger and Pierre-Louis, 2003). The cyanmethemoglobin method, recommended by the International Committee for Standardization in Hematology (ICSH, 1987), is the most reliable, provided that the blood specimen has been accurately diluted. Incorrect dilution of the sample is one of the main sources of error in this method (Pilch and Senti, 1984). The method involves converting all of the usually encountered forms of Hb (oxyhemoglobin, methemoglobin, and carboxyhemoglobin) to cyanmet-hemoglobin. The analysis is then normally performed with a spectrophotometer. The reagents for this method are light-sensitive and poisonous. The coefficients of both analytical and biological variation for Hb by the cyanmethemoglobin method using venous blood are often less than 4% (Worwood, 1996). A WHO international standard is available to assess the accuracy of the assay (ICSH, 1987). Hemoglobin can also be determined in this way from blood spots collected in the field on filter paper discs; levels remain unchanged during storage for 1mo (Feraudi and Mejia, 1987). Alternatively, Hb is best measured using a Coulter Counter using EDTA-anticoagulated blood. Most automated cell counter analyzers use the cyanmethemoglobin method. A portable hemoglobin photometer can be used for population assessment in remote field settings. The “HemoCue” is battery operated and uses a dry reagent (sodium azide) in a microcuvette for direct blood collection and measurement. In a new model (Hb-301), cuvettes can be stored at an extended temperature range (10‑40°C) compared to earlier models (15‑30°C) and the use of a control cuvette is no longer necessary. The accuracy and precision of Hb values based on the HemoCue are comparable to those obtained using the cyanmethemoglobin method, provided standardized procedures for the sample collection and analysis are followed (von Schenck et al., 1986). Details of standardization procedures to enhance the accuracy and reliability of Hb concentrations measured by the HemoCue are given in Burger and Pierre-Louis (2003) or in the U.S. CDC Nutrition Survey Toolkit.17.3 Hematocrit or packed cell volume
The hematocrit is defined as volume percentage or volume fraction of packed red blood cells (RBC) in blood, sometimes termed the “packed cell volume” (PCV). Variation with age and sex is shown in Figure 17.7, with higher concentrations in males than in females after puberty, as observed for Hb concentration (Zierk et al., 2011). As described for Hb, hematocrit concentrations decline steadily during pregnancy as a result of a greater increase in plasma volume relative to the increase in red blood cell mass, reaching a nadir at about 28‑36wks in women not taking iron supplements. However, the hematocrit is only useful if Hb values are not available. In iron deficiency, the hematocrit falls after Hb formation has become impaired. As a result, in early cases of moderate iron deficiency, a marginally low Hb value may be associated with a nearly normal hematocrit (Graitcer et al., 1981). Only in more severe iron-deficiency anemia are both Hb and hematocrit reduced. Limitations of the hematocrit determination are shown in Box 17.2.
Box 17.2: Limitations of the hematocrit determination
Hematocrit, like Hb, is usually determined on
EDTA‑anticoagulated blood from a venipuncture or
capillary blood. The measurement is relatively easy, rapid,
and often used in screening for iron-deficiency anemia,
although the technical errors for the measurement of
hematocrit are greater than for Hb.
Measurement errors may result from:
- Poor sensitivity as hematocrit falls only in the third stage of iron deficiency
- Poor specificity, as hematocrit is affected by the same factors that influence Hb
- Poor precision, particularly when capillary blood samples are used
- Values are age- and sex-dependent (Figure 17.7), with similar trends to those described for Hb.
- Poorly packed iron-deficient cells, resulting in spuriously elevated values
- Improper mixing of blood caused by intermittent blood flow from the puncture site
- Excessive anticoagulant in the collection tube (e.g., if collection tube is not filled with blood)
- Dilution of blood by an alcohol solution because the finger was not dried before it was punctured
- Elevated white blood cell counts, leading to a poorly defined boundary between erythrocytes and plasma in the hematocrit tube.
17.3.1 Interpretive criteria
Age (y) or group | Hematocrit cutoff (volume fraction) |
---|---|
0.5‑5 | < 0.33 |
5‑11 | < 0.34 |
12‑13 | < 0.36 |
Men | < 0.39 |
Nonpregnant women | < 0.36 |
Pregnant women | < 0.33 |
17.3.2 Measurement of hematocrit
Hematocrit can be measured manually by centrifuging a small amount of blood in a heparinized capillary tube until the red cells have been reduced to a constant packed cell volume. The hematocrit is calculated by comparing the height of the column of packed red cells with the height of the entire column of red cells and plasma, and expressed as the volume percentage or volume fraction of packed red blood cells. However, values measured in this way frequently have poor reproducibility, especially when the power supply is unstable and the equipment not well standardized (WHO, 2007). Alternatively, hematocrit can be derived using automated electronic cell counters. These measure mean cell volume (MCV) and the number of red blood cells from which hematocrit is calculated as MCV × RBC concentration. Hematocrit values generated in this way tend to be about 1% higher than those generated manually (Looker et al., 1995).17.4 Red-cell indices
Red-cell indices are derived from measurements of Hb, hematocrit, and red-blood cell count. They can indicate cell size and the concentration of Hb within the cell allowing different types of anemia to be diagnosed. Fresh samples of whole anticoagulated blood are required. The accuracy, precision, and use of red-cell indices have increased with the growing availability of automated electronic cell-counting instruments. Red-cell indices lack specificity. If subnormal values are noted in the absence of thalassemia trait, anemia of chronic disease, and other known causal conditions, additional measures of iron status are recommended to confirm the diagnosis of iron deficiency. The confirmatory tests commonly used are serum iron and total iron-binding capacity, serum ferritin, erythrocyte protoporphyrin, and more recently, soluble transferrin receptor (sTfR). These tests are discussed in Sections 17.6 to 17.9. Table 17.12
Red cell index | Iron-deficiency anemia (microcytic hypochromic) |
Macrocytic anemia (macrocytic) | Anemia of chronic disease (normocytic normochromic) |
---|---|---|---|
MCV | Low | High | Normal |
MCH | Low | High | Normal |
MCHC | Low | Normal | Normal |
17.4.1 Mean cell volume
Mean cell volume or mean corpuscular volume (MCV) is a measure of the average size of the red blood cells expressed in femtoliters (fL). Cells may be abnormally large (macrocytosis), as in vitamin B12 or folic acid deficiency, or abnormally small (microcytosis), as in iron and vitamin B6 deficiency. Mean cell volume is best determined directly with a Coulter Counter as results obtained in this way are highly reproducible. Reported within-subject biological variation for MCV is low, varying between 0.6 and 1.3% (Buttarello, 2016). If a Coulter Counter is not available, MCV can be calculated from the hematocrit and the red blood cell count determined manually (Wintrobe et al., 1981): \[\small \mbox{MCV (fL) = }\frac{\mbox{hematocrit (volume fraction})}{ \mbox{ red blood cell count }(10^{12}/\mbox{L})}\] Mean cell volume is less affected by sampling errors in skin puncture capillary blood samples than Hb, because red-cell size is unaffected if the sample is diluted by the interstitial fluid. A low MCV value only occurs when iron deficiency is severe. It is a relatively specific index for iron-deficiency anemia, provided that the anemia of chronic disease, certain genetic Hb disorders (α‑ and β‑thalassemias including heterozygotes), and lead poisoning are excluded. In macrocytic anemias associated with vitamin B12 or folate deficiency, MCV values are high (Table 17.12). In pregnancy, MCV decreases slightly between 26 and 38wks gestation, likely attributed to the transfer of placental iron being most intense at this time, thus decreasing the iron availability for maternal erythropoiesis (Fisher and Nemeth, 2017). Spuriously high values for MCV may be apparent as a consequence of hyperglycemia or hypernatremia (high level of sodium in the blood). The MCV increases progressively from 6mos to early adulthood (Yip et al., 1984). Differences according to sex are small; MCV is slightly higher in young adult females than in males. Individuals of African descent have lower MCV values than do Caucasians. Such differences are said to have a genetic basis, as noted for Hb under "Ethnicity" (Section 17.2.1). Percentile distributions for MCV levels by race, sex, and age, for all persons 1‑74y in the U.S. NHANES II population, are available, and for the U.S. NHANES II “healthy” reference population for all races as described for Hb in Section 17.2.2 (Pilch and Senti, 1984). Pregnant women and those with a higher risk of iron deficiency based on an abnormal value or missing value for 3 of the 4 tests (free erythrocyte protoporphrin, transferrin saturation, serum ferritin, and MCV) were excluded. Cheng et al. (2004) report reference interval diagrams (2.5th, 50th, and 97.5th percentiles) based on the U.S. NHANES III database stratified by nine age groupings, sex, and race (i.e., Mexican American, Non-Hispanic Black, and Non-Hispanic White). Stringent exclusion criteria were applied to generate a “healthy” reference sample population (10‑75y); details are available in Cheng et al. (2004). Age and sex-specific data for MCV are also available for the older U.K. Diet and Nutrition surveys. Gregory et al., 1990; Gregory et al., 2000 present the mean, median, and lower and upper 2.5 or 5thnbsp;percentiles for MCV for adults and older children respectively. Potentially iron-deficient individuals were not specifically excluded. Information dealing with U.K. National Survey years 9‑11 (2016‑2017 and 2018‑2019) includes methodological details. A condensed (“zipped”) comprehensive set of data tables based on information from the U.K. National Survey (years 1-9) includes more recent data on Hb and ferritin, but not MCV.Abnormal values | |||
---|---|---|---|
Age | Mean cell volume (fL) | Transferrin saturation (%) | Serum ferritin (µg/L) |
1‑2y | < 74 | < 10 | < 10 |
3‑4y | < 76 | < 12 | < 10 |
5y | < 77 | < 12 | < 10 |
15‑49y | < 81 | < 15 | < 12 |
17.4.2 Mean cell hemoglobin
Mean cell hemoglobin (MCH) is the mean Hb content of individual red blood cells, and provides information that is comparable to that of MCV. It is derived from the ratio of Hb to the red blood cell count:\[\small \mbox{MCH (pg) = }\frac{\mbox{hemoglobin (g/L})}{ \mbox{ red blood cell count }(10^{12}/\mbox{L})}\] Percentile distributions by age and sex for MCH are available for the older U.K. Diet and Nutrition surveys. Gregory et al., 1990; Gregory et al., 2000 present the mean, median, and lower and upper 2.5 or 5th percentiles for MCH for adults and older children respectively. Potentially iron-deficient individuals were not specifically excluded. Information dealing with U.K. National Survey years 9‑11 (2016‑2017 and 2018‑2019) includes methodological details. A condensed (“zipped”) comprehensive set of data tables based on information from the U.K. National Survey (years 1-9) includes more recent data on Hb and ferritin, but not MCH. In contrast, stringent precautions were applied by Cheng and co-workers (2004) to generate a health-associated sample population based on the U.S. NHANES III survey from which composite reference intervals for MCH according to age and race, classified by sex were obtained; race-related trends in MCH were apparent. The MCH changed progressively from infancy to adulthood, when values ranged from 27‑32pg. The MCH changes in iron-deficiency anemia are similar to those for MCV; MCH is low in iron-deficiency anemia but high in the macrocytic anemias of both vitamin B12 and folate deficiency (Table 17.12). In the latter, the red blood cells are laden with Hb but are reduced in number. In severe iron deficiency, the relative fall in MCH is greater than the corresponding fall in MCV (Dallman, 1977).
17.4.3 Mean cell hemoglobin concentration
If both the Hb concentration and the hematocrit are known, the concentration of Hb in the red blood cells can be determined. This is known as the mean cell hemoglobin concentration (MCHC) and is calculated as: \[\small \mbox {MCHC (g/L)} = \frac {\mbox {hemoglobin (g/L)} }{\mbox {hematocrit (vol. fraction) }}\] The MCHC is normally determined with a Coulter Counter, although manual determinations are possible. After the first few months of life, MCHC is less affected by age than any other red-cell index (Matoth et al., 1971). Nevertheless, this index is the least useful of the red-cell indices because it is the last to fall during iron deficiency. Percentile distributions by age and sex for MCHC are available for the older U.K. Diet and Nutrition surveys. Gregory et al., 1990; Gregory et al., 2000 present the mean, median, and lower and upper 2.5 or 5th percentiles for MCHC for adults and older children respectively. Potentially iron-deficient individuals were not specifically excluded. Information dealing with U.K. National Survey years 9‑11 (2016‑2017 and 2018‑2019) includes methodological details. A condensed (“zipped”) comprehensive set of data tables based on information from the U.K. National Survey (years 1-9) includes more recent data on Hb and ferritin, but not MCHC. In the U.S. NHANES III sample of Cheng et al. (2004), stringent exclusion criteria allowed reference intervals for MCHC based on a “healthy” reference sample to be generated. Mean cell hemoglobin concentrations are low in iron-deficiency anemia but normal in the macrocytic anemia of vitamin B12 and folic acid deficiency, and in the anemia of chronic disease (Table 17.12). Values in normal adults range from 320‑360g/L. Values of < 300g/L indicate hypochromia and are associated with advanced iron deficiency.17.5 Red-cell distribution width
RDW is a measure of the variation in red-cell size (i.e., anisocytosis). It is normally expressed as the percentage coefficient of variation of the mean cell volume: \[\small \mbox {RDW (%)} = \frac{\mbox {SD of MCV (fL) × 100%}}{\mbox {MCV(fL)}}\] The RDW can be determined routinely as part of a complete blood count on many Coulter Counters. Some counters output only the standard deviation as the measure of RDW. RDW increases in iron-deficiency anemia and was included as a marker of iron status in the U.S. NHANES III survey (Looker et al., 1995), when a single cutoff for RDW of 14% was used. Based on their results on adults and children, Looker et al. (1995), however, suggested that different cutoffs are needed for children and adults. In the neonate, RDW is elevated because the relatively larger red blood cells containing fetal Hb are replaced by smaller cells containing Hb A (Lynch et al., 2018). In the early 1980's Bessman et al. (1983) classified anemic disorders based on a combination of a low, normal, and high MCV and two categories of RDW — normal (< 15.1%) and high (indicating anisocytosis). However, in view of the numerous reported exceptions to this classification, together with differences in the reference intervals for the RDW depending on the analyzer manufacturer, this classification is seldom used today (Buttarello, 2016). Clearly, a high RDW is not specific for iron deficiency. High values also occur in folate or vitamin B12 deficiency and when iron and folate, or iron and vitamin B12 deficiencies coexist. Also, in some genetic Hb disorders (e.g. in S β‑thalassemia, sickle cell disease (SS), and sickle cell trait (SC), RDW is elevated, whereas in the anemia of chronic disease, RDW is normal. The interpretation of RDW is further complicated by the wide distribution of RDW values within a specific disease, and the discrepancy in cutoffs using Coulter Counters from different manufacturers (Buttarello, 2016). Percentile distributions for RDW are available based on the U.K. and New Zealand national surveys. In the U.K. mean, median, and lower and upper 2.5 percentiles by age and sex are presented (Gregory et al., 1990; Gregory et al., 2000), whereas in the New Zealand Children's Nutrition Survey, data on RDW by age, sex, race or ethnicity, and the prevalence of elevated values (defined as >14%) were compiled (Parnell et al., 2003). Cheng et al. (2004) have compiled reference interval plots (2.5th, 50th, and 97.5th percentiles) based on data from a “healthy” reference sample of the U.S. NHANES III data. These data for persons 10‑75y were stratified into nine groups by age, sex and race. A tendency for RDW to increase with age was noted, suggesting that age-specific cutoffs may be required.17.6 Serum iron, TIBC, transferrin, and transferrin saturation
Three interrelated variables, serum iron, total iron-binding capacity (TIBC), and transferrin saturation have been used in the past for differentiating between nutritional iron deficiency and anemia arising from chronic infections, inflammation, or chronic neoplastic diseases; their inter-relationship is shown in Figure 17.8. However, in view of the high biological variation of serum iron and transferrin saturation, they are used mainly in clinical settings to assess iron status. Today, in population surveys, serum iron and transferrin saturation have been replaced by serum ferritin and serum soluble transferrin receptor (sTfR).Compartment | Indicator | IDA | ACD | IDA + ACD | Over- load |
---|---|---|---|---|---|
Stored iron | S.Ferritin | ↓ | ~ to ↑ | ↓ to ~ | ↑ |
Transport iron | S.Iron | ↓ | ↓ | ↓ | ↑ |
Transferrin | ↑ | ↓ | ↓ | ↓ | |
TSAT | ↓ | ↓ | ↓ | ↑ | |
EP | ↑ | ↑ | ↑ | ↓ | |
sTfR | ↑ | ~ | ~ to ↑ | ~ | |
Functional iron | Hemoglobin | ↓ | ↓ | ↓ | ~ |
Inflammatory response | NA | ~ | ↑ | ↑ | NA |
17.6.1 Factors affecting serum iron, TIBC, serum transferrin, and transferrin saturation
Biological variation for serum iron may be quite large, resulting in large daily variation in transferrin saturation: coefficients of variation among individuals for serum or plasma iron may exceed 30% — mainly as a result of variation in the release of iron from the reticuloendothelial system to the plasma. As a result, more than one sample is needed for a clinical evaluation. Table 17.4 compares the overall variability of serum iron with Hb and serum ferritin as indicated by within-subject, day-to-day coefficient of variation (as %) for healthy subjects. In contrast, serum transferrin concentrations are steadier. In general, values for serum iron and thus transferrin saturation tend to be elevated in the morning (about 35%, ranging from 20‑55%) but decrease in the afternoon and evening. As a result, measurements should be determined on fasting morning blood samples. In this way, the effects of both recent dietary intake and diurnal variation are minimized. Note that among night-shift workers, the pattern of diurnal variation may be reversed (Lynch et al., 2018). TIBC is less subject to biological variation than is serum iron as noted earlier, but it is more susceptible to analytical errors. Day-to-day variation is about 8‑12% The large biological variation for serum iron has obvious implications for its use at both the population and individual levels. Furthermore, these limitations highlight the importance of using multiple indices of iron status to provide a more valid assessment of iron status than any single measurement (Section 17.10). In U.S. NHANES III, the large diurnal variation for serum iron is reflected in the results for transferrin saturation shown in Figure 17.9. This measure was included in U.S. NHANES II and III in the earlier MCV and ferritin models used to assess iron status, but has now been abandoned. Age-related changes in serum iron and serum transferrin are marked. Serum iron and transferrin levels rise during childhood until about the second decade of life (Figure 17.10). Values decline steadily with advancing age (Yip et al., 1984). Sex has only a small effect on serum iron and transferrin saturation until the teenage years, after which levels in males increase whereas those for females remain relatively constant (Figure 17.10). In U.S. NHANES II, there was a tendency for serum iron levels to be higher in males than females after the middle of the second decade of life (Pilch and Senti, 1984). In U.S. NHANES III, the median transferrin saturation was 26‑30% for men and 21‑24% for women (Appendix 17.3). This same trend of higher values in adult males than females 20‑70y, was also seen in the median transferrin saturation values compiled by Ritchie et al. (2002). Iron deficiency uncomplicated by the inflammatory response, leads first to a gradual reduction in iron stores, that once exhausted, results in a fall in serum iron levels. The low serum iron (and serum ferritin) levels down-regulate hepcidin synthesis, thus promoting iron absorption and greater iron release from storage sites into the circulation. As a consequence, serum transferrin increases to enhance the delivery of iron to the bone marrow to maintain effective erythropoiesis, so TIBC rises, resulting in a low transferrin saturation (Elsayed et al., 2016; Table 17.14). Because these changes appear during the second stage of iron deficiency — termed iron deficient erythropoiesis — when iron stores are exhausted, transferrin saturation is a more sensitive index of iron status than the red-cell indices discussed earlier in Section 17.4, but less sensitive than serum ferritin (Section 17.7). Transferrin saturation is more consistently useful for diagnosing iron deficiency than either serum iron or total TIBC alone: a low transferrin saturation in association with an elevated TIBC is specific for iron deficiency. Nevertheless, because of the diurnal variation in levels, and the confounding effect of inflammation (see below), percentage transferrin saturation is not a suitable biomarker for population surveys. Oral contraceptive agents and estrogen replacement therapy (i.e., conditions of estrogen excess) may lead to an increase in transferrin synthesis that is independent of body iron status. Levels of TIBC are also elevated, similar to those observed in iron deficiency (Pilch and Senti, 1984). Pregnancy leads to a steady decline in serum iron as the plasma volume expands, whereas serum transferrin concentration increases, resulting in a decrease in transferrin saturation. Because of these rapid changes during pregnancy, serum iron and transferrin saturation are rarely used for diagnosing iron deficiency in pregnancy (Fisher and Nemeth, 2017). The magnitude of these changes is less in women supplemented with iron during pregnancy. Iron overload results in an elevated body iron store and, thus, a high serum iron (and ferritin) level because of excessive absorption of iron and because there is no regulatory mechanism for controlling iron excretion. As a consequence, serum transferrin is reduced, TIBC falls, and transferrin saturation level is elevated (Table 17.14, Pfeiffer and Looker, 2017). In earlier U.S. NHANES III surveys, a transferrin saturation level > 70% was the criterion for detecting iron overload in adults. However, to detect iron overload today, WHO advises the inclusion of transferrin saturation and serum ferritin, plus details on known genetic and clinical risk factors (Garcia-Casal et al., 2018). The most common genetic risk factor for iron overload is hereditary hemochromatosis, with a worldwide prevalence in Caucasian populations of 3.5‑4.5 per 1000 population. It is more common in males. Clinical risk factors for othertypes of iron overload include hemolytic anemia, chronic liver disease, long-term transfusion therapy for genetic Hb disorders, and African iron overload (Elsayed et al., 2016). Anemia of chronic disease is associated with infectious diseases (see Section 17.2.1) that induce the acute-phase response, the local reaction of which is inflammation. Pro-inflammatory cytokines promote the release of hepatic hepcidin which in turn blocks the release of iron from the body stores into the circulation (independent of iron status) and inhibits absorption of dietary iron. Therefore, iron is no longer available for transport to the bone marrow for erythropoiesis. Consequently, concentrations of both serum iron and serum transferrin fall, so levels of TIBC are low. Hence, percentage transferrin saturation is decreased, a response primarily reflecting the decreased serum iron levels. Therefore, serum transferrin acts as a negative acute phase protein, decreasing in the anemia of chronic disease, whereas in iron deficiency anemia, serum transferrin concentrations are increased (Table 17.14). The rate at which serum iron concentrations return to normal after the acute phase response varies among individuals, sometimes normalizing with 24‑48hrs of an acute infection. In contrast, during chronic inflammatory states such as arthritis, serum iron levels may remain low for a prolonged period of time, thus decreasing the availability of iron to cells leading to the anemia of chronic disease. Such variability in the response causes uncertainty in the interpretation of serum iron in inflammation (WHO, 2007). Obesity is associated with lower serum iron and tansferrin concentrations leading to iron deficiency unrelated to dietary intakes; Hb concentrations are not reduced (Menzie et al., 2008).NW n=24 | OW/OB n=38 |
|
---|---|---|
Blood volume (mL/kg)a | 74.9 ± 5.8c | 61.8 ± 6.7 |
Blood volume (L)a | 4.59 ± 0.46c | 5.21 ± 0.82 |
Plasma volume (mL/kg)a | 46.6 ± 4.8c | 38.5 ± 4.7 |
Plasma volume (L)a | 2.86 ± 0.30c | 3.24 ± 0.54 |
RBC (mL/kg)a | 28.2 ± 2.1c | 23.4 ± 2.8 |
RBC volume (L)a | 1.74 ± 0.22c | 1.97 ± 0.33 |
Hb (g/dL)a | 13.5 ± 0.9 | 13.7 ± 1.1 |
Hb mass (g/kg)a | 9.2 ± 0.7c | 7.6 ± 0.9 |
Total Hb (g)a | 566 ± 71c | 641 ± 107 |
Serum iron (µg/mL)a | 1.06 ± 0.44 | 0.89 ± 0.33 |
Total serum iron (mg)a | 3.02 ± 1.28 | 2.82 ± 1.03 |
TIBC (µg/mL)a | 3.68 ± 0.66 | 3.39 ± 0.69 |
Total TIBC (mg)a | 10.5 ± 2.28 | 10.9 ± 2.66 |
Transferrin saturation (%) | 29.8 ± 13.4 | 26.8 ± 10.6 |
sTfR (mg/L)b | 6.61 (5.86, 7.45) | 6.84 (6.16, 7.59) |
Total sTfR (mg)b | 18.8 (15.0, 21.5)c | 21.9 (16.6, 28.7) |
SF (µg/L)b | 50.6 (40.2, 63.4) | 61.35 (48.5, 77.6) |
Total SF (mg)b | 0.14 (0.10, 0.18)c | 0.20 (0.13, 0.29) |
Body iron (mg/kg)a | 5.64 ± 2.70 | 5.70 ± 3.17 |
Serum hepcidin (ng/mL)a | 9.20 ± 6.44 | 11.92 ± 6.3 |
Total hepcidin (µg)a | 25.5 ± 17.6 | 38.3 ± 21.2 |
IL6 (pg/mL)b | 0.69 (0.53, 0.91)c | 0.97 (0.81. 1.17) |
Total IL6 (ng)b | 1.95 (1.36, 2.63)c | 3.1 (2.19, 4.42) |
CRP (mg/dL)b | 1.05 (0.60, 1.85)c | 2.68 (1.78, 4.01) |
Total CRP (mg)b | 29.87 (15.4, 53.5)c | 85.6 (48.1, 151.6) |
AGP (g/L)a | 0.79 ± 0.2c | 0.95±0.3 |
Total AGP (g)a | 2.24 ± 0.5c | 3.10 ± 0.82 |
17.6.2 Interpretive criteria — use of the distribution of reference values for serum iron, serum transferrin, TIBC, and transferrin saturation (as %)
Data shown below for the U.S., U.K., and New Zealand are based on an apparently “healthy” population sampled during a national nutrition survey. Also included is an additional set of U.S. data from a “healthy” reference sample group.- U.S. Tables of mean and selected percentiles by age and sex, for percentage of transferrin saturation, derived from all the persons in the U.S. NHANES III survey, with the exception of breastfeeding infants and children, are given in Appendix 17.3. (IOM, 2001). A diagrammatic summary of this information by age and sex is shown in Figure 17.11.
- U.K. data from the older U.K. Diet and Nutrition surveys are available. Gregory et al., 1990 and Gregory et al., 2000 present the mean, median, and lower and upper 2.5 or 5th percentiles for percentage transferrin saturation, plasma iron, and TIBC for adults and older children respectively. Potentially iron-deficient individuals were not specifically excluded.
- New Zealand Tables of the mean percentage transferrin saturation by age, sex, race or ethnicity for school-aged children (5‑15y), and the prevalence of low values (i.e., < 12% if ≤ 5y and < 14% if 6‑15y) derived from the New Zealand National Children's Nutrition Survey (Parnell et al., 2003) are available.
- U.S. Tables of the median, 2.5th and 97.5th percentiles by age and sex for percentage transferrin saturation, serum iron, and serum transferrin derived from a “healthy” reference sample of U.S. Caucasians 1‑80y are available. Individuals with evidence of inflammation (i.e., CRP > 10mg/L), suggestive evidence of iron excess (i.e., transferrin saturation levels > 80% for males and > 70% for females), and low serum iron values (i.e., < 5µmol/L) were excluded. Levels varied by age, generally rising until the second or third decade of life and then decreasing (Ritchie et al., 1999, 2002).
17.6.3 Cutoffs for serum iron, transferrin and transferrin saturation (as %)
Cutoffs for infants are not clearly defined because age-related changes in serum iron and transferrin are marked as shown in Figure 17.10. In newborns, serum iron concentrations vary markedly, prohibiting the use of percentage transferrin saturation as an indicator of iron status in neonates (Lynch et al., 2018).Age group (y) | Transferrin saturation (%) |
Serum ferritin (µg/L) | Erythrocyte protoporphyrin µmol/L RBCs |
---|---|---|---|
1‑2 | < 10 | < 10 | > 1.42a |
3‑5 | < 12 | < 10 | > 1.24b |
6‑11 | < 14 | < 12 | > 1.24 |
12‑15 | < 14 | < 12 | > 1.24 |
≥ 16 | < 15 | < 12 | > 1.24 |
17.6.4 Measurement of serum iron, TIBC, and serum transferrin
Serum iron can be assayed by a variety of methods, some of which can be performed using a clinical chemistry autoanalyzer. Colorimetric procedures frequently use ferrozine as the chromogen to react with Fe++ to form a violet complex (Giovanniello et al., 1968). Other chromogens that can be used include bathophenanthroline, sulfonate, and ferrozine (Elsayed et al., 2016). Alternatively, serum iron can be assayed directly by atomic absorption spectrophotometry. Often there are large discrepancies between serum iron concentrations assayed by different methods (Tietz et al., 1996), particularly at the lower end of the range where the diagnosis of iron deficiency is important (Worwood, 1996). Plasma iron concentrations normally range from 8.9‑21.5µmol/L (50‑120µg/dL), with those indicative of iron deficiency from 8.9‑10.7µmol/L (50‑60µg/dL). Factors that must be addressed when assaying for serum iron to ensure reliable results are shown in Box 17.3.
Box 17.3: Procedures to ensure reliable serum iron results
Total iron binding capacity can be calculated using
a direct assay method that
involves saturating the transferrin iron-binding capacity
with excess ferric (Fe3+) iron, and then removing the
excess unbound iron by using an adsorbent agent such as
magnesium carbonate, charcoal, or anion exchange resin.
The iron that is fully saturating transferrin (i.e.,
transferrin-bound iron) in solution is then measured
(ICSH, 1978).
Uncertainties in this assay include variations in the type
and amount of magnesium carbonate used to remove
unbound iron, and in the concentration of the
saturating-iron solution
(Pilch and Senti, 1984).
In 1990, the ICSH published revised recommendations for this assay
(ICSH, 1990).
An indirect method can also be used to calculate TIBC. In this method, serum is
incubated at near neutral pH with a predetermined
amount of Fe3+ that saturates all the available free sites
on serum transferrin. A chromogen is then added to
complex with the free unbound iron, and as the total
amount of iron added is known, UIBC can be measured.
TIBC is then calculated based on the sum of UIBC and
serum iron as shown in Section 17.6.
Potential sources of error in the measurement of both
serum iron and TIBC include contamination by exogenous
iron, interference by lipids and bilirubin in the
spectrometric methods, and a copper interference with
colorimetric assays
(Tietz et al., 1996).
To overcome the copper interference, the assay employing ferrozine, used
for serum iron and TIBC in U.S. NHANES III, was improved by
the addition of 1% thiourea
(Looker et al., 1997).
This led to lower serum iron values (by about 1.6µmol/L) in this
survey than those for U.S. NHANES II, with a much larger
discrepancy at lower concentrations than at higher ones
(Looker et al., 1995).
Quality-control sera, with certified
values for serum iron and TIBC and covering a wide range,
should be included with each assay. A reference material
for serum iron is available from the National Institute for
Standards and Technology (NIST SRM 937), although no
reference preparation exists for TIBC. Iron-free water
should always be used.
Serum transferrin can be assayed using several
immunological assays involving immunochemical
turbidimetry, nephelometry, radial immunodiffusion methods, and
enzyme-linked immunosorbent assays (ELISA).
Gambino et al.
(1997)
recommend using an automated nephelometric
method to assay serum transferrin and not the manual
radial immunodiffusion method. Variations between these
different methods have been reported, some involving failure of the
methods to take into account other iron-binding proteins
(Elsayed et al., 2016).
A certified reference material
(CRM 470 reference preparation for protein in human serum
RPPHS) is now available for serum transferrin.
Measurements of iron transport are now often omitted
from nutrition surveys because of the large volume of
serum sample required, cumbersome analytical methods,
and poor sensitivity and specificity for iron deficiency;
their greatest value is in distinguishing between the
anemia of chronic disease and that of true iron
deficiency (Table 17.14)
(Cook, 1999).
- Care must be taken to prevent adventitious contamination during collection and analysis of the serum/plasma samples
- Care is required to avoid hemolyzed samples which may falsely elevate iron concentrations
- Standardized protocols must be used for blood sampling to minimize variations due to time of day and post-prandial effects
- Well trained laboratory personnel to ensure accurate and reproducible results.
17.7 Serum ferritin
Ferritin was first identified in human serum by Addison et al. (1972), where it represents only a small fraction of the body's ferritin pool. Its function in the serum is unknown. Ferritin appears to enter the serum by secretions from hepatocytes or specialized macrophages (Cook and Skikne, 1982). The ferritin molecule consists of an intracellular hollow protein shell composed of 24 subunits that surrounds an iron core containing 4000‑4500 iron atoms (WHO, 2020). In most healthy individuals with no evidence of concurrent infection or inflammation, the concentration of serum or plasma ferritin parallels the total amount of storage iron (Cook et al., 1974). Once iron stores become exhausted, however, serum ferritin concentrations no longer reflect the severity of the iron-deficiency state. Serum ferritin is the only measure of iron status that can reflect a deficient, excess, or normal iron status. Evidence for the quantitative relationship between serum ferritin and storage iron is shown in Box 17.4.
Box 17.4: Evidence for the quantitative relationship
between serum ferritin and storage iron
Translation of serum ferritin values into the size of the iron
stores should be made cautiously, in view of the limited
knowledge of this relationship and the confounding factors
that influence serum ferritin concentrations. There is also
considerable between-subject variation in the relationship between serum ferritin
and tissue iron. In otherwise healthy individuals, a serum
ferritin concentration of 1µg/L is said to be equivalent to
approximately 8‑10mg of storage iron in an adult
(Cook, 1999).
During iron overload, however, the proportion of
iron stored as insoluble hemosiderin increases.
Besides providing a body store of iron, the uptake of iron
into ferritin limits the capacity of iron to generate free radicals and
prevents oxidative damage to tissues
(Ghio et al., 2006).
- Stainable bone marrow stores correlate positively with serum ferritin levels.
- Iron removal by phlebotomy produces a fall in serum ferritin levels, the decline paralleling changes in liver iron stores as measured by liver biopsy.
- Iron therapy and repeated blood transfusions generate a positive response in serum ferritin levels.
17.7.1 Factors affecting serum ferritin
Biological variation in serum ferritin levels is less marked than for serum iron. The overall within-subject day-to-day coefficient of variation for serum ferritin in healthy subjects over a period of weeks is about 15% (see Table 17.4), compared with approximately 30% for serum iron: the diurnal variation appears to be minimal. Analytical variation across differing automated methods for serum ferritin ranges from a CV of 10‑15%, whereas when the same analytical method is used the CV is < 10% (Blackmore et al., 2008).Age group (y) | Males (µg/L) | Females (µg/L) |
---|---|---|
1‑3 | 22.9 | |
4‑8 | 28.7 | |
9‑13 | 32.9 | 30.6 |
14‑18 | 46.7 | 27.0 |
19‑30 | 112.5 | 36.0 |
31‑50 | 155.9 | 39.9 |
51‑70 | 154.5 | 89.4 |
≥ 71 | 137.1 | 95.3 |
Pregnant | ‑ | 28.0 |
Lactating | ‑ | 32.9 |
Apparently healthy adults | Non-healthy adults |
|
---|---|---|
Bone marrow Fe content = 0µg/L | 15.10 | 82.43 |
Number of
studies included | 9 (n=390) | 38 (n=1023) |
Bone marrow Fe content ≥ 1µg/L | 70.37 | 381.63 |
Number of
studies included | 3 (n=151) | 38 (n=1549) |
Disease/Condition |
No iron overload (Liver iron concentration < 3.2mg/g dry liver wt. or defined by trialist) |
Iron overload present (Liver iron concentration > 3.2mg/g dry liver wt. or defined by trialist) |
---|---|---|
Hemochromatosis | 401.16 (n=78) | 1043.82 (n=247 ) |
Alcoholism, liver cirrhosis, liver disease | 755.2 (n=154) | 1322.63 (n=131) |
Chronic hepatitis C | 135.9 (n=526) | 350.3 (n=213 ) |
Non-alcoholic fatty liver disease, chronic viral hepatitis | 1356.2 (n=6) | 1425.5 (n=4) |
All diseases/conditions | 496.3 (n=764) | 1052.0 (n=595) |
Percentage body fat mass | Lower quartile Boys (n=183) | Middle quartiles Boys (n=374) | Higher quartile Boys (n=183) | p* |
---|---|---|---|---|
Biochemical serum indices | ||||
Fe (mg/L) | 935† (339) | 883‡ (341) | 782†‡ (299) | 0·001 |
TIBC (mg/L) | 3388 (578) | 3323 (497) | 3421 (493) | 0·144 |
TS (%) | 27·8† (9·6) | 26·8‡ (9·9) | 23·2†‡ (9·1) | 0·001 |
Ferritin (ng/ml) | 27·3§† (16·0) | 33·6§ (21·8) | 36·3† (23·9) | 0·001 |
17.7.2 Interpretive criteria ‑ use of the distribution of serum ferritin reference values
Reference value distributions for serum ferritin concentrations currently available have been drawn from a reference sample of unselected, apparently “healthy” individuals from the general population sampled during a nationally representative survey. Therefore, some of the persons in the sample will have almost no storage iron without being anemic, and a small proportion may even be anemic. As a result, even the “reference range” will include ferritin concentrations of persons who are iron deficient. This approach has been used in the following examples:- U.S. Tables of mean, SEM, and selected percentiles (2.5th to 97.5th) for serum ferritin (µg/L) by age, sex, and race-ethnicity for all children and adults participating in U.S. NHANES III (2003‑2006) (Pfeiffer et al., 2013); these are given in Appendix 17.4. Only breastfeeding infants and children were excluded. Modest, but significant decreases (≈10%) in serum ferritin concentrations were reported in women of child bearing age in U.S. NHANES III (2003‑2006) compared to U.S. NHANES III (2001‑2002)
- U.K. data compiled from the U.K. National Diet and Nutrition Surveys years 9-11 (2016‑2017 and 2018‑2019) includes methodological details. Tables of mean, median, and lower and upper 2.5 and 95th percentiles for serum ferritin (µg/L) by age and sex are included in a condensed (“zipped”) comprehensive set of data tables based on information from (U.K. National Survey years 1‑9)
- New Zealand Tables of mean (95th confidence interval) or mean (SEM) for serum ferritin values by age, sex, and race or ethnicity for children aged 5‑14y in 2002 (Parnell et al., 2003) and persons 15y and older (2008‑2009) in the New Zealand Adult Nutrition Survey (University of Otago and Ministry of Health, 2011).
17.7.3 ‑ Cutoffs for serum ferritin
Clearly, the assessment of the prevalence of iron deficiency based on a low serum ferritin concentration is challenging in settings where infection or inflammation are widespread. Many approaches have been proposed for adjusting for the effect of inflammation on ferritin and other iron biomarkers (Thurnham, 2014; Suchdev et al., 2017). Recently, a new regression modeling approach has been developed by the BRINDA group (Biomarkers Reflecting Inflammation and Nutritional Determinants of Anemia). In this approach, the inflammatory biomarkers (CRP and AGP) are treated as continuous variables because no clear cutoff was found for CRP or AGP at which there was a change in the relationship between inflammation and ferritin. By using this new approach, the full range and severity of inflammation can be accounted for, with greater corrections applied when the inflammatory biomarkers indicate severe inflammation; for more details see Raiten et al. (2015) and Suchdev et al. (2017). The BRINDA approach differs from the earlier correction factor method developed by Thurnham (2014). In this earlier method, the stages of inflammation (incubation, early, late convalescence) were first classified, after which specific cutoffs for elevated levels of serum CRP (i.e.,> 5mg/L) and AGP (i.e.,> 1.0g/L) were applied; see Thurnham (2014) for more details. Table 17.21Biomarker in serum | Geometric mean (95% CI) | Proportion at risk (%) |
---|---|---|
Ferritin*: No adjustment | 14.5µg/L (13.6‑17.5) | 44.9 |
Ferritin: Brinda adjustment | 8.8µg/L (8.0‑9.8) | 64.9 |
Age | Serum ferritin concen- tration (µg/L) | Reference |
---|---|---|
4mos | < 20 | Domellöf et al. (2002a) a |
6mos | < 9 | |
9mos | < 5 | |
1‑2y | < 10 | Looker et al. (1997) b |
3‑5y | < 10 | |
6‑11y | < 12 | |
12‑15y | < 12 | |
≥ 16y | < 12 | |
0 ‑ 23mos | < 12 | WHO (2020) |
24 ‑ 59mos | < 12 | |
5 ‑ < 10y | < 15 | |
10 ‑ < 20y | < 15 | |
20 ‑ 59y | < 15 | |
≥ 60y | < 15 | |
Pregnant women | < 15 first trimester |
Age group (y) | Males | Females |
---|---|---|
20‑44 | > 200 | > 150 |
45‑64 | > 300 | > 200 |
65‑74 | > 400 | > 300 |
17.7.4 Measurement of serum ferritin
Venipuncture or capillary blood samples, fasted or nonfasted, can be used for serum or plasma ferritin, although within- and between-sample variation tends to be larger with capillary than venous specimens. Blood must be refrigerated immediately after collection, and processed within a few days. For ferritin assays, serum is stable for > 1wk at 4°C, and for > 1y at < −20°C, and can be subjected to 3 freeze-thawing cycles without any negative affect on the concentrations. For optimal long-term storage, serum must be stored at < −40°C, and when stored at −70°C, serum ferritin is stable for > 10y (Pfeiffer and Looker, 2017). Dried serum spot (DSS) samples can also be used (Ahluwalia et al., 2002), a major advantage for field studies. Before analysis, the DSS must be digested for 6h with cellulase from Trichoderma reesei. In the past, serum ferritin was often determined with a single-incubation 2‑site immunoradiometric assay (IRMA), a procedure used in the earlier U.S. NHANES and the U.K. Diet and Nutrition Surveys. In later U.S. NHANES (2004‑2006), the Roche Tina-quant ferritin immunoturbimetric assay has been used on a clinical analyzer. This method, although automated, requires a large sample (> 150µL) which is a disadvantage for capillary or pediatric specimens. Today, commercial kits based on enzyme-linked immuno assays (ELISA) are also available which compare relatively well across manufacturers, with CVs ranging from 10—15% (Lynch et al., 2018). For a review of the performance and comparability of aboratory methods for measuring ferritin concentrations in serum or plasma, the reader is referred to Garcia-Casal et al., 2018. A ferritin certified reference material is available from WHO through the U.K. National Institute for Biological Standards and Controls (NIBSC, RM 94/572). This was used in NHANES III, and the use of this reference material as a calibration check is strongly encouraged.17.8 Erythrocyte protoporphyrin
When the supply of iron is adequate, heme is synthesized by the incorporation of iron into protoporphyrin IX by the enzyme ferrochetalase. However, when there is insufficient iron to allow this reaction, zinc is substituted for iron, forming zinc protoporphyrin (ZPP). The ZPP then accumulates within the iron-deprived circulating erythrocytes, and can be measured directly in samples of whole blood using a portable hematofluorometer. An alternative chemical method can also be used whereby the porphyrins are extracted in a solvent, after which the porphyrins are measured fluorometrically. With this method, ZPP is converted to free erythrocyte protoporphyrin (FEP) (WHO, 2007). This extraction method now yields measurements almost identical to the direct measurements of ZPP performed using a portable hematofluorometer, provided the instrument used is properly calibrated and maintained, and a standardized procedure followed. The zinc-for-iron substitution occurs predominantly within the bone marrow so a rise in the concentration of ZPP is one of the first indicators of insufficient iron in the bone marrow. Zinc protoporphyrin persists in the iron-deprived circulating erythrocytes for the duration of their lifespan (i.e., ≈ 120d). Therefore, an increased ZPP concentration in the blood indicates that the majority of the erythrocytes matured at a time when the iron supply was suboptimal (i.e., during the preceding 3‑4mos), and thus provides a measure of uncomplicated iron-deficiency. The more pronounced the iron deficiency, the higher the ZPP values, with the highest values seen in severe iron deficiency anemia. As ZPP and FEP are now interchangeable, the term erythrocyte protoporphyrin (EP) is now recommended, irrespective of the measurement method used, and is the term applied herein. A normal healthy person will have an EP concentration of less than 40‑50µg EP/dL of red blood cells (RBCs), but when iron stores are exhausted (i.e., iron deficient erythropoiesis), the concentration may increase to more than 70‑100µg/dL RBCs, reaching as high as 200µg/dL in iron deficiency anemia (WHO, 2007). When a hematofluorometer is used to measure EP, Hb concentrations are also measured, allowing the EP to be expressed directly as a ratio of EP/Hb. Use of the ratio minimizes the effect of dilution that results from the expansion in plasma volume that occurs in pregnancy: EP, RBCs, Hb, and heme are diluted equally. In this way, a misinterpretation of laboratory results is avoided that may arise, for example, from plasma-volume changes in pregnancy. However, EP is expressed in several other ways in the literature, and may include EP relative to either whole blood (i.e., µg EP / dL whole blood) or RBCs (i.e., µg EP / dL RBCs). When the hematocrit is known, then the conversion of µg EP per dL whole blood to µg per dL RBCs is as follows: \[\small \mbox {µg EP per dL red blood cells} = \frac{\mbox {µg EP per dL whole blood}}{\mbox{Hematocrit (%)}} \] From µg EP per dL RBCs to µg EP per g Hb: multiply by 0.037. From µg EP per dL RBCs to µmol EP per mol heme: multiply by 0.87. These factors are based on the assumption that the MCHC is normal, although when MCHC is measured in individual samples, then an appropriate factor can be calculated. For more details on the differing EP reporting units and their inter-conversion, see Beard in WHO (2007). Table 17.24Children (n=762) 2 | Non-Pregnant Women (n=2746) 2 | Pregnant Women (n=684) 2 |
|
---|---|---|---|
EP | 0.785 ± 0.049a | 0.864 ± 0.011a | 0.771 ± 0.022a |
Hb | 0.596 ± 0.054b | 0.841 ± 0.011a | 0.743 ± 0.022a |
MCV | 0.703 ± 0.052a | 0.802 ± 0.014b | 0.698 ± 0.026b |
Measurements | Interpretation | Recommendation |
---|---|---|
Low EP/Hb ratio (< 60µmol/mol) | Adequate systemic iron supply |
Iron stores can be estimated by the ferritin concentration; If EP/Hb ratio < 40µmol/mol, consider tests for iron overload (TSAT) |
Mid-range EP/Hb ratio (60‑80µmol/mol) |
Possible non-replete iron status; consider inadequate diet, ACD, or other causes |
CBC may support case for iron depletion; ferritin can be used to differentiate low iron stores from inflammatory blockade; could then use ferritin concentration to verify inflammation |
High EP/Hb ratio, (> 80µmol/mol) and low ferritin con- centration (< 20µg/L) |
Iron deficient erythropoiesis attributable to low marrow iron supply, may be related to depleted iron stores |
Iron supplementation; monitor therapy with decrease in the EP/Hb ratio and/or increase in reticulocyte count |
High EP/Hb ratio (> 80µmol/mol) and high ferritin con- centration (> 200µg/L) |
Severe inflammatory blockade, ACD, other causes of impaired iron utilization |
Correct the causes(s) of impaired iron utilization; consider chronic lead poisoning or ineffective supplementation |
17.8.1 Factors affecting erythrocyte protoporphyrin
Biological variation for EP is ≈6.5%. This includes circadian variation (day-to-day) and diurnal variation (within one day). Levels between 18.00hrs and midnight are higher for reasons that are unkown (Soldin et al., 2003). Age-related trends suggest that levels of EP are highest from age 0‑12mos, probably reflecting the rapid erythropoiesis in this age group. After infancy, they decrease until adolescence (10‑17y), when they appear to increase, declining slightly thereafter (Soldin et al., 2003; Table 17.26). Sex-related changes in EP have been described, with girls having significantly higher levels than males at 10‑17y. Likewise, adult women have slightly higher levels than males (Soldin et al., 2003). Iron deficient erythropoiesis, characterized by the exhaustion of iron stores, leads to a slow but progressive increase in EP in the peripheral blood which is apparent before any decline in Hb and MCV. The increase in EP concentration occurs slowly because only the newly produced erythrocytes containing ZPP appear in the peripheral blood to replace those erythrocytes at the end of their life span (i.e., ≈ 120 days) (Mei et al., 2017). Infection / Inflammation is associated with elevated levels of EP. This is due to the increase in pro-inflammatory cytokines in the systemic circulation which stimulate an increase in hepcidin concentrations. Elevated level of circulating hepcidin reduce both iron absorption and the release of iron from body stores so that iron is no longer available for transport to the bone marrow for erythropoiesis. When the iron is no longer available, divalent zinc is inserted into protoporphyrin, so concentrations of EP are elevated, irrespective of the EP assay method used. As a result, during inflammation, assay of EP alone cannot be used to distinguish between the anemia of iron deficiency and the anemia of chronic disease. Pregnancy is believed not to result in a decline in EP when expressed as a molar ratio to Hb, as the ratio is theoretically independent of hemodilution. Consequently, EP expressed as a molar ratio to Hb has been proposed as a preferred marker of iron status in pregnancy (Schifman et al., 1987). However, in pregnant women in Kenya without evidence of inflammation or infection with Plasmodium or HIV, EP reportedly had a limited ability to discriminate between women with and without iron deficiency even when combined with Hb, and irrespective of whether EP was measured in washed erythrocytes or whole blood using a hematofluorometer or by solvent extraction. Moreover, the prevalence of iron deficiency was grossly over-estimated when applying the conventional EP cutoff for whole blood (> 70µmol/mol Hb) in comparison with that based on plasma ferritin concentrations < 15µg/L, especially when the prevalence of iron deficiency was low (e.g., 10%) (Mwangi et al., 2014). Based on these results, the usefulness of EP:Hb molar ratio to assess iron status during pregnancy, particularly in disadvantaged settings, remains uncertain. Lead toxicity can result in elevated concentrations of EP due to disturbances in the heme synthesis pathway; lead inhibits porphobilinogen synthase which results in an increased excretion of aminolaevulinic acid (ALA) in the urine. Lead may also have a direct effect on the enzyme ferrochetalase (WHO, 2007). As a consequence, ZPP (now termed EP) is formed instead. In U.S. NHANES II, EP values were elevated in children 1‑4y with high blood lead values, although lower in U.S. NHANES III following the introduction of lead-free petrol (Looker et al., 1997). Genetic Hb disorders such as sickle cell anemia, thalassemia, and Hb E increase EP concentrations, most likely due to ineffective erythropoiesis and red blood cells with a short life span (Graham et al., 1996; Mwangi et al., 2014; Pfeiffer and Looker, 2017). The relative iron deficiency that occurs in these disorders has also been proposed as a possible factor, although seemingly unlikely because of the increase in EP reported in individuals with these conditions, even in the absence of nutritional iron deficiency (Graham et al., 1996). Malaria from Plasmodium infection is associated with elevated EP concentrations in whole blood or erythrocytes, as a consequence of impaired erythropoiesis and the induction of the acute phase response, and subsequent upregulation of hepcidin; see also “Malaria” in Section 17.2.1 for more details.17.8.2 Interpretive criteria — use of the distribution of erythrocyte protoporphyrin reference values
Details of the distribution of reference values from four sources are described below, of which only one was based on a “healthy” reference sample.- U.S. Tables of mean, SEM, selected percentiles for erythrocyte protoporphyrin (measured as FEP) expressed as µmol/L RBCs by age, sex, and race based on all persons in U.S. NHANES II.
- New Zealand Tables of mean, SEM for the ZnPP: Hb ratio (µmol/mol) by age, sex, and race or ethnicity for all persons > 15y participating in the 1997 national survey; those with conditions affecting ZPP levels were not excluded. Measurements of ZPP were performed using a hematofluorometer (Russell et al., 1999).
Blood ZPP Reference Ranges 2.5th‑97.5th percentiles (µg/dL)* | Blood ZPP Reference Ranges 2.5th‑97.5th percentiles (µmol/mol heme) | |||
---|---|---|---|---|
Age Groups | Males | Females | Males | Females |
0‑12mos n=145M; 203F | 8.5‑34.5 | 9‑40 | 15.6‑63.5 | 16.6‑73.6 |
13‑24mos n=605M; 725F | 10‑34 | 11‑32 | 18.4‑62.6 | 20.2‑58.9 |
2‑5y n=1,926M; 1,822F | 5‑35 | 10‑31 | 9.2‑64.4 | 18.4‑57.0 |
6‑9y n=522M; 408F | 6‑31 | 9‑30 | 11.0‑57.0 | 16.6‑55.2 |
10‑17y n=61M; 61F | 5.5‑31.5 | 5‑33.5 | 10.1‑58.0 | 9.2‑61.6 |
- Canadian Tables of geometric mean (95th CI) and reference ranges (2.5th‑97.5th percentile) for ZPP (expressed as µg/dL whole blood and as µmol/mol heme) by sex and age for infants and children age 0‑17y; children known to have conditions affecting ZPP levels were not excluded. Data were from blood samples taken in a large pediatric hospital (n=6478) and assayed using a hematofluorometer (Soldin et al., 2003). Table 17.26 presents the pediatric “reference range” or “range of normal” for males and females for five age groups, with the 97.5th percentile value corresponding to the upper reference limit. Values above the upper reference limit are classified as “unusually high”.
- U.S. Tables of mean, SEM, selected percentiles for erythrocyte protoporphyrin (as FEP expressed as µmol/L) by age, sex, and race for a “healthy” reference sample. Data from persons with conditions known to affect iron status were excluded. Measurements were performed using a variant of the solvent extraction method (Looker et al., 1997).
17.8.3 Cutoffs for erythrocyte protoporphyrin
Cutoff for infants aged 4, 6, and 9mos expressed as µmol/mol heme based on iron-replete breastfed infants are presented in Table 17.16 (Domellöf et al. 2002). WHO (2017) present a single cutoff for infants 0‑12mos as > 80µg/dL RBC (i.e., > 1.42µmol/L RBC; 2.7µg/g Hb; > 70 µmol/mol heme) (Table 17.27). Cutoffs for children ages 1‑2y, 2‑9y and adolescents (girls) age 10‑17y are also shown in Table 17.27. These cutoffs are based on the CDC recommended demarcation between iron deficient erythropoiesis and iron sufficient erythropoiesis, expressed as µmol/L RBCs or as µg/dL RBCs. Table 17.27 also includes the 97.5th percentiles (expressed as µg/dL RBCs) adapted from Soldin et al. (2003) for comparison.Age | EP (µmol/L RBC |
Suggested thresholda (µg/dL red cells) |
97.5th percentile (µg/dL red cells) |
---|---|---|---|
0‑12mos | > 1.42 | > 80 | 40 |
1‑2y | > 1.24 | > 80 | 32 |
2‑9y | > 1.24 | > 70 | 30 |
10‑17y (girls) | > 1.24 | > 70 | 34 |
17.8.4 Measurement of erythrocyte protoporphyrin
Two methods can be used to measure erythrocyte protoporphyrin: a direct and indirect method. The direct method uses a portable hematofluorometer to measure the fraction of blood protoporphyrin that exists as the zinc chelate (i.e., ZPP). The manufacturer of the hematofluorometer assumes that ZPP comprises 95% of all the erythrocyte protoporphyrin in blood, thus providing the basis for the estimates of EP concentrations (WHO, 2017). Only a drop of fresh whole, unprocessed blood (< 20µL) obtained by capillary sampling is required, and the measurement is available in ≈ 1min. Calibration standards are normally provided to check the stability of the hematofluorometer (Labbé et al., 1999), although for recalibration, the equipment must be shipped back to the manufacturer. A NCCLS Guideline for erythrocyte protoporphyrin testing is available. Several issues may affect the direct measurement of EP using a hematofluorometer. These include the requirement to oxygenate the blood sample if the time between the blood sampling and EP measurement is > 30min, and the need to wash the red blood cells with saline. Incomplete oxygenation produces falsely low values because of a shift in Hb absorption. To ensure complete oxygenation and dissolution of red-cell aggregates, the whole blood must be stirred gently using a disposable plastic pipet tip. Wooden applicator sticks should not be used for mixing as they may contain fluorescent by-products. Successive observations should be within 10%. Use of red blood cells that are washed with saline rather than whole blood are recommended to remove interference by non-porphyrin fluorescent compounds such as bilirubin, certain drugs, and high riboflavin concentrations that may be present in the plasma (Hastka et al., 1992), but is rarely performed. Application of these strategies is said to reduce the number of falsely high results and improve the reproducibility and precision of the EP measurements; they are discussed in detail in Labbé et al. (1999). The indirect method involves a variation of the acid extraction method of Chisolm and Brown (1975) during which ZPP is converted to FEP. This method is more time consuming and less widely used, although used by U.S. NHANES II and III (Mei et al., 2017). It involves the extraction of total protoporphyrin from anticoagulated whole blood into a mixture of ethyl acetate-acetic acid, then back-extraction into dilute hydrochloric acid, followed by measurement of protoporphyrin fluorometrically. Measurements of EP using this method can be made on stored blood samples or from blood collected on filter paper in the field. Results for EP using this indirect method are similar to those using the direct method, as noted earlier, provided the hematofluorometer used is properly calibrated and maintained and a standardized procedure is followed (Mei et al., 2003). A novel non-invasive method has been developed to optimally measure EP in the microcirculation of the lower lip by using an optical fiber probe to illuminate the lip and acquire fluorescence emission spectra in ≈ 1min. The method is fast and provides specific testing for iron deficiency and iron deficiency anemia at the point of care without the need for blood drawing; details are given in Hennig et al. (2016). Method reliability was compared by measurements of EP by both HPLC and fluorescence spectroscopy, and feasibility tested on young children. Measurements of EP by this novel method to identify iron deficiency and iron deficiency anemia in children 9mos‑5y compared well with those based on ferritin, serum soluble transferrin receptor, and Hb (Homann et al., 2019).17.9 Serum soluble transferrin receptor
Transferrin receptor (TfR) is an iron-related protein that regulates the uptake of transferrin, carrying iron into body cells. The surfaces of all cells express TfR in proportion to their requirement for iron, although the largest number are in the erythron, placenta, and liver (Beguin, 2003). A soluble form of sTfR circulates in human plasma bound to transferrin and is usually called soluble transferrin receptor (sTfR). The predominant source of sTfR in the plasma pool are the cells of the developing red-cell mass — the erythroblasts and reticulocytes. Hence, the concentration of sTfR reflects erythropoietic activity in the bone marrow (Table 17.28).sTfR | Condition |
---|---|
Increased or not affected | Increased erythroid proliferation or ineffective erythropoiesis: |
— Autoimmune hemolytic anemia | |
— Hereditary spherocytosis | |
— Beta thalassemia/HbE | |
— Hb H disease | |
— Sickle cell anemia | |
— Polycythemia vera | |
—Vitamin B12 deficiency | |
— Folic acid deficiency | |
Decreased tissue iron stores: | |
— Iron-deficiency anemia | |
Normal to increased | Idiopathic myelofibrosis |
Myelodysplastic syndrome | |
Chronic lymphocytic leukemia | |
Normal | Hemochromatosis (see text) |
Acute and chronic myeloid leukemia | |
Most lymphoid malignancies | |
Solid tumors | |
Decreased | Chronic renal failure |
Aplastic anemia | |
Post bone-marrow transplantation | |
Hypertransfusion |
17.9.1 Factors affecting serum soluble transferrin receptor
Biological variation for soluble transferrin receptor concentration is low, with reasonably stable concentrations within an individual so that only one blood sample is sufficient to measure sTfR. Cooper and Zlotkin (1996) determined the total day-to-day within-subject coefficient of variation (CV) for a group of healthy men (n=10) and women (n=11) aged 19‑46y, based on measurements on 10 nonconsecutive days over a 4wk period. Biological variation for serum sTfR in this study was 12.5%, compared with 8.9% (Lammi-Keefe et al., 1993) and 8.1% (Belza et al., 2005) in other population groups. Age-related changes in serum sTfR occur, in part as a result of the increase in erythropoiesis during growth, although other mechanisms may be involved. Levels increase from birth until ≈ 7.5mos in breast-fed infants, after which they level off, remaining relatively stable for the rest of the first year of life (Ziegler et al., 2014). During childhood and adolescence, data to define age related trends in serum sTfR levels are more limited. In the U.S. NHANES 2003‑2010 surveys, serum sTfR concentrations were higher in preschool children age 1‑2y than those aged 3‑5y (Figure 17.14). In adolescent girls (15‑19y), concentrations were higher than those for adult women aged 20‑34y, although not higher compared to adults aged 35‑49y (Mei et al., 2012). These age-related trends have also been reported in other studies (Choi et al., 1999; Virtanen et al., 1999). Sex-related differences in serum sTfR are small (Worwood, 2002). During early infancy, values may be higher for males than for females, perhaps as a result of sex differences in fetal iron accretion (Domellöf et al., 2002a). These differences have not been reported consistently in older infants (9‑15mo) (Yeung and Zlotkin, 1997). In the U.S. NHANES 2003‑2010 survey, however, sTfR concentrations were also higher in preschool-aged boys than girls after adjusting for socio-demographic variables (Mei et al., 2012). Race may influence serum sTfR concentrations. Concentrations for African American pre-school children and non-pregnant women were 9% higher than those for Caucasians, Asians, and Hispanics in the U.S. NHANES 2003‑2010 surveys (Mei et al., 2012). Such race-related differences may be attributed to the well-established but as yet unexplained lower Hb concentration known to occur among persons of African descent (Allen et al., 1998). Tissue iron deficiency leads to increases in serum sTfR, as noted earlier. Even after iron stores are totally exhausted, serum sTfR concentrations continue to increase in proportion to the increasing tissue iron deficit, as Hb concentrations fall (Skikne et al., 1990). This trend has been observed in neonates (Rusia et al., 1996), infants and young children (Olivares et al., 2000), pregnant women (Carriaga et al., 1991), and adults (Skikne et al., 1990). When the iron supply is not limiting, then concentrations of sTfR in plasma or serum can be used to monitor bone marrow erythropoiesis (Lynch et al., 2018). Iron overload in patients with hemachromatosis and in those with African iron overload has been associated with serum sTfR concentrations within the normal range (Baynes et al., 1994), so that measurement of sTfR is not useful for diagnosing iron overload. Pregnancy is accompanied by marked physiological changes that may confound the interpretation of serum sTfR levels. Although reported to provide a sensitive biomarker of iron deficiency during pregnancy (Carriaga et al., 1991), sTfR levels are also influenced by changes in the rate of erythropoiesis during this time. For example, during early pregnancy, the rate of erythropoiesis decreases and may mask the development of iron deficiency (Akesson et al., 1998), whereas in later pregnancy when increases in serum sTFR are observed, whether they are related to the increase in erythropoiesis rather than iron depletion is uncertain (Worwood et al., 2017). The elevated concentrations of serum sTfR that are evident in later pregnancy return to non-pregnant values 12wks after delivery (Choi et al., 2000). In pregnant women in Malawi in which iron biomarkers were investigated by comparison with stained bone marrow aspirates, sTfR did not enhance the sensitivity and specificity for detecting iron deficiency anemia in pregnancy (Van Den Broek et al., 1998). Lynch (2011) has proposed the use of the ratio of sTfR to serum ferritin to detect iron deficiency during trimesters 1 and 2, but has no recommendation for the third trimester of pregnancy. However, total body iron (Section 17.10.1) was used to assess iron status in women in the 1st, 2nd, and 3rd trimester of pregnancy in the cross-sectional U.S NHANES 1999‑2006 study (Mei et al., 2011). Table 17.29 presents the changes in several iron biomarkers, including serum sTfR, body iron (Section 17.10.1) and serum hepcidin (Section 17.11.1), in a longitudinal study of pregnant women in the Gambia at 14wk, 20wk, and 30wk gestation, supplemented with iron from enrolment to delivery (Bah et al., 2017).Index | 14wk n=395 | 20wk n=375 | P | 30wk n=367 | P |
---|---|---|---|---|---|
Gestational age, wk | 14.1 (8.0, 21.3) | 20.4 (15.0, 26.9) | 30.5 (25.4, 34.4) | ||
Hemoglobin, g/dL | 11.55 (7.2, 17.9) | 11.00 (7.4, 14.5) | < 0.001 | 10.77 (6.2, 14.4) | < 0.0001 |
MCV, fL | 81.9 (60.9, 98.6) | 83.8 (62.9, 104.0) | < 0.001 | 83.6 (61.8, 99) | NS |
Serum ferritin, µg/L | 20.69 (0.1, 237.2) | 19.20 (0.1, 273.8) | NS | 14.29 (0.1, 315.5) | < 0.001 |
Serum sTfR, mg/L | 4.41 (0.58, 17.97) | 4.25 (1.12, 15.42) | NS | 4.80 (1.49, 17.81) | < 0.001 |
Serum sTfR-F index | 3.29 (−14.80, 111.63) | 3.26 (−5.63, 56.43) | NS | 3.86 (−87.19, 76.26) | NS |
Serum CRP, mg/L | 1.70 (0.02, 43.48) | 2.41 (0.00, 59.32) | 0.001 | 2.29 (0.01, 126.68) | NS |
Total body iron, mg/kg | 2.70 (−18.38, 14.40) | 2.50 (−17.57, 14.06) | NS | 1.18 (−17.84, 11.02) | < 0.001 |
Serum hepcidin, ng/L | 1.59 (0.03, 49.79) | 1.23 (0.02, 45.70) | 0.006 | 1.09 (0.04, 135.69) | NS |
17.9.2 Interpretive criteria — use of the distribution of soluble transferin receptor reference values
Defining reference values for sTfR in healthy individuals is difficult because serum sTfR concentrations and the units of expression vary with the assay; even different kits based on the ELISA technique are associated with different “reference” ranges. An international standard is now available (Thorpe et al., 2010), so distributions of reference values and internationally applicable cutoff values for sTfR should be available in the future. Details of the distribution of reference values from three sources are described below, each drawn from a “healthy” reference sample in which participants with conditions known to affect iron status were excluded. For each distribution of reference values, a different assay method was used.n | Geometric mean† | 2.5th percentile | 97.5th percentile | |
---|---|---|---|---|
Children | ||||
1‑2y M | 386 | 4.29 (4.16, 4.42)a | 2.53 (2.22, 2.94) | 6.46 (6.12, 6.86) |
1‑2y F | 354 | 4.19 (4.07, 4.31)a | 2.76 (2.66, 2.96) | 6.02 (5.59, 6.62) |
3‑5y M | 735 | 3.91 (3.84, 3.99)b | 2.55 (2.40, 2.64) | 5.97 (5.67, 6.23) |
3‑5y F | 678 | 3.83 (3.76, 3.90)b | 2.57 (2.38, 2.71) | 5.67 (5.38, 5.90) |
Non-pregnant women | ||||
15‑19y | 1237 | 3.14 (3.06, 3.23)a | 1.86 (1.77, 1.97) | 5.25 (4.99, 5.70) |
20‑49y | 3423 | 3.05 (3.00, 3.09)b | 1.65 (1.59, 1.72) | 5.40 (5.18, 5.66) |
- U.S. Tables of geometric mean, median (not shown), and lower (2.5th) and upper (97.5th) percentiles for “healthy” preschool children aged 1‑5y (by age and sex) and non-pregnant women 15‑49y (by age) participating in the U.S. NHANES III (2003‑2010) (Table 17.30). Geometric means were calculated because serum sTfR values were positively skewed. Measurements of serum sTfR were performed using the Roche Tina-quant automated sTfR immunoturbidity assay. Correlation between this immunoturbidity assay and the ELISA (Ramco Laboratories) assay is reportedly good, although values from the Roche assay are on average 30% lower than those with the ELISA assay (Pfeiffer et al., 2007).
- Korean table of mean (SD), 95% CI for “healthy” subjects (n=849) ranging in age from neonates (birthweight > 2500g) to adults 23‑62y. Those with a history of blood transfusions, major surgery, recent infections, or disease were excluded. Participants were nonanemic (i.e., Hb ≥ 110g/L) with no evidence of iron deficiency. Measurements were performed using an ELISA kit (Orion Diagnostica, Espoo, Finland) that is no longer available (Table 17.31). (Choi et al., 1999).
Age | Mean ± SD (mg/L) | 95% CI (mg/L) | |
---|---|---|---|
Neonates | 0‑5min | 4.95 ± 1.24 | 2.21‑6.74 |
Children | |||
— Infants | 4‑24 mo | 4.51 ± 1.12 | 2.15‑6.31 |
— Young children | 3‑7 y | 3.02 ± 0.76 | 1.47‑4.24 |
Adolescents | |||
— Middle school | 14‑16 y | 2.86 ± 0.74 | 1.35‑4.19 |
— High school | 17‑19 y | 2.09 ± 0.55 | 1.18‑3.23 |
Adults | 23‑62 y | 2.13 ± 0.51 | 1.22‑3.31 |
- Finnish Tables of 2.5th and 97.5th percentile reference limits with 95% CI for children 6mos to 16y categorized into four age groups (6mos‑4y, n=52; 4‑10y, n=60; 10‑16y, n=160; > 16y (Suominen et al., 2001). Those with conditions known to affect iron status were excluded. The clinical validity of the reference limits were confirmed for each age group by comparison of stained bone marrow samples with serum sTfR values from 24 children 1.25‑16.5y (Suominen et al., 2001). Measurements were performed using an automated immunoturbidimetric assay (IDeAsTfR-IT; Orion Diagnostica) on a Hitachi 917 analyzer.
17.9.3 Cutoff values indicative of risk tissue iron deficiency
There is currently no universally agreed cutoff value for serum sTfR concentration because of the large assay differences in the measurement of sTfR, as noted earlier. These discrepancies reflect the differences in preparations of transferrin receptor used to raise antibodies and as a standard in the various assays. As a consequence, assay-dependent cutoffs must be applied. There is an urgent need to establish internationally applicable cutoff values for serum sTfR concentrations. Cutoffs for breastfed infants at age 4, 6, and 9 mos were developed by Domellöf et al. (2002a); these are shown in Table 17.32. No details of the assay used are provided.Iron status variables | 4mo | 6mo | 9mo |
---|---|---|---|
Hb (g/L) | < 105 | < 105 | < 100 |
MCV (fL) | < 73 | < 71 | < 71 |
ZPP (µmol/mol heme) | > 75 | > 75 | > 90 |
Ferritin (µg/L) | < 20 | < 9 | < 5 |
sTfR (mg/L) | > 11 | > 11 | > 11 |
17.9.4 Measurement of serum soluble transferrin receptor
Serum is the preferred matrix although some assays can use EDTA-heparin or citrate plasma. Both venous and capillary blood samples can be used but must be refrigerated immediately after collection. Serum samples can be stored for no longer than 2d at room temperature, 7d at 4°C, and 1y at < −20°C. Pfeiffer and Looker (2017) report serum sTfR was stable for > 10y when stored at −70°C. Repeated freezing and thawing is not recommended, although < 3 freeze-thawing cycles do not negatively affect serum sTfR concentrations. Moderate hemolysis does not confound the results. Assays on whole-blood spots dried on filter paper are now possible, although not widely used (Cook et al., 1998; McDade et al., 2002). In the past, two-site immunoradiometric assays and ELISA were used to measure serum sTfR. Today, measurement of serum TfR in clinical laboratories is carried out via immunoassays using commercial kits on automatic clinical analyzers (e.g., Tina-quant sTfR, Roche Diagnostics) (Kolbe-Busch et al., 2002). However, clinical analyzers are expensive, require a relatively large sample volume (typically > 150µL), and utilize reagents that are relatively costly, with poor comparability across assays. In low income countries, manual ELISA assays available from a few manufacturers are still used, requiring a smaller sample volume (< 50µL), and a relatively inexpensive microplate reader, although their precision is only moderate (Lynch et al., 2018). The RAMCO enzyme immunoassay yields values that are on average 30% higher than those from the Roche Tina-quant sTfR assay (Pfeiffer et al., 2007). An international sTfR certified reference material is now available from WHO through the United Kingdom National Institute of Biological Standards and Control [sTfR (NIBSC RR 07/202)]. Development of this certified reference material will enable different laboratories to calibrate their own assays, facilitating comparisons across countries (Thorpe et al., 2010).17.10 Multiple biomarkers
The use of several concurrent biomarkers of iron status provides a more valid assessment of iron status than measurement of any single biomarker. Such an approach minimizes the misclassification that can occur due to the overlapping of normal and abnormal values when a single measure is used.Iron status | Sustainable bone marrow iron | Serum ferritin | Transferrin saturation | Erythrocyte proto- porphyrin | Serum transferrin receptor | Hemo- globin |
---|---|---|---|---|---|---|
Iron-deficiency anemia | Absent | Low | Low | High | High | Low |
Iron-deficient erythropoiesis | Absent | Low | Low | High | High | Normal |
Iron depletion | Absent | Low | Normal | Normal | Normal | Normal |
Normal iron status | Normal | Normal | Normal | Normal | Normal | Normal |
Iron overload | Normal or increased | High | High | Normal | Normal | Normal |
Population group | ||
---|---|---|
< 5y of age | ≥ 5y of age | |
Erythrocyte protoporphyrin | ||
Iron overload | Normal | Normal |
Normal iron status | Normal | Normal |
Iron depletion | Normal | Normal |
Iron deficiency with or without anemia | > 70g/dL RBC | > 80µg/dL RBC |
> 2.6µg/g Hb | > 3.0µg/g Hb | |
> 61mmol/mol heme | > 70mmol/mol heme | |
Serum ferritin, µg/L | ||
Severe risk of iron overload | No cutoff | > 200 (adult males) > 150 (adult females) |
Depleted iron stores | < 12 | < 15 |
Transferrin saturation | ||
Iron overload | > 60‑70% | |
Iron deficiency anemia | < 16% |
Ferritin model — characteristics |
---|
Does not indicate degree of severity of iron deficiency |
May assess slightly later stage of iron deficiency than the presence or absence of bone marrow iron stores (i.e., lower prevalence than serum ferritin alone) |
May detect iron deficient erythropoiesis in addition to iron store depletion |
Produces categorical yes/no estimate only |
Total body iron model — characteristics |
Assesses entire range of iron status |
Derived from direct calculation of body iron from serial phlebotomy, a “gold standard” method to assess body iron |
Better predicts the absence of bone marrow iron than serum ferritin alone |
May provide a better estimate of the impact of iron intervention (amount of iron absorbed) |
Total body iron can be analyzed as a continuous variable |
Percentage of serum ferritin values below thresholda |
Percentage of transferrin receptor values above thresholdb | Interpretation |
---|---|---|
< 20%c | < 10% | Iron deficiency is not prevalent. |
< 20%c | ≥ 10% | Iron deficiency is prevalent; inflammation is prevalent. |
≥ 20%d | ≥ 10% | Iron deficiency is prevalent. |
≥ 20%d | < 10% | Iron depletion is prevalent. |
17.10.1 Use of ratios of sTfR to serum ferritin as indicators of iron status
Increasingly, the ratio of sTfR to serum ferritin is being used as an indicator of the extent of iron deficiency. Serum ferritin, as noted in Section 17.7, is a sensitive indicator until body iron stores (mainly in hepatocytes) are depleted, but once stores are totally exhausted (i.e., with serum ferritin < 12g/L), serum ferritin does not provide information on the severity of the iron deficiency. In contrast, serum sTfR is a sensitive indicator after body iron stores are exhausted, with concentrations progressively increasing as iron deficiency advances. Hence, in combination, these two biomarkers assess the full range of iron status from severe deficiency to overload. Moreover, when expressed as a ratio, they correct for any plasma volume expansion differences during pregnancy, thus providing a more accurate reflection of iron status at this time. Nevertheless, the practical utility of the sTfR/ ferritin ratios in serum for detecting iron deficiency in the presence of inflammation is still uncertain (Lynch et al., 2018). Several approaches exist to express and to interpret this ratio, each with different cutoff values to interpret the ratio; these approaches and cutoff values are shown in Table 17.37, and discussed below.Ratio | Calculation | sTfR assay used to establish ratio | Cutoff value and definition |
---|---|---|---|
Total body iron,2 mg/kg | −[log(sTfR/SF) −2.28229]/0.1207 |
In-house ELISA that is equivalent to Ramco assay and has known relation to Roche assay |
≤ 0: iron deficit > 0: iron surplus |
Simple ratio2 | sTfR/SF |
In-house ELISA that is equivalent to Ramco assay and has known relation to Roche assay |
≤ 500: ample iron stores > 500: depleted iron stores |
sTfR index, mg/L | sTfR/log10SF | First ELISA from R&D Systems; then adopted on Access Beckman Coulter Counter |
< 1: ACD;
> 2: IDA or IDA + ACD |
Box 17.5: Advantages of using total body iron (TBI) (as µg/kg)
as a measure of iron status
This formula was validated by Cook et al.
(2003)
using data
from three published studies. Note this model is based on
serum sTfR concentrations using an in-house ELISA assay
(Flowers et al., 1986),
shown later by Pfeiffer et al.
(2007)
to be equivalent to the Ramco sTfR assay. The Ramco
assay was later reported to measure ≈ 30% higher than the fully
automated sTfR immunoturbimetric assay developed by
Roche Diagnostics and used in the U.S. NHANES III survey
to measure body iron
(Cogswell et al., 2009).
Consequently, Pfeiffer et al.
(2007)
developed a
regression equation to convert serum sTfR concentrations
assayed using the fully automated ROCHE assay to Flower's
sTfR concentrations:
\[\small \mbox{Flower's sTfR}= \mbox{1.5 × Roche'sTfR + 0.35(mg/L)} \]
Note this body iron equation cannot be used directly when
other sTfR assays are used.
Factors that led to the decision to apply the body iron model to NHANES data
are itemized in Box 17.5.
Figure 17.17
depicts TBI, expressed as the prevalence
of low iron stores for the first, second, and third trimester
in U.S. pregnant women
from U.S. NHANES 1990‑2006 survey.
In this study, the sTfR concentrations for each trimester were
adjusted to be comparable with values produced by the
Flowers sTfR assay used in the development of the TBI
model, by using the regression equation shown above.
Results confirmed that iron deficiency
based on TBI < 0mg/kg was more prevalent
in pregnant women in the second or third trimester, and in
non-Hispanic black pregnant women (data not shown).
Moreover, the prevalence and pattern, by trimester
and by race / ethnic group (data not shown) of
iron deficiency based on sTfR and TBI were similar.
Note that these results did not take inflammation and
infection into account, even though pregnancy is
considered an inflammatory state. However, after
adjusting the prevalence of iron deficiency based on TBI for
inflammation by excluding those with elevated CRP
concentrations (i.e., > 5mg/L), the prevalence of iron deficiency after
exclusion was not substantially different, suggesting that
the effect of inflammation on the prevalence of iron deficiency in these
U.S. women during pregnancy was small
(Table 17.38).
Nevertheless, several uncertainties remain when using
TBI to define iron deficiency. As an example, whether
the equation for estimating total body iron is appropriate
for young children and pregnant women is unclear. The
equation was validated only in non-pregnant adults
(Cook et al., 2003),
and the relationship between TBI
and serum ferritin and sTfR concentrations may differ in
these life-stage groups. Furthermore, the changes in
serum ferritin and sTfR that occur during more gradual
reduction in body iron stores may not resemble those
observed during the relatively rapid reduction in body iron
stores with phlebotomy
(Mei et al., 2017).
- Independent from Hb, thereby shifting the focus from screening and prevention of anemia to iron deficiency
- Fewer laboratory measurements required compared to the ferritin model
- Provides an estimation of entire distribution of iron stores based on body weight
- Assay methods for the calculation of TBI are readily automated
- Adequate agreement between prevalence of iron deficiency based on TBI and ferritin model in preschool children and women of childbearing age in the U.S. NHANES 2003‑2006
- Positive values of TBI represent iron stores and negative values represent tissue iron deficiency
- Suggested cutoff for defining iron deficiency is < 0mg/kg. However, no cutoffs exist for iron replete and excess.
Trimester | n | High sTfR (> 4.4mg/L) | TBI (< 0mg/kg) |
---|---|---|---|
First | 189 | 5.8 (2.4, 9.2) | 6.9 (2.6, 11.2) |
Second | 416 | 10.6 (6.3, 14.9) | 14.3 (10.2, 18.5) |
Third | 384 | 27.9 (20.6, 35.3) | 29.7 (24.4, 34.9) |
17.11 Emerging iron status indicators
Emerging indicators, currently mainly used in a research setting, include hepcidin, non-transferrin-bound iron, and some reticulocyte indices. More work is required to understand the diagnostic value of these emerging indicators before they become more widely available for public health or clinical use.17.11.1 Hepcidin
Hepcidin is a protein encoded by the HAMP gene. It plays a major role in controlling physiological iron homeostasis, as noted earlier. Hepcidin binds and subsequently causes degradation of the iron-exporter ferroportin, thereby inhibiting both absorption of dietary iron from the gastrointestinal tract and the release of iron from body stores (Section 17.1.2). In conditions of iron depletion or increased iron demand, hepatic synthesis of hepcidin is reduced, thus facilitating iron absorption and mobilization from body stores via active ferroportin. In contrast when iron stores are replete (or in renal impairment when excretion of hepcidin is suppressed), hepcidin levels are increased which block the release of iron into the circulation. Instead, iron is lost with the cell when it is shed from the villus. Hepcidin production by the liver is also regulated by inflammation and erythropoietic activity. Hepcidin may be useful in the clinical diagnosis of iron-refractory anemia (i.e. the type of iron deficiency anemia that typically does not improve with oral iron treatment), in differentiating between iron deficiency anemia and anemia of chronic disease and in patients with iron overload syndromes. As hepcidin is a determinant of dietary iron absorption, hepcidin may also provide guidance on safe iron supplementation in countries with a high infection burden (van der Vorm et al., 2016; Pfeiffer and Looker, 2017). Studies have also investigated the diagnostic potential of serum hepcidin as an index of iron deficiency in pregnancy (Bah et al., 2017). Nevertheless, whether hepcidin assays provide an advantage over serum ferritin and the other more common methods for assessing nutritional iron status, particularly when iron status is replete, remains uncertain (Pfeiffer and Looker, 2017; Lynch et al., 2018). Inflammation raises levels of pro-inflammatory cytokines in the systemic circulation, which in turn increase serum hepcidin levels, an acute-phase protein, just like serum ferritin. Elevated hepcidin levels reduce both iron intestinal absorption and the release of iron from body stores, thus decreasing the amount of circulating serum iron and thereby limiting erythropoiesis. Hence, the risk of iron deficiency increases, even though body iron stores are normal. Obesity is associated with low grade inflammation and thus elevated hepcidin levels. Results presented in Table 17.39Normal Weight Women (BMI: 18.5‑24.9 kg/m2) |
Obese Women (BMI: >29.9 kg/m2) | p Value | |
---|---|---|---|
Variable | Mean ± SD | Mean ± SD | |
Inflammatory markers | |||
WBC (×103µL) | 5.6 ± 1.6 | 7.7 ± 2.0 | < 0.001 |
IL-6 (pg/mL) 1* | 1.46 [1.13, 1.89] | 2.16 [1.86, 2.51] | 0.003 |
CRP (mg/L) 1* | 8.2 [3.1, 21.8] | 69.9 [41.1, 118.9] | < 0.001 |
Iron biomarkers | |||
Hb (g/dL) | 13.6 ± 1.1 | 13.3 ± 1.1 | 0.166 |
MCV (fL) | 86.3 ± 4.5 | 82.4 ± 8.9 | 0.030 |
Serum iron (µg/dL) 2 | 112.0 ± 41.4 | 92.4 ± 33.9 | 0.044 |
TIBC (µg/dL) 2 | 394.4 ± 61.5 | 371.3 ± 50.4 | 0.086 |
TSAT (%) 2 | 29.7 ± 13.3 | 25.2 ± 9.1 | 0.094 |
Ferritin (ng/mL) 1* | 34.0 [21.0, 55.1] | 37.7 [26.9, 52.9] | 0.355 |
Hepcidin (ng/mL) 1 | 6.21 [4.39, 8.77] | 11.21 [7.04, 17.83] | 0.024 |
Parameter | Severe (n=28; 17 female) | Moderate (n=41; 25 female) | P | Local controls (n=25) |
---|---|---|---|---|
Hb, g/dL* | 5.8 (4.4‑7.6) | 6.4 (4.9‑8.3) | .1397 | 15.0 (14.5, 15.5)‡ |
Ferritin, mg/L** | 1356 (328, 9790) | 732 (143, 3260) | .0021† | 48.2 (38, 61.2)‡ |
Liver iron, mg/g dwt** | 11.3 (1, 54.2) | 5.30 (0.7, 29.0) | .0006† | |
NTBI, µM/L* | 5.16 (−1.67, 10.27) | 4.36 (−2.67, 23.75) | .4456 | |
Hepcidin, ng/mL** | 2.24 (0.1, 51.8) | 1.95 (0.1, 36.3) | .7441 | 28.23 (18.83, 42.3)‡ |
sTfR, nM/L** | 6.51 (1, 35.3) | 8.87 (1.4, 35.3) | .1472 | |
CRP, mg/L** | 1.66 (0.23, 34.23) | 1.58 (0.20, 13.01) | .8433 | |
Labile plasma iron, µM/L* | 3.60 (0.1, 7.7) | 4.29 (−1.07, 13.61) | .9320 | |
Transferrin SAT, %* | 97.3 (48.3, 100.0) | 86.6 (31.9, 100.0) | .0319† |