
Whiting SJ, Gibson RS. Principles of
Nutritional Assessment:
Calcium
3rd Edition, August 2024
Abstract
Calcium is known for being a major constituent of bones and teeth. About 99% of the body's calcium is found in these hard tissues. Calcium is also an extracellular divalent cation in the blood, where it exerts functional roles such as cell signaling and membrane transport. Its concentration in blood is tightly regulated by many hormones including parathyroid hormone (PTH), calcitriol, and calcitonin. Blood levels of calcium are not useful in determining the nutritional status of calcium because of these hormonal influences. Dietary requirements for calcium are derived using calcium balance, which is negative when calcium intake is too low to maintain normal bone density and zero in adults when calcium intake is sufficient or positive during growth and pregnancy. Calcium balance can be estimated using dual-absorptiometry (DXA) or measuring urine and fecal losses. A calcium intake above requirement does not stimulate further increases in bone mass; instead excess intake can lead to adverse effects such as soft tissue calcification and kidney stone formation. When calcium intakes are low, and/or when vitamin D is inadequate to permit sufficient calcium absorption, bone health is impaired leading to rickets in children and osteomalacia or osteoporosis in adults. Other health benefits of calcium are under investigation.
CITE AS: Whiting SJ, Gibson RS. Principles of Nutritional Assessment: Calcium
https://nutritionalassessment.org/ calcium/
Susan Whiting (sjw084@mail.usask.ca)
Licensed under CC-BY-4.0
( PDF )
23a.1 Calcium
Calcium is the most abundant mineral in the body, accounting for 10–20g per kg body weight in adults. Bone is the main reservoir for calcium. The remainder is located in body tissues (10g), blood, and the extracellular fluids (900mg). In contrast, a greater proportion of the distribution of phosphorus and magnesium, the other two bone minerals, is located in soft tissue (Table 23a.1).| Element | Mass (g) | Percentage in the skeleton | Percentage in tissue |
|---|---|---|---|
| Calcium (Ca) | 1200 | 99 | 1 |
| Magnesium (Mg) | 24 | 55 | 40 |
| Phosphorus (P) | 900 | 80 | 12 |
23a.2 Functions of calcium
Calcium has a structural role in bones and teeth, where 99% of the body's calcium exists primarily as calcium hydroxyapatite [Ca10(PO4)6(OH)2]. Bone is a dynamic tissue that undergoes remodeling throughout life except for the teeth. Bone formation is under the control of osteoblasts, the bone forming cells, whereas bone resorption is initiated by osteoclasts, the bone resorbing cells. During growth, bone formation exceeds resorption as bone modeling is predominant. In later life when only bone remodeling takes place, bone resorption begins to occur at a faster rate than bone formation and this results in age-related bone loss (Siddiqui and Partridget, 2016).The remaining 1% of total body calcium is in the soft tissues where it has a regulatory role in several metabolic processes, including enzyme activation, vascular contraction and vasodilation, muscle contractibility, nerve transmission, hormone function, and membrane transport. When the levels of absorbed calcium from the diet are insufficient to balance the obligatory fecal and urinary losses, calcium is drawn from the bone and blood calcium levels are maintained within narrow limits. This homeostatic regulation of the calcium level in the blood is achieved by the interaction of the parathyroid hormone (PTH), 1,25‑dihydroxyvitamin D (1,25(OH)2D), and calcitonin, the three major calcium-regulating hormones (Peacock, 2010). Phosphorus, protein, estrogen, and other hormones, including glucocorticoids, thyroid hormones, growth hormone, and insulin also have a role (Siddiqui and Partridget, 2016).
23a.3 Absorption and metabolism of calcium
Calcium balance refers to the state of the calcium body stores (in bone) which are a function of dietary intake, intestinal absorption, renal excretion, and bone remodeling. A major control of calcium balance is the amount of calcium absorbed. Calcium is absorbed across the intestinal mucosa in two ways: active transport and passive para-cellular diffusion. Active absorption of calcium is influenced by calcium and vitamin D status of the individual, age, pregnancy, and lactation. Active absorption occurs when intakes of calcium are low relative to need, and is regulated primarily via 1,25(OH)2D and its intestinal receptors. Passive absorption is more important at high intakes of calcium (Weaver and Peacock, 2019).Efficiency of calcium absorption is highest when dietary calcium intakes are low or during periods of rapid growth in infancy, early childhood, and adolescence, and during pregnancy and lactation. Indeed, absorption is very high during infancy (about 60%) (Abrams et al., 1997) and about 34% during puberty (Abrams and Stuff, 1994), stabilizing at about 25–30% in young adults. Subsequently, the intestinal absorption of calcium decreases progressively with age (Christakos et al., 2011).
Urinary calcium excretion is also regulated in response to need. Normally calcium re-absorption in the kidney nephrons is not 100%. When there is hypocalcemia to stimulate PTH release, one action of PTH is to increase efficiency of calcium re-absorption thus reducing calcium losses in urine (Peacock, 2010). Several dietary variables affect both calcium absorption and retention and, hence, calcium status. Diets high in protein increase the urinary excretion of calcium (hypercalciuria), which, however, is compensated by increased calcium absorption (Mangano et al., 2014). Dietary sodium also influences urinary calcium losses, with high sodium intakes increasing urinary calcium losses (Bedford and Barr, 2011), and lowering bone density in women (Devine et al., 1995). Caffeine, like protein and sodium, also increases urinary calcium loss but has only a small negative effect on calcium retention, which can be offset by increasing dietary calcium intakes (Barrett-Connor et al., 1994).
High phosphorus intakes reduce urinary calcium losses (i.e., have a hypocalciuric effect), but because they increase losses of endogenous fecal calcium at the same time (Heaney and Recker, 1994), their net effect on calcium balance is still under debate. One might assume that there would be no effect except in conditions in which the coordination between calcium and phosphate homeostasis occurs through the actions of PTH, FGF‑23 and 1,25(OH)2D. The disruption of this coordination, however, can occur with disease states such as chronic kidney disease (CKD) (Peacock, 2010). However, increasing dietary phosphorus through inorganic phosphate additives may have detrimental effects on bone and mineral metabolism in humans and animals (Vorland et al., 2017).
Phytates and oxalates can inhibit the absorption of calcium by forming insoluble calcium complexes in the gastrointestinal tract (Barger‑Lux et al., 1995). Hence, they may have a negative effect on calcium status, although their overall effect may be small unless dietary calcium intakes are low. Some other dietary components, including lactose and inulin, enhance passive calcium absorption by increasing calcium solubility in the ileum (Weaver et al., 2016).
Several clinical conditions are associated with disturbances in calcium absorption. Calcium malabsorption is associated with gastrointestinal diseases such as Crohn's and celiac disease, and intestinal resection or bypass. Intestinal absorption of calcium is also impaired in patients with renal failure, caused by the reduced synthesis of 1,25‑dihydroxyvitamin D (Peacock, 2010). Excessive intestinal absorption of calcium and hypercalcemia occur in sarcoidosis, when excessive calcitriol appears in serum, and also in vitamin D intoxication.
23a.4 Dietary sources and intakes of calcium
Calcium is not widely distributed in all food groups, as shown in Table 23a.2.| Food | Serving size | Calcium Content (mg) | Estimated Absorp- tion % | Net Ca* Absor- bed (mg) |
|---|---|---|---|---|
| Cow milk (fluid) | 250mL | 310 | 32 | 100 |
| White beans (cooked) | 125mL | 85 | 22 | 18 |
| Red beans (cooked) | 125mL | 26 | 24 | 6 |
| Whole wheat bread | 35g slice | 26 | 82 | 21 |
| Broccoli (cooked) | 125mL | 33 | 20 | 20 |
| Spinach (cooked) | 125mL | 129 | 5 | 7 |
| Almonds (raw, roasted) | 60mL | 97 | 21 | 21 |
| Tofu (set with CaSO4) | 85g | 171 | 31 | 53 |
| Soy “milk” (unfortified) | 125mL | 5 | 31 | 2 |
Preparation of foods may also be a factor influencing their calcium content. For example, in Guatemala, when corn (maize) tortillas are prepared according to the Mayan tradition of cooking corn with limestone and leaving it to soak overnight in hot water, the calcium content rises from about 10mg to about 200mg of calcium per 100g (Belizan and Villar, 1980). In Sub-Saharan Africa, dietary calcium intake may be increased by using powdered eggshell added to foods (Bartter et al., 2018).
Foods fortified with calcium are available in many countries. In the European Union, the following forms of calcium are authorized for addition to foods and for use in food supplements: carbonate, chloride, citrate malate, gluconate, glycerophosphate, lactate, hydroxide, oxide, acetate, L‑ascorbate, bisglycinate, salts of citric acid, pyruvate, salts of orthophosphoric acid, succinate, L‑lysinate, malate, L‑pidolate, L‑threonate, sulphate (EFSA, 2012). Most of these forms are allowable in other countries. The citrate malate calcium salt is an allowable fortificant for orange juice in the United States (ODS, 2020). The United Kingdom is the only country where calcium fortification is a mandatory addition to flour; 235–390mg of calcium carbonate are added per 100g of flour. This represents about 94–156mg of elemental calcium per 100g of flour (Cormick et al., 2020). Other countries permit calcium addition to certain foods, often proprietary packaged foods, a practice called discretionary fortification.
Supplemental sources of calcium are widely available in many dosages and in a variety of chemical forms in many countries. These pills, capsules and liquids are usually regulated by the government. For example, in the United States, the following forms of calcium are allowable as supplements: carbonate, phosphate, citrate, gluconate, and lactate (Weaver and Peacock, 2019; ODS, 2020). Some supplements that are derived from oyster shell, algae, and in chewable drugs labeled as antacid such as TUMSTM, are mainly in the form of calcium carbonate, the form of calcium naturally occurring in rocks such as chalk and limestone. This form of calcium is generally the cheapest to buy and has the highest amount of calcium by weight (40%). However, calcium carbonate is poorly absorbed unless stomach acid is available for dissociation. Also, calcium carbonate is the form of calcium that causes the most side-effects such as bloating and constipation (ODS, 2020).
Dietary calcium intakes vary across countries, ranging from 175–1233mg/d (Balk et al., 2017). Countries in Asia have average dietary calcium intakes less than 500mg/d while in countries in Africa and South America, calcium intakes vary from 400–700mg/d. Only Northern European countries have a national calcium intake greater than 1000mg/d, reflecting a high dairy consumption. The average calcium intake is generally lower in women than men, although across the 74 countries included in an analysis by the International Osteoporosis Foundation (IOF, 2020), no clear patterns regarding differences by age, sex, or socioeconomic status emerged.
23a.5 Nutrient reference values for calcium
New EAR, RDA and UL levels for calcium were published by the Institute of Medicine in 2011, as shown in Table 23a.3.| Dietary Reference Intakes Ca (mg/d) IOM (2011) | |||
|---|---|---|---|
| Age/sex groups | EAR | RDA | UL |
| 0–6 mo | – | 200 (AI) | 1000 |
| 6–12 mo | – | 260 (AI) | 1500 |
| 1–3y F & M | 500 | 700 | 2500 |
| 4–8y F & M | 800 | 1000 | 2500 |
| 9–18y F* & M | 1100 | 1300 | 3000 |
| 19–50y F* & M | 800 | 1000 | 2500 |
| 51–70y F | 1000 | 1200 | 2000 |
| 51–70y M | 800 | 1000 | 2000 |
| 71+y M & F | 1000 | 1200 | 2000 |
| World Health Organization (2018) | |||
| Pregnancy | 1500 | ||
The IOM Upper Level (UL) for calcium for infants 0–1y was derived from feeding data that indicated no adverse effects on calcium excretion when calcium intakes as high as 1000–1500mg were provided. For all other age groups, the UL for calcium (Table 23a.3) was based on data related to the incidence of kidney stones, largely from the research conducted with post-menopausal women in trials where calcium supplements were provided. In contrast, the European Food Safety Authority (EFSA, 2012) retained their calcium UL of 2500mg for adults, including pregnant and lactating women, on the basis that the new data did not alter their previous adult UL estimates. Further, EFSA was not convinced there were sufficient data to set a UL for infants, children, or adolescents.
23a.6 Calcium deficiency
23a.6.1 Hormonal responses to calcium deficiency
Calcium homeostasis is under systemic (i.e., hormonal) control together with additional local regulating factors through intestinal absorption, influx and efflux from bone, and calcium excretion and re-absorption by the kidney. Serum calcium concentrations must be kept constant at approximately 2.5mmol/L, a concentration that is controlled by the interrelated action of three hormones: parathyroid hormone (PTH), 1,25(OH)2D, and calcitonin. The first two hormones determine how much calcium is retained in the body through control of absorption, bone turnover, and renal excretion. Calcitonin has a role in how calcium moves between the extracellular fluid and bone (EFSA, 2012). Fasting, which represents acute calcium deficiency, causes a decrease in serum calcium concentrations, inducing the release of PTH via the calcium-sensing receptor (CaSR) located on the cell surface of the parathyroid glands (EFSA, 2012). In hypocalcemia, PTH has three actions which together bring serum calcium levels back to normal. The immediate response is bone resorption to release calcium into the blood. The second response is to increase renal re-absorption of calcium in kidney tubules in order to retain calcium. Finally, PTH stimulates 1,25(OH)2D synthesis in the kidney (Figure 23a.1)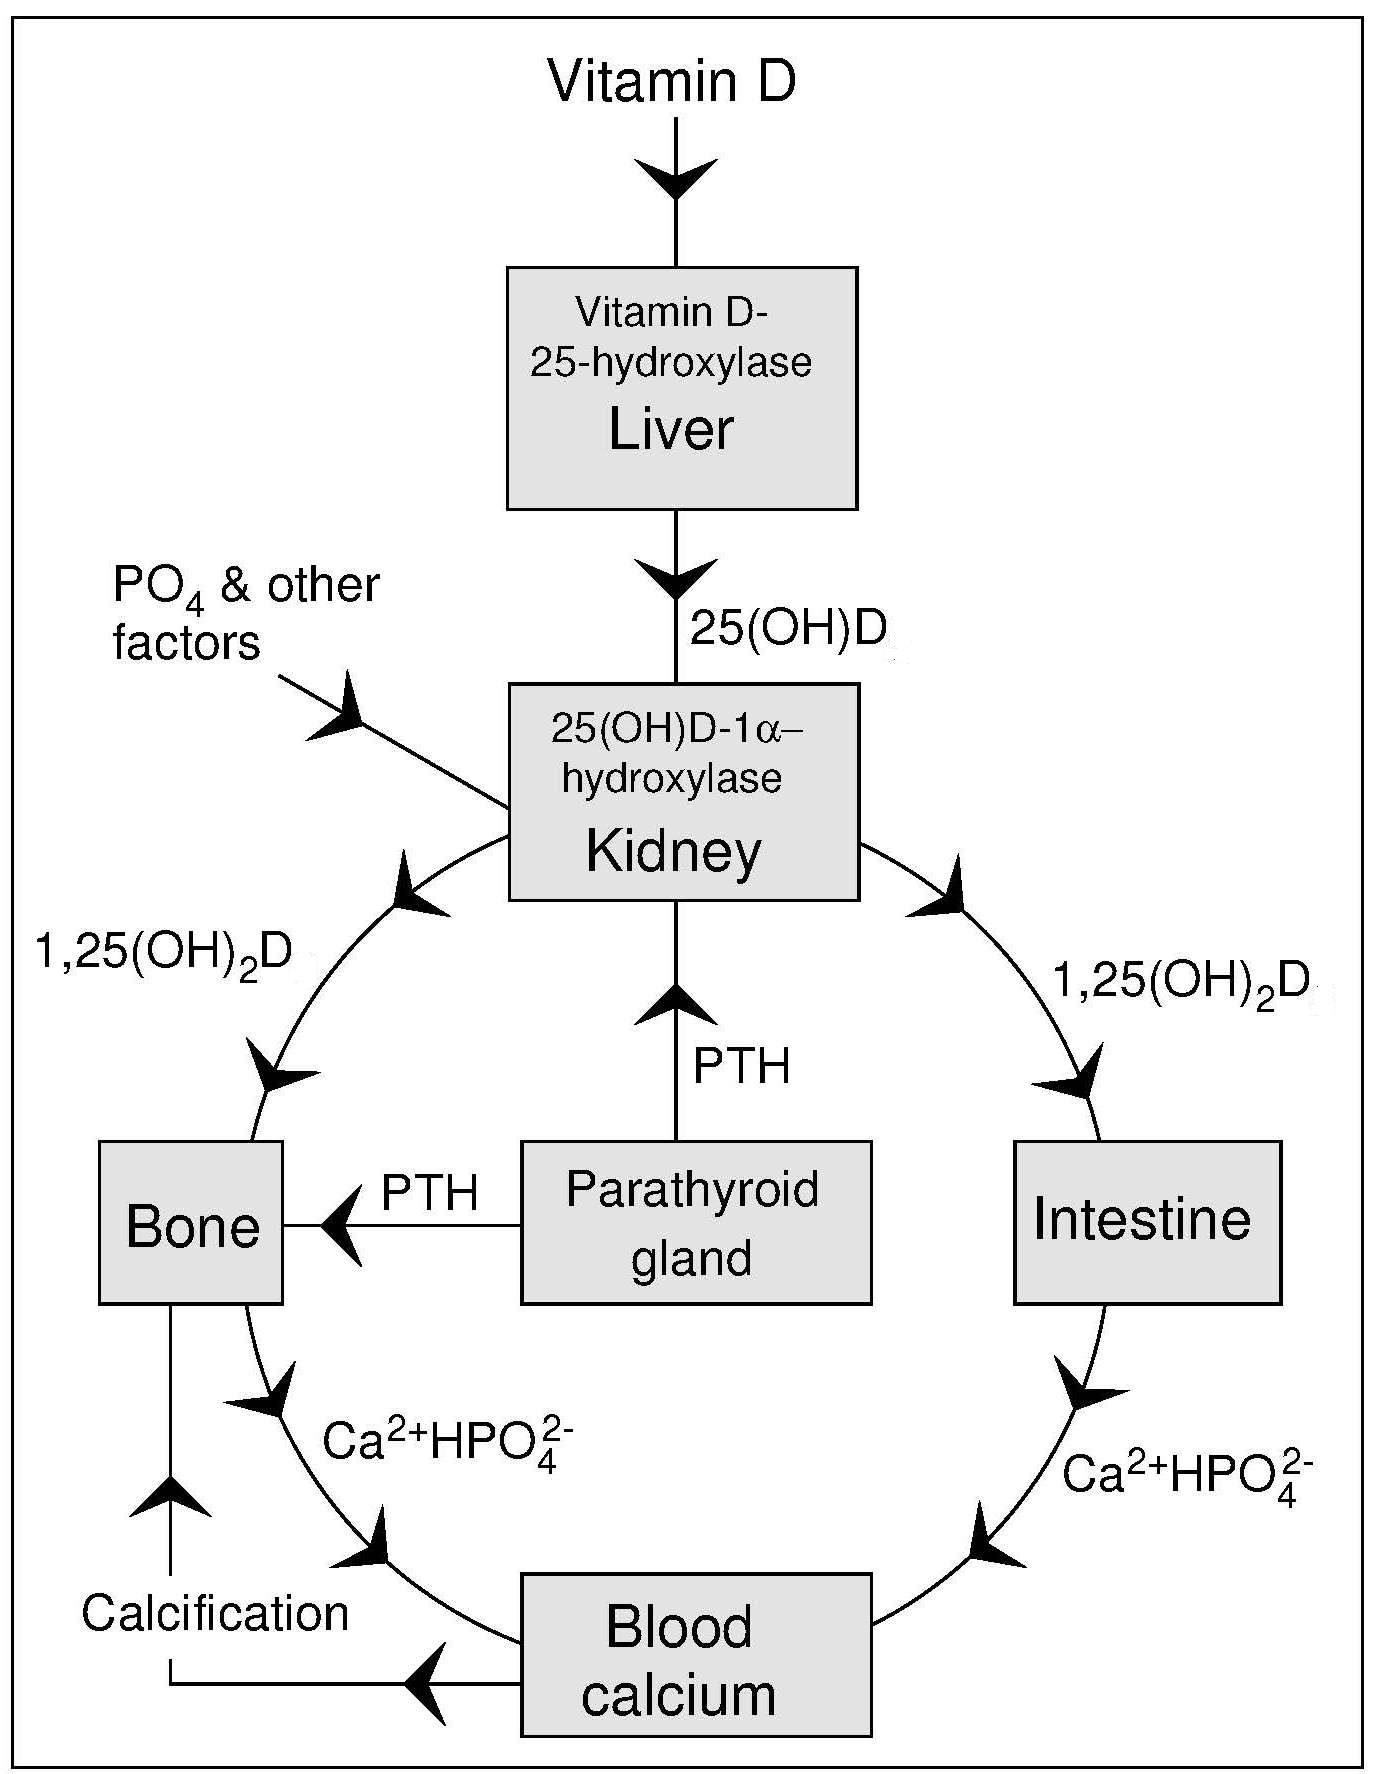
23a.6.2 Bone health
Chronic calcium deficiency, arising from an habitually inadequate intake or poor absorption of calcium, is one of the many important factors associated with reduced bone mass. Bone mass in later life depends on the peak bone mass achieved during growth and the rate of the subsequent age-related bone loss. The age span over which peak bone mass is achieved is between the early teenage years and age 30, during which time 95% of bone mass is achieved. By 30y further gains are unlikely (Weaver et al., 2016), although exact timing varies with the skeletal site and sex. Optimization of bone mass is important because it reduces the risk of osteoporosis in later life.Calcium intake and its association with bone health has been the subject of intense debate as epidemiological studies have not always found a consistent relationship between calcium intake and bone density. One reason is that calcium is a threshold nutrient so that when present in sufficient amounts, a higher calcium intake does not result in any further improvement in bone mineral accrual (Heaney, 2007). In most countries the Nutrient Reference Values (NRVs) have been set for maintenance of bone health. For example, in the United States and Canada, the Estimated Average Requirement (EAR) and Recommended Dietary Allowance (RDA) for calcium for all ages is based on maintaining a positive calcium balance in children and preventing a negative calcium balance in adults (IOM, 2011); more details are described below.
Calcium-deficiency rickets and osteomalacia occur in many parts of the world. Case reports from the United States, South Africa, and Nigeria have described infants and children with radiological rickets, growth retardation, and biochemical signs of hyperparathyroidism but with normal vitamin D status. In all these cases of rickets, habitual calcium intakes were low but phosphorus intakes were adequate or high. Moreover, the children in South Africa responded to calcium-rich hospital diets (Thandrayon and Pettifor, 2018), whereas the Nigerian children responded more to calcium or a combination of calcium and vitamin D, and not to vitamin D alone (Thacher et al., 1999). Children with severe acute malnutrition experience hypocalcemia and many have accompanying rickets (Smilie et al., 2020).
Osteopenia and osteoporosis are conditions characterized by a reduced bone mass. In osteopenia, the T‑score is low, at −1. In osteoporosis, reduction in bone mass is greater, i.e., the T‑score is −2 and there is increased bone fragility and risk of fracture. The T‑score is a relative rating expressed in standard deviation units describing the bone mineral density (BMD) measured at the spine, hip, or forearm. A T‑score is similar to a Z‑score except it is not measured against a same age person but rather against a young adult with normal BMD. Measurement is done using a variety of methods described in Section 23a.9. Osteoporosis diagnosis, according to the International Osteoporosis Foundation, (IOF), is done most often using BMD tests. For example, there is a Fracture Risk Assessment Tool for physicians to use with patients of both sexes called FRAX®. It is a web-based calculator to assess the ten-year risk of osteoporosis fracture based on specific individual risk factors, with or without BMD values (Kanis et al., 2018). There are separate country models for more than 60 individual countries, and it is available in more than 30 languages. The IOF supports the maintenance, development, and education about the use of FRAX® worldwide. The factors used in FRAX® to predict 10y fracture risk are listed in Table 23a.4.
| Risk factors | Risk factors used in FRAX®
to predict 10y fracture risk |
|---|---|
| Age | Increasing risk 40–90y |
| Sex | Female is risk factor |
| Weight and height | Low BMI is risk factor |
| Previous fracture | Previous fracture as adult is risk factor |
| Parent fractured hip | Indicates genetic risk |
| Smoking | Current use of tobacco is risk factor |
| Glucocorticoids | ≥ 3mos prednisolone (≥ 5mg daily or equivalent) is a risk factor |
| Rheumatoid arthritis | Confirmed diagnosis of rheumatoid arthritis is a risk factor |
| Secondary causes of osteoporosis |
Type I diabetes, adult osteogenesis imperfecta, untreated hyperthyroid- ism, hypogonadism or premature menopause, chronic malnutrition, malabsorption, chronic liver disease |
| Alcohol | ≥ 3 or more units of alcohol daily is a risk factor |
| Bone mineral density (BMD) | Risk increases with decreased femoral neck BMD (in g/cm2). |
Dietary patterns and lifestyle factors such as sex, body composition, genetics, and physical activity contribute to bone health (Weaver et al., 2016). Dietary factors include high intakes of protein and phosphorus (both as positive and negative influences) and suboptimal intakes of vitamin D as well as other micronutrients including vitamin K, vitamin C, magnesium, and zinc. These micronutrients are related to calcium metabolism and/or bone or connective tissue metabolism. However, based on a recent systematic review, the Level of Evidence was designated as “Inadequate Evidence” of the benefit of micronutrients (with the exception of calcium and vitamin D) on bone during acquisition of peak bone mass (Weaver et al., 2016). In examining dietary patterns, Moderate Evidence was found to support a beneficial role for dairy products on bone, whereas for dietary fiber and fruit and vegetable intake the evidence on bone was deemed “Limited”. Likewise, the evidence for a detrimental effect of cola and caffeinated beverages on bone acquisition was also designated as “Limited”. For bone loss in older adults, a Canadian study concluded that the “Prudent” dietary pattern consisting of fruit, vegetables, whole grains, fish, and legumes reduced bone turnover compared to the Western diet of soft drinks, potato chips, french fries, meats, and desserts (Langsetmo et al., 2016).
23a.6.3 Non-bone effects of calcium deficiency
Calcium deficiency has been implicated in effects on health that are not bone-related. These include: reduction in hypertensive disorders of pregnancy, reduction in high blood pressure, reduction in risk of colorectal adenomas, and improvements in blood cholesterol in those at risk (Cormick and Belizan, 2019). Further, calcium has been implicated in weight management (Illich et al., 2009). The evidence for or against these effects is presented below. None of these non-bone effects were used to set Nutrient Reference Values (NRVs), yet each provides additional reasons for being concerned about calcium adequacy. Blood pressure and calcium intake are inversely related in studies in humans as well as animal models, suggesting a role for calcium in maintaining normal blood pressure (Cormick and Belizan, 2019). Intracellular calcium regulates blood pressure in vascular smooth muscle cells, directly through vasoconstriction and indirectly through vascular volume control (Villa-Etchegoyen et al., 2019). Hypertensive disorders of pregnancy, particularly eclampsia and pre-eclampsia, are a significant cause of severe morbidity, long-term disability and death among both mothers and their babies (WHO, 2018). Using moderate-certainty evidence from intervention studies, WHO has made the following recommendation: In populations with low dietary calcium intake, daily calcium supplementation (1.5–2.0g oral elemental calcium) is recommended for pregnant women to reduce the risk of pre-eclampsia. Additional considerations included in this recommendation are that all of the calcium may be from foods, if possible; that the intake should be obtained in divided doses, not all at once; and that iron supplements should be taken at a different time from calcium supplements.Reduction in risk of colorectal adenomas with dietary calcium was first postulated in 1984, whereby in the presence of calcium ions, the toxic effects of free fatty acids on colon epithelial cells could be reduced by conversion to insoluble calcium soaps (Newmark et al., 1984). Since that time, numerous studies have refined this hypothesis, and protective effects have been noted in animal studies. A systematic review and meta-analysis of randomized controlled trials regarding calcium supplementation for the prevention of colorectal adenomas found a modest protective effect of calcium (1200–2000mg doses of supplemental calcium) in prevention of adenomas (Relative Risk (RR) = 0.89, 95% CI: 0.82–0.96) (Bonovas et al., 2016).
Blood cholesterol levels may be influenced by calcium intake. A systematic review reported that calcium supplementation reduced LDL cholesterol and increased HDL cholesterol through mechanisms involving suppression of calcium-regulating hormones (e.g., PTH) that subsequently reduced intracellular calcium in adipocytes, thus stimulating lipogenesis and lipid storage (Cormick and Belizan, 2019). However, as described below in Section 23a.7, excess calcium intake may be implicated in promoting cardiovascular disease. Hence, to date there is no conclusion regarding the role of calcium intake in reducing heart disease risk through cholesterol metabolism. Body weight control by calcium has been debated for many decades. The initial suggestion arose from the finding that dairy intake facilitated weight loss better than low calorie diets without dairy, an effect that was attributed to calcium (Zemel et al., 2005). A recent trial compared the effect of supplements and dairy-containing foods and concluded that consuming 4 to 5 servings of low-fat dairy foods per day or taking calcium and vitamin D supplements in persons with borderline dietary intakes of these two nutrients is beneficial for weight loss and/or maintenance of weight loss in postmenopausal women (Ilich et al., 2009).
23a.7 Effects of high intakes of calcium
There are several health concerns regarding excess calcium intake over long periods of time. The risk of renal stones, risk of cardiovascular disease, and inhibition of iron absorption are current concerns (Cormick and Belizan, 2019). Previously, recognition that high intakes of calcium caused calcification of soft tissue leading to “milk-alkali syndrome” (Whiting and Wood, 1995), was the rationale for setting the first Tolerable Upper Intake Level (UL) for calcium at 2500mg/d for all persons older than 1y, including pregnant and lactating women (IOM, 1997). More recently, the U.S. Food and Nutrition Board has set the Tolerable Upper Intake Level (UL) at 2000mg/d for adults over 50y due to reports of the increased incidence of kidney stones occurring in calcium supplementation trials (IOM, 2011). A higher UL is set for other age groups in the United States and Canada as the risk of stone occurrence in younger ages is much lower. The European Food Safety Authority (EFSA) however, as noted earlier, ruled that there was not sufficient data to change from the previous UL of 2500mg derived as the amount showing no adverse effects with chronic intake (EFSA, 2012).One concern that remains controversial is the effect of excess calcium on risk of cardiovascular disease (CVD). Many calcium trials were re‑analyzed for heart effects even though none were specifically designed to assess this effect. The most recent systematic review and meta-analysis of cohort studies and randomized controlled trials (Yang et al., 2020) found that calcium intake from dietary sources did not increase the risk of CVD including coronary heart disease (CHD) and stroke. However, there was evidence that calcium supplements might raise CHD risk, especially myocardial infarction. It should be noted that many of these trials provided subjects (most often older women) with daily calcium supplements of 1000–1500mg without measuring dietary calcium intakes or accounting for the habitual calcium supplement use by subjects. Hence, calcium intakes may have exceeded 2000mg/d, the UL level set for adults over 50y by the Institute of Medicine (IOM, 2011).
23a.8 Biochemical indices of calcium status
As calcium homeostasis is tightly regulated, there is no satisfactory single test to assess calcium status directly on a routine basis. Calcium is an important extracellular electrolyte (Ca++) and can be measured in serum or plasma. Normally values are reported as total calcium concentration, but ionized calcium can be an important measurement. Hypocalcemia and hypercalcemia (reduced and elevated serum calcium concentrations, respectively) are not likely to be caused by dietary intakes alone except on a transient basis. Urinary calcium excretion (calciuria) may give some clues as to calcium metabolism but as levels are equally likely to be from bone turnover or from dietary intakes, calciuria is difficult to interpret on its own. Instead, biochemical markers of bone formation and bone resorption are used as measures of calcium status as they reflect need for calcium (shown as excess bone resorption) and calcium adequacy (shown as appropriate bone formation) (Bonjour et al., 2014).23a.8.1 Serum calcium and its regulation
Serum calcium is not a test of nutritional status but rather reflects hormonal regulation of calcium, not calcium balance. Calcium is present in the blood in three different forms: as free Ca2+ ions, bound to protein (about 45%), and complexed to citrate, phosphate, sulfate and carbonate (about 10%). Calcium in the blood (and in extracellular fluid) is kept constant at 2.5mmol/L (range 2.25–2.6mmol/L), but it is ionized calcium (between 1.1–1.4mmol/L) that is the form that is actively transported across membranes (EFSA, 2012). Values decrease with age in men. Females usually have slightly lower concentrations (2.20–2.54mmol/L), associated with small differences in serum albumin content and the calcium-reducing effect of estrogens. Serum calcium decreases by 5–10% up to the end of the third trimester of pregnancy, after which concentrations rise. This decrease in total serum calcium may not be “true” hypocalcemia, as it is not due to a decrease in ionized calcium. However, changes in the serum chemistries and calcium-regulating hormones can be mistaken as a disorder of calcium (Almaghamsi et al., 2018).Hypocalcemia (low serum calcium) and hypercalcemia (elevated serum calcium) indicate serious disruption of calcium homeostasis but generally do not reflect calcium balance. In severe hypocalcemia, blood calcium is < 2.12mmol/L, and in severe hypercalcemia blood calcium is > 2.72mmol/L. Serum calcium levels must be corrected for the serum albumin concentration before confirming the diagnosis of hypercalcemia or hypocalcemia (Fong and Khan, 2012).
Hypocalcemia is most commonly a consequence of vitamin D inadequacy or hypoparathyroidism, or a resistance to either of these hormones. Hypocalcemia has also been associated with the use of certain drugs including bisphosphonates, cisplatin, antiepileptics, diuretics, and proton pump inhibitors. Symptoms of hypocalcemia may include muscle spasms, cramps, tetany, numbness, and seizures, but also can be asymptomatic (Fong and Khan, 2012). Hypocalcemia is common in the critically ill patient but the interpretation of the low serum calcium level is complicated by the co-existence of hypoalbuminemia and disorders of acid-base balance, thus in these patients hypocalcemia is defined in terms of ionized calcium concentration rather than total calcium concentration. Mechanisms causing hypocalcemia in critically ill patients include: hypoparathyroidism, severe vitamin D deficiency, hyperphosphatemia, infusion of chelating agents such as citrate, alkalosis caused by hyperventilation, and pancreatitis that causes a rise of free fatty acids (FFAs) that result in increased binding of calcium to albumin (Kelly and Levine, 2013).
Hypercalcemia occurs in association with hyperparathyroidism, hyperthyroidism, and sarcoidosis and when large parts of the body are immobilized (e.g., when a patient is hospitalized after spinal cord injury or major limb-bone fractures). In the latter cases, calcium from the rapidly atrophying bone is released into the circulating body fluids. In addition, hypercalcemia is one of the characteristic features of vitamin D intoxication. It arises from hyperabsorption of intestinal calcium and to a lesser degree from the release of calcium from bone (Peacock, 2010). Severe chronic hypercalcemia can result in nephrolithiasis (renal stones) and impairment of kidney function, as well as in calcification of soft tissues (e.g., nephrocalcinosis and vascular calcification), the latter when phosphorus concentrations in the blood are also high, as in renal insufficiency (EFSA, 2012).
Hypercalcemia may occur in advanced stages of the following cancers: multiple myeloma, breast cancer, parathyroid cancer, lung cancer, kidney cancer, lymphoma, leukemia, and bone metastases (Canadian Cancer Society, 2020). This hypercalcemia causes many unpleasant clinical symptoms such as vomiting, anorexia, constipation, frequent and increased urination, a patient may seek medical treatment at which time blood levels may be measured along with urinalysis and kidney function tests. Treatment would involve initially reducing hypercalcemia through fluid replacement followed by use of calcium-losing diuretics such as furosemide. As well, anti-resorptive medications such as bisphosphonates and denosumab, that reduce bone turnover, may be used to prevent calcium release from bone resorption.
23a.8.2 Measurement of serum calcium
Serum calcium levels have traditionally been determined by flame atomic absorption spectrophotometry (AAS) (Zettner and Seligson, 1964) or by automated procedures that use the o‑cresolphthalein complexone method (Bourke and Delaney, 1993). Earlier methods used flame photometry. For surveying the American population, the National Health and Nutrition Examination Survey (NHANES) uses a DxC800 system with ion-selective electrode methodology to measure calcium concentrations in serum, plasma, or urine. Only NHANES III provides ionized calcium values for the American population. Considerable differences in the quality of serum calcium measurements among laboratories may occur, emphasizing the necessity for rigorous quality-control practices. In general, the coefficient of variation for the AAS method is less than that for flame photometry (Linko et al., 1998). Analytical variation for serum calcium via AAS ranges from 0.9%–3.04% (Gallagher et al., 1989).As such a large amount of calcium in serum is bound to albumin, it follows that concentrations can be influenced by changes in serum albumin levels. As a result, when serum albumin levels are outside the normal limits (Iqbal et al., 1988), as may occur in liver disease or malnutrition, serum calcium values should be corrected, as noted earlier. The correction is approximate, and if there is uncertainty in the interpretation of the results, serum ionized calcium should be directly determined.
In many methods. serum rather than plasma should be used for calcium analysis as the former has no anticoagulant added. Most anticoagulants, with the notable exception of lithium heparin, interfere with the determination of calcium: they complex with or precipitate the calcium in the sample.
23a.8.3 Measurement of serum ionized calcium
Fasting blood samples are recommended for the measurement of ionized calcium in serum, to eliminate the effect of a recent meal. The samples should be stored anerobically at 0°C prior to the assay. Serum ionized calcium can be measured using commercially available ion-specific electrodes (Wandrup and Kvetny, 1985). Care must be taken to ensure that the calcium standards used for the assay contain sodium and chloride at the same levels as in the test samples. Further details on preparing blood for ionized calcium are published (Hamroun et al., 2020). Factors affecting serum ionized calcium levels include physical activity and circadian rhythm.Many clinicians estimate ionized calcium using formulas that “adjust” total calcium with albumin and/or protein levels, and sometimes including other blood constituents such as phosphate (Hamroun et al., 2020). There are over 30 published formulas, with the most widely used one being the Payne Formula: \[\small \mbox{Adjusted calcium (mmol/L) = }\] \[\small \mbox{ Total calcium (mmol/L) + 0.02 (40 − serum albumin (g/L))}\] However, caution is advised before applying this formula as it is not applicable in many situations.
The clinical utility of ionized calcium ranges from conditions with moderate evidence (drug-induced calcium disorders, cardiovascular outcomes), good evidence (post-thyroidectomy hypocalcemia), and very good to strong evidence (calcium disorders in critically ill patients, primary hyperparathyroidism, malignancy-related hypercalcemia). There is poor to fair evidence for use of ionized calcium in pre-eclampsia (Hamroun et al., 2020).
Interpretive criteria
The concentration of serum ionized calcium is tightly maintained within a physiologic range of 4.4–5.4mg/dl (1.10–1.35mmol/L) (Peacock, 2010). Reported levels of serum ionized calcium in adults vary. In NHANES III, mean age-adjusted serum ionized calcium values were presented for male and female non-Hispanic Caucasians, African Americans, and Mexican Americans for two age groups: 25–59y and 60–89y; the reported mean age-adjusted value for serum ionized calcium was 1.237mmol/L for males and 1.232mmol/L for females (Vargas et al., 1998). Mean age-adjusted values for African Americans were slightly higher.23a.8.4 Calcium balance
Calcium is lost daily through urinary and fecal excretion. In the gastrointestinal tract, calcium is lost through sloughing of cells as well as unabsorbed calcium in the feces. A small amount of calcium is lost in sweat. Replacement of these losses must occur through the diet (Weaver and Peacock, 2019). A zero calcium balance means all losses have been replaced, and there is no net bone loss to provide serum calcium during periods of fasting. A positive calcium balance indicates that losses are less than intake, and implies calcium accretion into bones, an expected finding during growth and during pregnancy. A negative calcium balance means losses exceed intake, and the additional calcium lost is from bone. Over time a negative calcium balance indicates bone formation is less than bone resorption. Table 23a.5| Ca Balance | Bone | Life Stage |
|---|---|---|
| Positive | Accretion Formation > Resorption | Childhood
Adolescence Pregnancy |
| Neutral (or zero) | Maintenance Formation = Resorption | Adults |
| Negative | Loss Formation < Resorption | Post-menopausal
Women Older Adults |
Measurement of calcium balance was a mainstay of nutrition research prior to the introduction of bone imaging equipment. These early experiments required facilities (metabolic units) where participants could receive all meals, sometimes for several months. A typical experimental protocol would adhere to the following steps:
- participants ingest the experimental diet for at least one week adaptation;
- in each 15d cycle participants would consume only those foods and beverages provided, and every day collect 24h urine samples;
- additionally participants would collect all feces along with consumption of a fecal marker during these 15d;
- study research personal prepare composites of food, urine, and feces representing each of three 5d cycles; and
- calcium was measured in the food and fecal composites after dry ashing to remove the organic material, followed by quantitative dilution, while urine was acidified to prevent precipitation of calcium (Anand and Linkswiler, 1974).
23a.8.5 Urinary calcium as a biomarker
The amount of urinary calcium excreted is highly variable as it is dependent on the diet and the efficiency of intestinal absorption. Under conditions of bone accretion, one expects less calcium to be excreted as bones are forming, while during bone loss, more excretion might be observed. Measure of 24h urine calcium may provide some indication of calcium intake as extremely low excretion rates may indicate low calcium intake. However, extremely high excretion rates, (i.e., hypercalciuria), may be indicative of bone loss or clinical conditions unrelated to dietary intake.For calcium balance, a 24h collection of urine is necessary to obtain the estimate of calcium excretion, yet this procedure requires enormous participant compliance. To gauge an indication of urinary calcium rate, some studies measure calcium in spot urine samples, usually after an overnight fast, when urinary calcium is expressed per mg or mmol of urinary creatinine. Using urinary creatinine in the denominator corrects for variability of urinary excretion as the amount of creatinine excreted in 24 hours is constant for individuals. Further, creatinine excretion can be used as an measure of muscle mass as it is made from creatine. Hence, when expressing urinary calcium excretion as a ratio of urinary creatinine excretion, one can equalize excretion between participants of dissimilar body mass. There is good correlation between excretion ratios of calcium expressed per mg or mmol of urinary creatinine in 24h urine collections and those based on spot urine collections (Ilich et al., 2009).
23a.8.6 Biomarkers of bone formation and resorption
Bone remodeling is an important process that continuously renews bone throughout life. It repairs micro-damage, maintains mineral homeostasis, and ensures mechanical proficiency by modifying the micro-architecture. Bone remodeling is regulated by a variety of systemic and local factors. Bone remodeling involves the following cycle of events: osteocyte signaling, recruitment of osteoclasts to begin resorption, degradation and removal of bone, reversal, formation of new bone by osteoblasts, and then a period of resting (Bonjour et al., 2014). Each of the stages in bone remodeling can produce molecules, most of which are protein-derived, that enter the plasma. These biochemical markers of bone remodeling (see Table 23a.6)| Bone Resorption (Osteoclast activity) |
|---|
Osteoclast number
|
Bone matrix absorption
|
| Bone Formation (Osteoblast activity) |
Osteoblast protein synthesis
|
Osteoblast activity
|
A description of the commonly used bone biomarkers shown in Table 23a.6 is outlined below. Of these, use of only two, namely P1NP (for formation) and CTX‑1 (for resorption) are recommended by the International Osteoporosis Foundation (IOF), and the International Federation of Clinical Chemistry (IFCC) because they are well characterized for use in fracture risk prediction and for monitoring osteoporosis treatment (Kim et al., 2020).
23a.8.6.1 Biomarkers of bone formation
Bone formation is determined by measuring proteins that increase in serum as a result of osteoblast activity during bone formation. These include bone alkaline phosphatase (BALP), which is measured as enzymatic activity, and the vitamin K‑dependent protein osteocalcin (OC). A third marker, procollagen type I N‑terminal propeptide (PINP) that reflects the protein synthesis capacity of the osteoblast can also be used. Early measurement of these three bone formation markers (OC, BALP and particularly PINP) has shown positive correlations with subsequent bone mineral density improvements in trials of teriparatide, a drug promoting bone formation (Bonjour et al., 2014). Bone alkaline phosphatase (BALP), an isoenzyme also known as bone-specific alkaline phosphatase or skeletal alkaline phosphatase, is measured in serum, and is essential for normal bone mineralization. Several techniques have been developed to measure the activity of this enzyme. In adults approximately 50% of serum total alkaline phosphatase is present as bone alkaline phosphatase, whereas during childhood, the bone isoenzyme predominates. BALP may also be measured when assessing vitamin D deficiency (see chapter 18b.12.2) during which osteoblast activity is suppressed due to low calcium absorption. Thus, BALP is not specific to calcium deficiency and interpretation of its activity must be accompanied by other measurements.Osteocalcin (OC), measured in serum, is also called a bone γ‑carboxyglutamic acid–containing protein because it contains up to three γ‑carboxyglutamic acid residues. This small non-collagenous protein is specific for bone tissue and dentin and comprises about 1–2% of total bone protein. During synthesis of osteocalcin, a small fraction is released directly into the blood. Osteocalcin is cleared by the kidneys so that serum levels depend on renal function. The half-life of serum osteocalcin is short (15–70min). Uncertainties persist as to the exact role of osteocalcin. Indeed, osteocalcin is secreted solely by osteoblasts, yet has only minor effects on bone mineralization. Instead, osteocalcin acts as a hormone-like factor in glucose homeostasis, brain development, cognition, and male fertility (Moser and van der Eerden, 2019).
Procollagen type I N‑terminal propeptide (PINP) measured in serum, is the preferred marker to measure bone formation (Bonjour et al., 2014). Most of the organic matrix of bone is type I collagen associated with non-collagenous proteins, and Type I collagen is rich in the amino acid hydroxy-proline. During the conversion of procollagen to collagen, which occurs extracellularly, the procollagen propeptides, procollagen type I carboxy- terminal propeptide (PICP) and procollagen type I aminoterminal propeptide (PINP) are released into the circulation. Although both bone alkaline phosphatase and PINP are markers of bone formation, PINP is the reference biomarker for bone formation (Kim et al., 2020).
23a.8.4.2 Biomarkers of bone resorption
Bone resorption markers include the pyridinium cross-links (PYR) subdivided into pyridinoline and deoxypyridinoline together with the associated telopeptides, i.e., carboxy terminal telopeptide (CTX) and N‑terminal telopeptide (NTX), all of which are released during collagen breakdown ( Table 23a.6). A second marker of bone resorption is tartrate-resistant acid phosphatase (TRAP), a measure of osteoclast number (Bonjour et al., 2014).Pyridinium cross-links (PYD) measured in urine were among the first bone biomarkers of resorption, but are rarely measured today. The crosslinks are hydroxylysylpyridinoline (known as pyridinoline, PYD) and lysylpyridinoline (known as deoxypyridinoline, DPD) and are important for the structural integrity of the collagen. Pyridinoline is widely distributed in both type I collagen of bone and type II collagen of cartilage, as well as in smaller amounts in the other connective tissues, and is thus considered non-specific. In contrast, deoxypyridinoline is found almost exclusively in type I collagen of bone (Kuo and Chen, 2017). Both the cross-links are released into the circulation after mature tissue collagen is degraded. They are not re-utilized or metabolized in the liver but, instead, are excreted in the urine unchanged, in peptide-bound and free forms. Neither PYD or DPD are commonly measured (Bonjour et al., 2014).
Cross-linked N‑telopeptides (NTX) and C‑telopeptides (CTX) measured in serum or urine are now the most commonly measured bone biomarkers of resorption. C‑telopeptides (CTX ) are better characterized than NTX and are the preferred bone resorption marker, although both have similar properties and origins. CTX is the reference marker for bone resorption (Kim et al., 2020). CTX and NTX are carboxy-terminal and amino-terminal fragments of collagen, respectively which are released into blood and subsequently excreted in the urine with cross-links attached (Bonjour et al., 2014). However, serum CTX levels are decreased by food intake so blood withdrawal must take place in the fasting state (Kuo and Chen, 2017). Measurement of biomarkers can be conducted using more than one detection method for each biomarker. A complete list of all the biomarkers discussed above as well as others still under consideration is available (Kuo and Chen, 2017), combining the biomarkers to generate a biomarker risk score is under development to enhance the accuracy of predicting fractures (Kim et al., 2020).
23a.9 Measurement of bone mineral content and bone mineral density
Noninvasive techniques can be used to provide an indirect assessment of calcium balance as well as calcium “stores” in bone by measuring the bone mineral content (BMC) or bone mineral density (BMD). These methods include dual X‑ray absorptiometry (DXA, also called DEXA) and quantitative computed tomography (QCT), both major diagnostic tools for osteoporosis. Ultrasound (US), although less accurate for medical diagnosis, can serve as a tool for screening and for field work. These technologies measure the mineral content of bone in the appendicular skeleton, the axial skeleton, or the total skeleton, measurements that relate directly to the calcium content of the skeleton. As almost all of the calcium in the body is stored in the skeleton, it follows that skeletal mineral content can be used as an indirect measure of body calcium stores. These same methods can also be used to monitor the response to changes in calcium intakes over relatively long time periods, i.e., months or even years.Over the past 40 years technologies such as DXA and QCT have been developed and refined to measure calcium in hard tissues, and thus estimate of total body mineral content, which in turn can be used to calculate total body calcium. These technologies are also used to determine bone integrity for the diagnosis of osteoporosis and other bone diseases. They can also be used during treatment to evaluate efficacy as well as in research studies for the development of new drugs, exercise regimens, or nutrition interventions (IOF, 2020).
The measurement of bone mineral using DXA is usually expressed as the bone mineral density, which corrects for projected bone area. However, the measurement is not a true density measurement, but instead, a measure of areal density (g/cm2) derived by dividing bone mineral content (g) by the scanned bone area. Bone mineral density is calculated in this way to reduce the biological variation observed in values for bone mineral content at all ages and thus to increase the statistical power of detecting abnormal values. Nevertheless, bone mineral density does not adequately correct for bone area and body size and thus must be interpreted carefully (Prentice et al., 1994). In contrast, QCT uses multiple slices to construct three-dimensional images, thus providing a true volumetric measure for BMD (Adams, 2009).
Diagnosis for osteoporosis is based on the difference between the measured bone mineral density (BMD) of the participant and the mean BMD of healthy young adults, matched for sex and ethnicity. The difference is expressed relative to the young adult population standard deviation, and reported as a T‑score. WHO, 1994 has defined both osteoporosis and osteopenia based on T‑score values. An individual with a T‑score less than −2.5 at the spine, hip, or forearm is classified as having osteoporosis; a T‑score between −2.5 and −1 is classified as osteopenia; and a T‑score greater than −1 is healthy. These WHO definitions should not be applied to other bone mineral density measurement sites.
The International Society for Clinical Densitometry (ISCD) has established guidelines for bone density testing using DXA. In addition, they provide specific guidelines for diagnosing osteoporosis based on T‑score values for postmenopausal women, men (20y and older), pre-menopausal women (20y to menopause), and children (males or females < 20y). Persons using DXA technology should be certified, and facilities should be accredited; consult the ISCD for advice on certification and accreditation.
23a.9.1 Single-photon absorptiometry
Single-photon absorptiometry was the first practical noninvasive method that was developed to examine the peripheral skeleton (Wahner et al., 1983). although now it has mostly been replaced by DXA (IOF, 2020). The original method was based on the assumption that the bone mineral content is inversely proportional to the amount of photon energy transmitted through the bone under study. A mono-energetic photon source is used, usually 125I or 241Am. The technique is fast, taking approximately 5min. With this method, bone mineral density is measured with a precision (%CV) of less than 2% and with an effective dose to the participant of only 0.1µSv. The site most frequently selected for measurements by single-photon absorptiometry is the lower radius, at approximately one-third of the distance from the styloid process to the olecranon. Single-photon absorptiometry is not suitable for measurements on the axial skeleton because the technique requires that a uniform thickness of soft tissue surrounds the bone (Neer, 1992). Newer technologies have replaced SPA for human studies as SPA cannot measure those sites (hip or spine) needed for clinical diagnoses. In the past four decades SPA machines have been adapted and used for animal studies of bone health (Sequeira et al, 2020).23a.9.2 Dual X‑ray absorptiometry (DXA)
The first commercial DXA scanner was marketed in 1987. There are now several commercial versions, each using similar measurement procedures The original DXA method used an isotopic source, typically 153Gd , that emitted two low-energy gamma rays at 44Kev and 100KeV. The short half-life of the isotopic source 153Gd, however, limited the precision with which long-term changes in bone mineral content in the same participant could be made using this technique. This limitation led to the radioactive 153Gd source being replaced with an X‑ray tube behind a K‑edge filter. The filter converts the polychromatic X‑ray beam into one with two main energy peaks at 40Kev and 70KeV. These two congruent X‑ray beams are passed through the body, and the ratio of beam attenuation at the lower energy relative to that at the higher energy differentiates between bone mineral, bone-free mass, and the fat mass (Kim et al., 2018). As a result, this modified instrument is termed a dual energy X‑ray absorptiometer, abbreviated as DXA (or DEXA).The DXA instrument is used not only for bone mineral measures but also to assess body composition, as described in Chapter 14. Only the measurements of bone mineral mass (g), bone mineral content (g/cm), and “areal” bone mineral density (g/cm2) are discussed here. Using DXA, measurements of areal bone mass density (aBMD) can be made at the lumbar spine, femur, and forearm, as well as total body. Measurements of body mineral density at the lumbar vertebrae (L2 to L4) are often favored because they are sensitive to the changes associated with aging, disease, and therapy. Care must be taken when positioning the participant for the scan to ensure that precise and accurate data are obtained. Under some circumstances, it may be appropriate to make a whole-body scan. This is quick, taking from 3min to 35min, depending on the instrument used and the age of the participant, and requires very little cooperation from the participant. As a result, scans can be readily performed on young children, the elderly, and even persons who are sick, although pregnant women should be excluded (Kim et al., 2018).
Dual-energy X‑ray absorptiometry is now the dominant method for measuring bone loss for clinical diagnosis of osteopenia and osteoporosis. In intervention studies care must be taken to ensure that both the length of the intervention and the size of the study population are sufficient to allow the detection of small changes in bone mineral density. A meta-analysis of trials reported that increasing calcium intake from dietary sources increased BMD by 0.6–1.0% at the total hip and total body at one year, and by 0.7–1.8% at these sites and the lumbar spine and femoral neck at two years (Tai et al., 2015). Larger decreases in bone loss have been observed after treatment with estrogen, calcitonin, or biphosphates.
When comparing measurements using DXA based on different instruments and technologies, it is important to acknowledge the potential for systematic differences arising from methodological factors which could mask those associated with biological variation. Methodological factors may include differences in instrument calibration methods, whereas variations in body thickness, distribution of body fat, and the fat content of the bone marrow are major sources of biological variation. Of the latter, DXA is especially sensitive to discrepancies in body thickness, which can lead to systematic differences in the bone mineral estimates on thin and obese subjects. In a global survey of fracture liaison services, although access to DXA was reported to meet the needs (Clynes et al., 2020), only around 50% of institutions confirmed adherence to basic DXA quality and reporting procedures, and many required educating the operators/interpreters. Indeed, significant variability worldwide in both the quality and access to DXA services was reported in this survey.
Calcium balance using DXA may be determined by obtaining a total body (TB) DXA scan that provides bone mineral content (BMC). Scans of total body bone mineral content (TBBMC) can be used to calculate calcium requirements of specific life cycle groups, on the assumption that bone mineral is 32·2% calcium (Vatanparast et al., 2010). Use of this value is a better approximation of calcium in bone than simply dividing the atomic weight of calcium (40g/mol) by the molecular weight (i.e., 1005g/mol) of hydroxyapatite Ca10(PO4)6(OH)2 because the mineral in bone is hydrated so water molecules contribute to the weight of bone mineral content.
To derive the Estimated Average Requirement (EAR) for calcium for adolescents 9–18y, the U.S Food and Nutrition Board applied the factorial approach to estimate the physiological calcium requirements (IOM, 2011). Estimates of calcium losses via urine, feces, and sweat were derived from metabolic balance studies to which was added the calcium accrued as bone mineral for growth (derived from TBBMC). The latter was measured in a cohort of Canadian males and females in two age groups, 9–13y and 14–19y as shown in Table 23a.7| Factorial Components | Girls 9–18y (mg/d) | Boys 9–18y (mg/d) |
|---|---|---|
| Ca accretion from TBBMC | 121 | 175 |
| Urinary Ca Losses | 106 | 127 |
| Endogenous Fecal Ca | 112 | 108 |
| Sweat Ca Losses | 55 | 55 |
| Total Ca physiological need | 394 | 465 |
| Absorption (%) | 38 | 38 |
| Dietary Ca requirement (EAR) | 1037 | 1224 |
EAR = Ca losses + (Ca needs for growth / 38%)
(IOM, 2011).
23a.9.3 Computerized tomography (CT) and peripheral quantitative CT (pQCT)
Computerized tomography (CT), often called quantitative CT (QCT) when referring to bone measurements, can be used to measure bone mass of both the appendicular and axial skeleton, although the method is not feasible for population studies. The advantage of QCT is that a true three-dimensional (i.e., volumetric) bone density can be obtained, so results can be expressed in g/cm3 rather than the two-dimensional areal density measured by DXA. Bone can also be identified as cortical or trabecular in nature on the basis of bone density measurements. This is an advantage because some forms of osteoporosis are predominantly trabecular in character. The equipment is not portable, and the radiation dose required per slice for imaging is relatively high (50–500µSv), although it can be reduced if scans are limited to regions of specific interest. The cost of the equipment and its maintenance is high.The use of QCT technology applied to specific bone sites yields information about microarchitecture. Methods that can be used include micro‑CT and peripheral Quantitative CT (pQCT), with the latter having widespread use. The equipment for pQCT is small relative to DXA and CT, and provides imaging of both the arm at the distal radius and the lower leg (tibia) sites to assess bone microarchitecture. High-Resolution pQCT (HR‑pQCT) has been developed to improve the resolution problems of pQCT. Recently, second-generation HrpQCT has been introduced which differs from the first-generation HR‑pQCT in scan region, resolution, and morphological measurement techniques (Whittier et al., 2020).
23a.9.4 Quantitative ultrasound
Quantitative ultrasound (QUS) is used for measurements of the bone density of the peripheral skeleton such as the proximal arm (radius), lower leg (tibia) or heel. A wide variety of equipment is now available to measure the attenuation of a sonographic pulse as it passes through bone and is scattered and absorbed by the trabeculae. The heel is the most frequently used measurement site because it has a large volume of trabecular bone that is accessible for transmission measurements. However, there are ultrasound machines on the market that measure multiple skeletal sites. Quantitative Ultrasound has the advantage of being radiation-free and a portable system.Quantitative ultrasound measures the speed of sound (SoS) in meters per second (m/s). In a study of different age groups using QUS, measures of SoS (m/s) varied according to life stages that reflected bone development (Rivas-Ruiz et al., 2015). For example, bone SoS accretion was found to begin 5y earlier in girls than boys (p < 0.05), a sex-related difference that mirrors results seen in DXA scans (Vatanparast et al., 2010). The maximal (peak bone) SoS was noted at 28y at the radius site and at 22y at the tibia site. Women who were postmenopausal (age 45–50y) showed a significant decrease in SoS measures at both these sites (p < 0.05) compared with men, as would be expected. Thus, while the precision of QUS is poor relative to DXA, the equipment may be suitable for characterizing bone in populations where DXA is not a feasible option. However, QUS has no clinical applications and is not used to define T‑scores for diagnosing osteoporosis or monitoring treatment. However, a systematic review has shown that quantitative ultrasound is an independent predictor of fracture for men and women when QUS values are low (McCloskey et al., 2015).