
Gibson RS1
Principles of
Nutritional
Assessment:
Evaluation of
anthropometric Data
3rd Edition, July, 2024
Abstract
Anthropometric indices of growth and body composition are compiled from two or more anthropometric measurements. The indices most frequently used for children include weight-for-height, height-for-age, weight-for-age, body mass index (BMI)-for-age, and mid-upper-arm circumference (MUAC)-for age. The methods recommended to evaluate these anthropometric indices use either percentiles or Z‑score calculated in relation to the distribution of the anthropometric indices for a reference population. The World Health Organization (WHO) recommends for international use the prescriptive WHO Child Growth Standards for those age 0–5y and the WHO Growth Reference for those age 5–19y. New international prescriptive growth standards are also available for gestational weight gain, fetal and newborn growth, and postnatal growth for pre-term infants. In clinical settings, serial anthropometric measurements are used to track an individual's growth pattern, and identify abnormal changes in growth and their response to treatment. In public health, screening systems, that include at least one anthropometric measurement or index in combination with one or more reference limits or cutoff points, can be used to identify “at risk” individuals. At the population level, screening can be used to compare and monitor the prevalence and severity of malnutrition within and across countries, and to monitor progress. Examples include use of height-for-age <−2 Z‑score to identify and monitor stunting, weight-for-height <−3 Z‑score or MUAC < 115mm to identify and monitor severe, acute, malnutrition in children 6–60mos, BMI‑for‑age Z‑score or BMI for overweight and obesity in children and adults, respectively, and a composite index of anthropometric failure (CIAF). Public health applications of anthropometry discussed in this chapter include: (a) international comparisons of growth; (b) identifying determinants and consequences of malnutrition; (c) targeting interventions; (d) assessing responses to interventions; and e) nutritional surveillance. Several methods recommended for evaluating anthropometric indicators are also emphasized, the choice depending on the objectives and design of the study. CITE AS: Gibson RS. Principles of Nutritional Assessment.Evaluation of anthropometric data https://nutritionalassessment.org/anthro/
Email: Rosalind.Gibson@Otago.AC.NZ
Licensed under CC-BY-4.0
( PDF ).
13.0 Introduction
Standardized methods of evaluating anthropometric indices are essential to assess nutritional status and to identify malnutrition in individuals or populations. Two methods are used based on Z‑scores or percentiles, both calculated in relation to the distribution of the anthropometric indices for a reference population. The World Health Organization (WHO) recommends the use of the WHO Child Growth Standards for young children 0–5y internationally. They were compiled using a prescriptive approach depicting physiological human growth under optimal conditions. Hence, they represent how young children should grow, rather than as a “reference” describing how children do grow. The WHO Child Growth Standards are recommended for international use because the effects of ethnic and genetic differences on the growth of infants and young children are small compared with the environmental, nutritional, and socio-economic effects on growth, some of which may persist across generations. The reference population recommended for assessing the growth of older children is the WHO Growth Reference data for school-age children and adolescence.A series of prescriptive standards for monitoring fetal, newborn growth, and gestational weight gain have also been developed by the INTERGROWTH-21st project for international use. This project adhered to the WHO recommendations for assessing human size and growth (WHO Working Group on Infant Growth, 1995), and followed healthy pregnant women longitudinally from 9wks of fetal life to 2y (Papageorghiou et al., 2018). Populations from urban areas of eight countries in which maternal health care and nutritional needs were met (Brazil, China, India, Italy, Kenya, Oman, the UK and the USA) were involved to ensure universal multi-ethnic growth standards were generated that represent how fetuses should grow (i.e., the standards are prescriptive). Box 13.1 lists the prescriptive growth standards generated from the INTERGROWTH-21st project with the associated references.
- Fetal growth standards based on serial ultrasound measurements: Papageorghio et al. (2014).
- Estimated fetal weight standards: Stirnemann et al. (2017).
- Fetal growth velocity standards from the Fetal Growth Longitudinal Study: Ohuma et al. (2021).
- Gestational weight gain standards based on women enrolled in Fetal Growth Longitudinal study: Ismail et al. (2016).
- Newborn weight, length, and head circumference by gestational age and sex: Villar et al. (2014).
- Postnatal growth standards for preterm infants: Villar et al. (2015).
However, serial measurements are often not possible in public health. Instead, screening systems, which include at least one anthropometric measurement or index in combination with the recommended reference limit or cutoff point are used to identify individuals in the population “at risk” to malnutrition. Examples of measurements or indices used in this way and discussed below include weight-for-height, body mass index (BMI), MUAC (to identify severe acute malnutrition), and a composite index of anthropometric failure (CIAF). Data derived from screening systems can be used to compare and/or monitor the prevalence of malnutrition across populations, and to assess the need for, or impact of, interventions both within and across countries. In some cases, reference limits can be combined with “prevalence thresholds” to describe and compare populations according to levels of severity of malnutrition, and identify priority populations for action. Prevalence thresholds can also be used by governments to trigger action, and to monitor and evaluate the impact of interventions.
Anthropometry can also be used to characterize the nutritional status of a population or to highlight changes in their nutritional status with successive measurements over time (i.e., surveillance). To achieve these objectives, a comparison of the frequency distribution of anthropometric indices of the entire population in relation to the recommended reference data using Z‑scores (in developing countries) or percentiles is recommended.
Details of the methods recommended by WHO for evaluating anthropometric indices, followed by a review of the systems used to identify and classify risk of malnutrition at the individual and population levels, are discussed below. Examples of the applications of anthropometry in public health are also included together with details of the designs and statistical procedures that can be used to evaluate intervention programs.
13.1 Anthropometric indices and their modes of expression
Details of the standardized procedures for the measurements of body size and body composition are outlined in Chapters 10 and 11. Raw measurements, however, have little meaning unless they are related to, for example, the age or sex of an individual (WHO, 1995). Hence, the correct interpretation of anthropometric measurements requires the use of anthropometric indices. They are usually compiled from two or more raw measurements. Details of indices of body size and body composition are also available in Chapter 10 and 11, respectively. In children, the four most commonly used anthropometric indices are weight-for-height, height-for-age, weight-for-age, and body mass index — defined as weight / (height)2 (kg/m2).Weight-for-height measures body weight relative to height. Low weight-for-height is described as “thinness” and reflects a pathological process referred to as “wasting”. It arises from a failure to gain sufficient weight relative to height or from losing weight. High weight-for-height in children is referred to as “overweight” and arises from gaining excess weight relative to height or from gaining insufficient height relative to weight.
Height-for-age is a measure of achieved linear growth and can be used as an index of past nutritional or health status. Recumbent length is measured in infants and children less than 2y, and height in older children. Low height-for-age is defined as “shortness” and reflects either normal variation or a pathological process involving a failure to reach a linear growth potential. The outcome of the latter process is referred to as “stunting” or the gaining of insufficient height relative to age (WHO, 1995). The etiology of stunting is multifactorial, often resulting from a combination of extended periods of inadequate food intake, poor dietary quality, and increased morbidity.
Weight-for-age reflects body mass relative to chronological age. Low weight-for-age is described as “lightness” and reflects a pathological process referred to as “underweight”, arising from gaining insufficient weight relative to age, or losing weight. High weight-for-age can be described as “heaviness” but this term is seldom used: high weight-for-height is more useful as a proxy for “overweight” (WHO, 1995).A major limitation of weight-for-age is that it reflects both weight-for-height and height-for-age. It fails to distinguish tall, thin children from those who are short with adequate weight. Thus, children with a low weight-for-age may be genetically short or their low weight-for-age may result from “stunting” or nutritional growth failure. Consequently, weight-for-height and height-for-age are the preferred anthropometric indices of body size for children because, in combination, they can distinguish wasting and stunting.
| Wt.- for- ht. | Ht.- for- age | Wt.- for- age | BMI- for- age |
|
|---|---|---|---|---|
| Usefulness in populations where age is unknown or uncertain | 1 | 4 | 4 | 4 |
| Usefulness in identifying wasted childrena | 1 | 4 | 3 | 1 |
| Sensitivity to weight change over a short period of time | 1 | 4 | 2 | 2 |
| Usefulness in identifying stunted children | 4 | 1 | 2 | 4 |
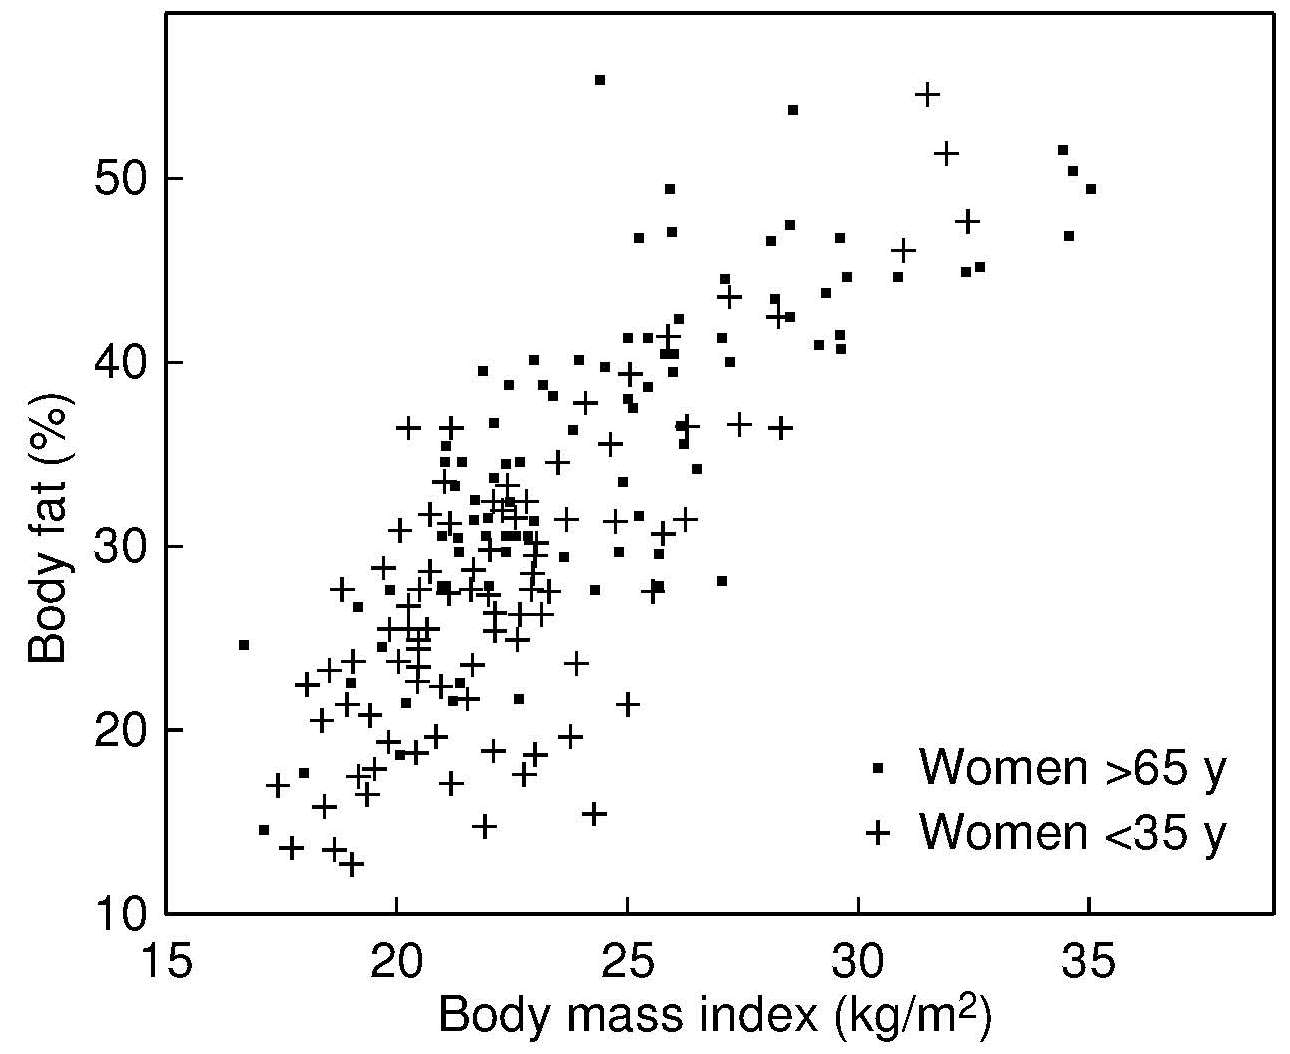
Body mass index (BMI) is the internationally recommended index of overweight and obesity in children and adults and calculated as: \[\small\mbox{weight(kg)/ height(m)}^{2} \] An increased BMI-for-age in childhood and adolescence is associated with a higher percentage of body fat, which is a known risk factor for cardiovascular disease (de Onis and Lobstein, 2010). However, BMI alone does not distinguish between weight associated with muscle, and weight associated with body fat. Hence, in some circumstances, an elevated BMI may result from adiposity, muscularity, or edema. Furthermore, BMI is insensitive to the actual distribution of body fat (Thomas et al., 2012). For more details, see Chapter 10. Table 13.1 summarizes the information that can be obtained from each of the four growth indices discussed above.
Note that to interpret any single measurement of either weight or stature in relation to the reference data, the exact age of the child at the date of the measurement must be known. Software such as WHO AnthroPlus can calculate exact ages in decimal fractions of a year, from birth and visit dates. In the event that documentary evidence of the date of birth is not available, it may be necessary to obtain at least the month and year of birth using a local event calendar. Information on the development of a local event calendar is available from FAO (2008).
For studies of both individuals and populations, the anthropometric indices can be compared to the reference population using percentiles or Z‑scores derived from the reference data. The reference populations recommended are the WHO Child Growth Standards (WHO, 2006) for infants and children 0–5y, and the WHO Growth Reference data for school‑age children and adolescents 5–19y (de Onis et al., 2007).
The WHO Child Growth Standards were based on a multicenter growth reference study for infants and children aged 0–5y from six diverse geographic sites (Brazil, Ghana, India, Norway, Oman, and the U.S.), as noted earlier. The study combined a longitudinal design from 0–24mos with a cross-sectional study of children aged 18–71mo from the same sites (de Onis et al., 2004). A prescriptive approach was taken for the development of these growth standards with the goal of providing a single international reference that represents the best description of physiological growth for all children ≤ 5y and to establish the breastfed infant as the normative model for growth and development.
The WHO Growth Reference for school-age children and adolescents 5–19y was developed from the 1977 National Center for Health Statistics data set (Silveira et al., 2011), supplemented with data from the WHO Child Growth Standard. The statistical methodology used to construct this reference was the same as that used for the WHO Child Growth Standard. More details of these child growth standards are available from WHO.
In most industrialized countries, percentiles are used, whereas in low-income countries, the use of Z‑scores is recommended. The proportion of individuals with indices below predefined reference limits based on percentiles or Z‑scores can also be assessed and are widely used as indicators of community status.
In some circumstances, percentiles and Z‑scores cannot be calculated and, instead, the anthropometric indices are expressed in terms of percent-of-median. Percent-of-median, however, provides only limited information on the relative position of the value within the population and as a consequence, is rarely used today.
13.1.1: Percentiles
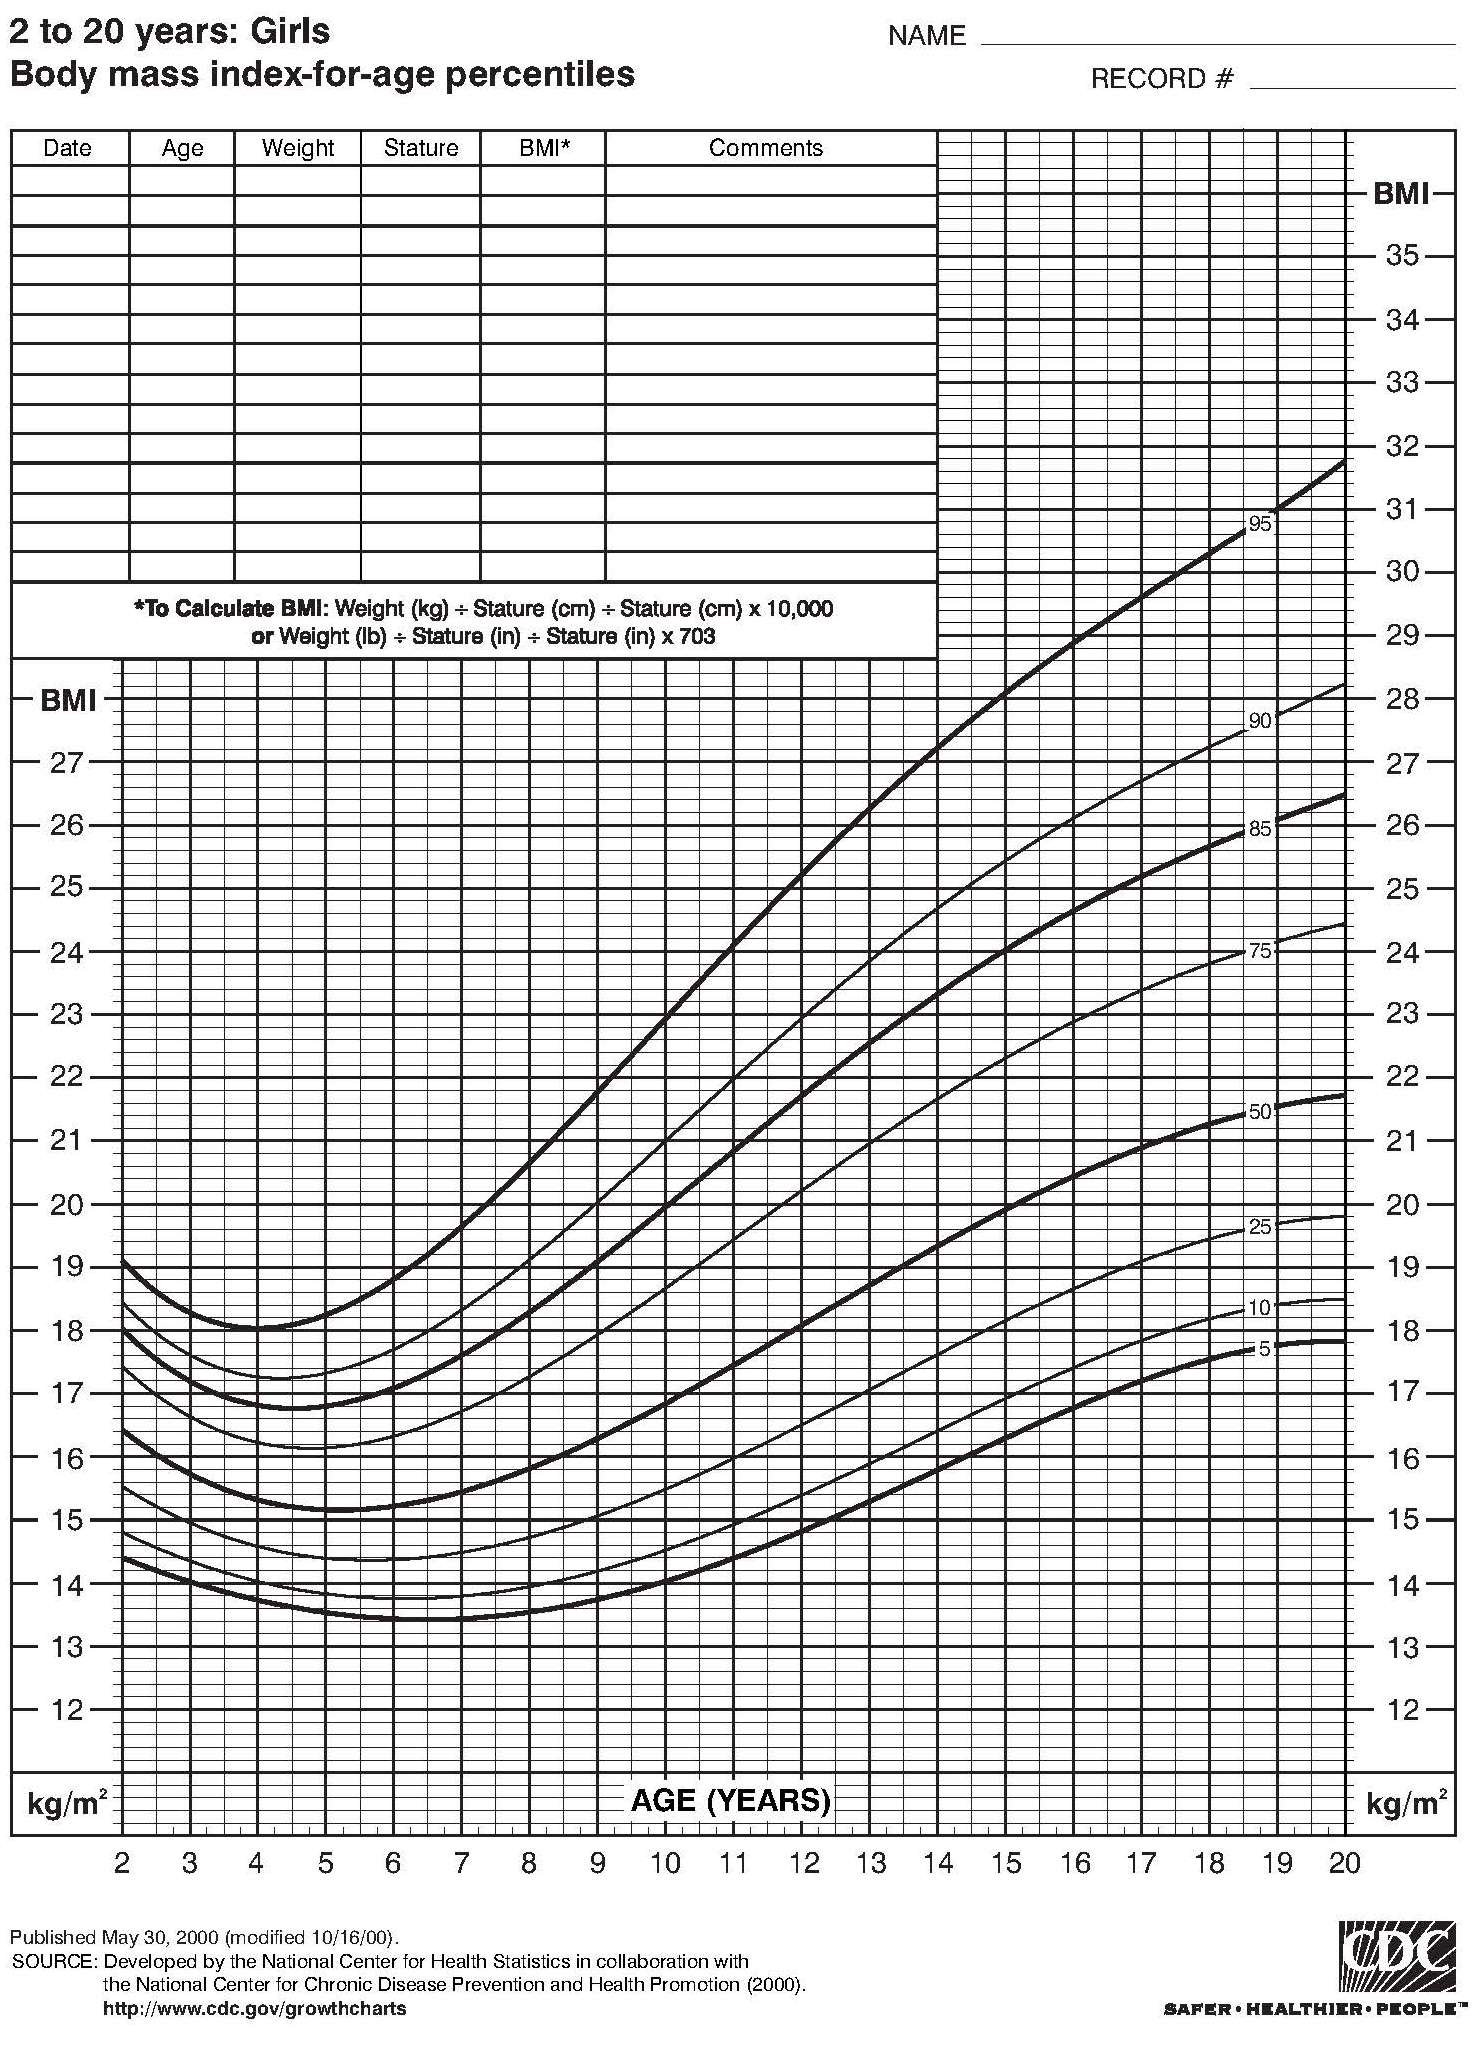
A percentile refers to the position of the measurement value in relation to all the measurements for the reference population, ranked in order of magnitude. Figure 13.1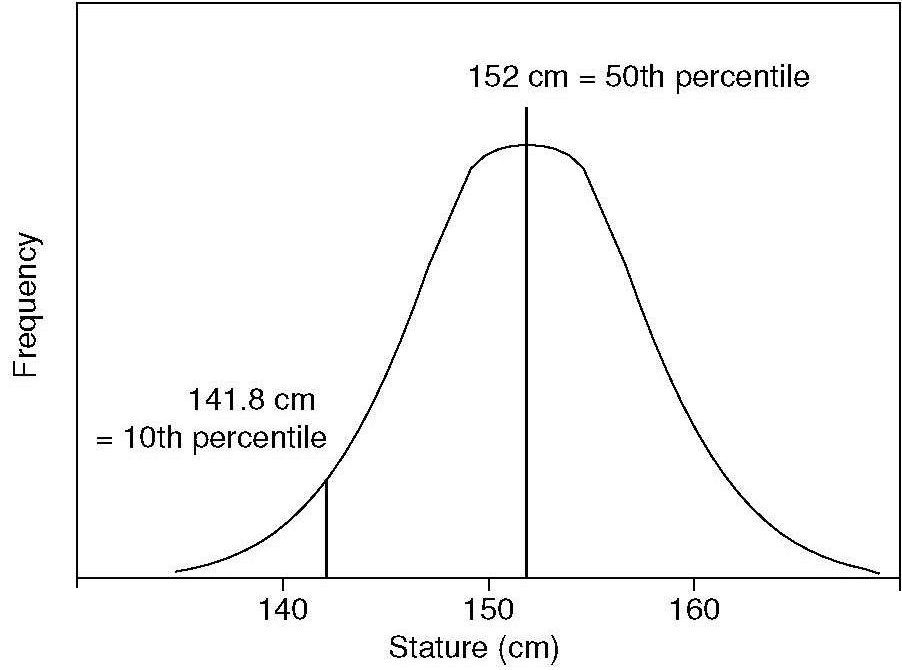
The percentile for an individual of known age and sex can be calculated exactly, if the numerical percentile values are available for the reference data. Computer programs (e.g. WHO AnthroPlus for personal computers) are available to calculate exact percentiles (1st to 99th percentiles) based on the WHO Child Growth Standards (0–5y) (WHO, 2006) and the WHO Reference (2007) for school-aged children and adolescents (5–19y) (de Onis et al., 2007). Alternatively, the updated US Center for Disease Control and Prevention (CDC) 2000 Growth Reference in the United States (Kuczmarski et al., 2000) can be used from which numerical percentile values can be calculated based on the method described by Vidmar et al. (2004). Alternatively, the percentile range within which the measurement of an individual falls can be read from sex-specific graphs or tables of the appropriate reference data.
For children (0–5y), percentile charts are for: weight-for-length from 45–110cm; weight-for-height from 65–120cm; weight-for-age (0–60 completed months); length / height-for-age (0–60mos); arm-circumference-for age (0–60mos); BMI-for-age (0–60mos); head-circumference-for-age (0–60mos); triceps skinfold-for-age (0–60mos); subscapular-skinfold-for-age (0–60mos). Growth charts are available from WHO. For field use, simplified field tables are also available from WHO. For the WHO Growth Reference 2007 for school-aged children and adolescents (5–19y), percentile charts for weight-for-age (5–10y) and height-for-age and BMI-for-age (5–19y) are discussed in de Onis et al. (2007).
Sometimes, when calculating percentiles, adjustments are made for parental stature, to distinguish between genetic and pathological effects in a child who is unusually short. The magnitude of the adjustment tends to be greater for older children. An example of adjustments based on mid-parent height is given in Himes et al. (1985).
Adjustments are also important when evaluating the growth percentiles of both low birth weight (i.e., < 2500g) and preterm infants (i.e., < 38wk gestation). Specialized growth charts are available for determining the growth percentiles of preterm infants (Villar et al., 2015).
For population studies, the number and percentage of individuals falling within specified percentiles of the reference data can be tabulated or presented graphically to provide an estimate of “relative status”, as shown in Figure 13.2.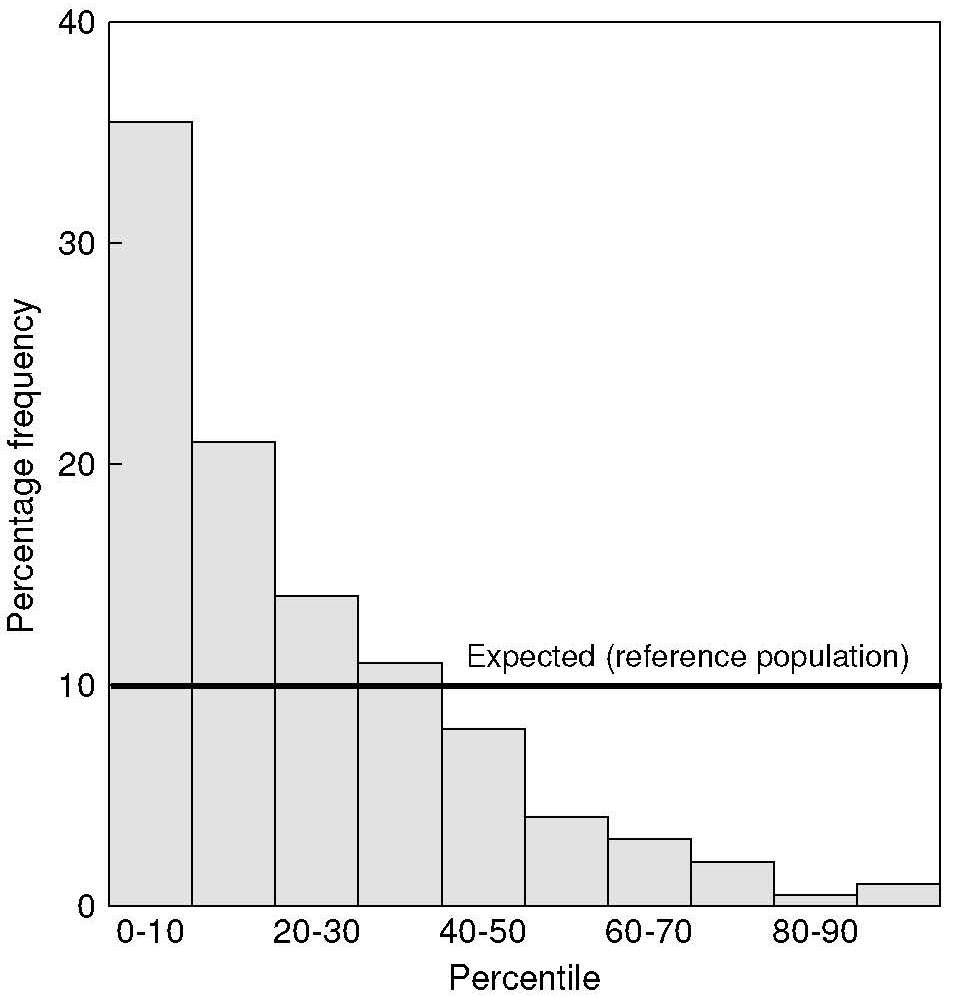
The percentile reference limits commonly used for designating individuals as “at risk” to malnutrition are either below the 3rd or 5th percentiles or above the 97th or 95th percentiles. The limits chosen depend on the reference data used.
Use of percentiles is recommended for the evaluation of anthropometric measurements from relatively well-nourished populations from industrialized countries, as no errors are introduced if the data have a skewed distribution. Weight-for-age, weight-for-height, and many circumferential and skinfold indices have skewed distributions.
Percentiles are not recommended for evaluating anthropometric indices of individuals or populations from low-income countries if reference data from industrialized countries, such as the US CDC 2000 (Kuczmarski et al., 2000), are used. In such circumstances, an individual, or many participants with large deficits in weight and height, may have indices below the extreme percentile of the reference distribution (i.e. below 3rd or 5th percentile), making it difficult to characterize the magnitude of the deficit for the individual or accurately classify large numbers of individuals (Waterlow et al., 1977). Moreover, because data from a population, expressed in terms of percentiles, are often not normally distributed, such populations cannot be correctly described in terms of means and standard deviations of the percentiles.
13.1.2 Z‑scores
The World Health Organization recommends the use of Z‑scores for evaluating anthropometric data from low-income countries (Gorstein et al., 1994), because Z‑scores can be calculated accurately beyond the limits of the original reference data. This is an advantage in low-income countries because individuals with indices below the extreme percentiles of the reference data can then be classified accurately.The method measures the deviation of the anthropometric measurement from the reference median in terms of standard deviations (SD) or Z‑scores. The score is a measure of an individual's value with respect to the distribution of the reference population.
Z‑scores are calculated differently for measurements
that are distributed normally (e.g., height-
for-age) and non-normally in the reference
population (e.g., weight-for-age). The Z‑score for a
measurement that is normally distributed corresponds to:
\[\small \mbox{Z‑score =} \frac{\mbox{(observed value)−(median reference value)}}{\mbox{ standard deviation of the reference population}}\]
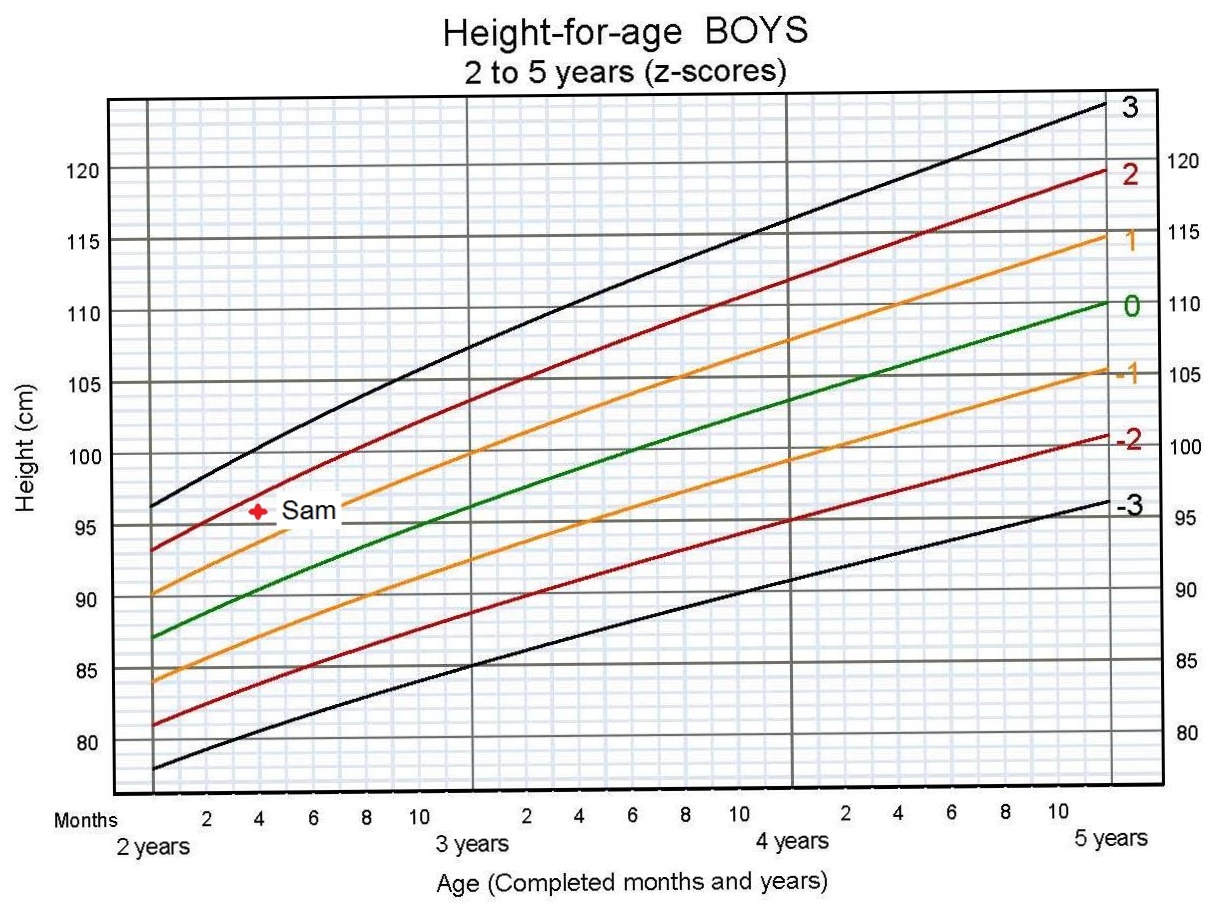
- the observed value is Sam's height (96.1cm).
- the median reference value for height of all boys who are Sam's age (2y and 4mo) is 90.4cm.
- the standard deviation of boy's height at 2y and 4mos is 3.3. The standard deviation of boy's height can be thought of as the average of differences from the median for each member of the reference population.
- inserting the above numbers in the formula, Sam's Z‑score is calculated as: \[\small \frac{(96.1− 90.4)}{ 3.3 } = 1.73\]
However, the above formula cannot be used for measurements that are not normally distributed such as weight-for-age, weight-for-height, and BMI-for-age, because the distances between adjacent Z‑scores are not constant. As a result, an LMS formula is used to calculate the Z‑scores for measurements that are skewed. For more details, see Cole (1990) and Vidmar et al. (2004). Note that for measurements that fall beyond −3 and +3 Z‑scores a modified version of the LMS formula must be applied (incorporated within WHO Anthro software).
These calculations can be carried out using the WHO software program (WHO AnthroPlus 2009) which uses the WHO Child Growth Standard for those 0–60mos (WHO, 2006) and the WHO Growth Reference for children and adolescents aged 5–19y (de Onis et al., 2007) as the reference populations. As noted earlier for percentiles, for clinical use, the Z‑score range within which the measurement of an individual falls can also be read from graphs or tables of the appropriate reference data for the same indicators for infants and children age 0–60mos and children and adolescents age 5–19y. Simplified field tables are also available.WHO has also developed a tool for the application of the WHO Child Growth Standards which includes instructions of how to take the measurements, interpret growth indicators, investigate causes of growth problems, and how to counsel caregivers. A child age calculator is available as part of the course materials for the trainers and available in WHO Regional Offices. An anthropometry training (video) is also available. Motor milestone windows of achievement have also been developed and are available from (WHO.)
Guidelines have also been developed on the use of the fixed exclusion method to identify implausible Z‑score value for each anthropometric growth index based on the WHO Child Growth Standard. Z‑score values outside the following intervals are considered implausible:
- HAZ (below −6, or above +6);
- WHZ (below −5, or above +5);
- WAZ (below −6, or above +5).
WHO also recommends calculating the standard deviation (SD) of Z‑scores for each anthropometric growth index as an additional assessment of data quality. This is important because an inflated SD arising from poor quality data results in prevalence estimates that are likely to be overestimated. Currently, WHO has not set cut-offs at which SDs for each anthropometric index are related to poor data quality. Instead, WHO suggests that strata specific SDs that are greater than the SD for the national estimate should be examined and highlighted in any survey report. More details on standardizing the analysis, interpretation, and reporting of anthropometric data for infants are available from (WHO).
Z‑scores for anthropometric indices using alternative reference populations such as U.S. CDC 2000 Growth Reference in the United States, (Kuczmarski et al., 2000) can also be calculated based on the method described by Vidmar et al. (2004).
In population studies, the number and the proportion of individuals within a specified range of Z‑scores for each age and sex group can be tabulated or presented graphically to provide an estimate of “relative” status, as shown in Figure 13.4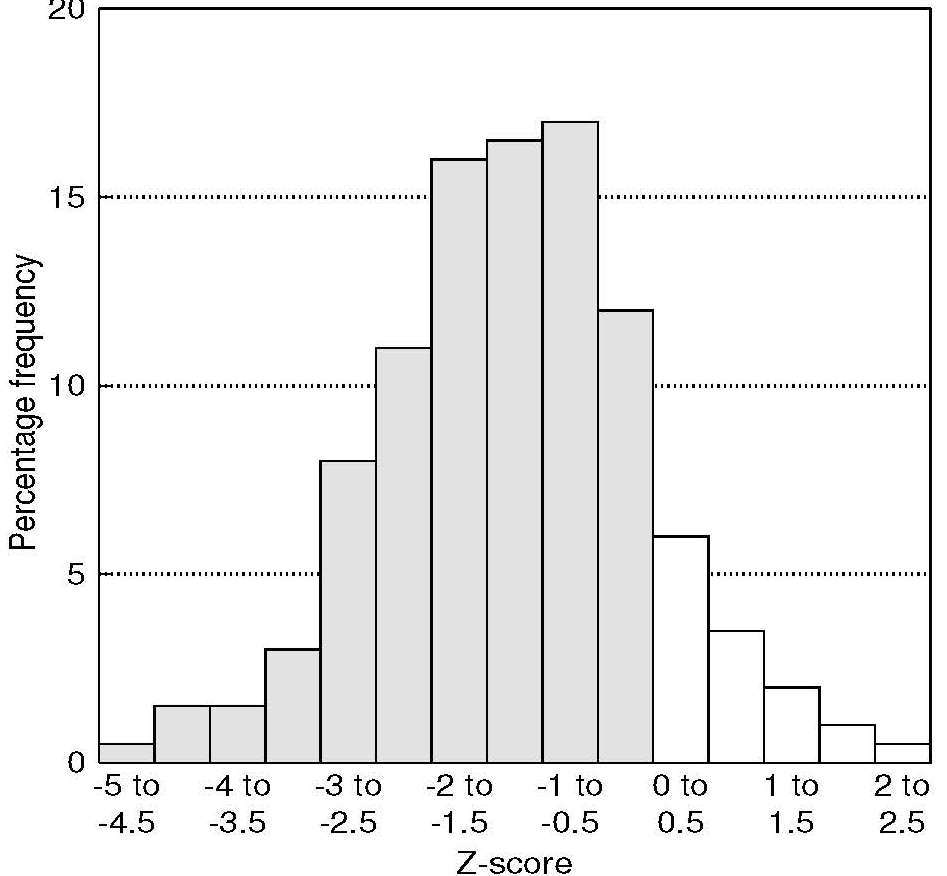
The WHO Global Database on Child Growth and Malnutrition uses a Z‑score less than −2 to classify low weight-for-age as “underweight”, low length/height-for-age as “stunted”, and low weight-for-length as “wasted” (WHO, 2006). In children aged 0–5y, a Z‑score above +2 is used to classify weight-for-height as “overweight” and as “obese” with a weight-for-height Z‑score above +3.
Figure 13.5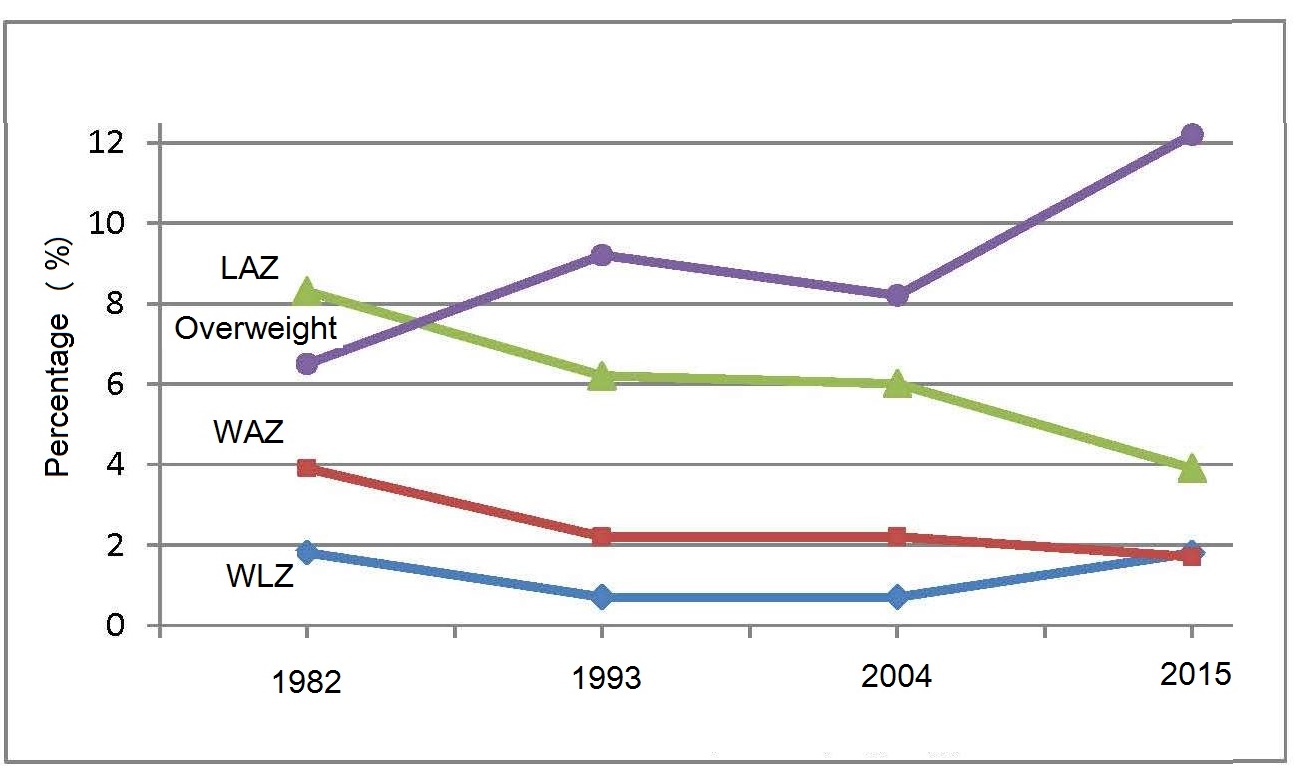
The WHO indicators stunting, overweight, and wasting are three of the six global nutrition target indicators shown in Box 13.2.
- Stunting. Target: 50% reduction in the number of children under 5 who are stunted.
- Anemia. Target: 50% reduction of anemia in women of reproductive age.
- Low birth weight. Target: 30% reduction in low birth-weight.
- Childhood overweight. Target: Reduce and maintain childhood overweight to less than 3%.
- Breastfeeding. Target: Increase the rate of breastfeeding in the first 6 months up to at least 70%.
- Wasting. Target: Reduce and maintain childhood wasting to less than 3%.
Indicators for overweight and obesity in both young and older children and adolescents are also based on Z‑scores for BMI-for-age of the WHO Child Growth Standard (WHO, 2006) and the WHO growth reference 2007. For children (0–5y) a Z‑score for BMI-for-age above +1 is described as being “at risk of overweight”, above +2 as “overweight” and above +3 as “obese”. For children greater than ≥ 5y, de Onis and Lobstein (2010) suggest using the adult classification scheme; children with BMI Z‑scores above +1 are described as being “overweight” and above +2 “as obese”.
An important advantage of using Z‑scores for population-based applications is that it is valid to calculate the mean and standard deviation for a group of Z‑scores. This allows the nutritional status of the entire population to be described. In addition, because the observed Z‑scores from a population are often normally distributed, statistical analytical procedures that assume normality such as t-tests and regression methods can be used (Gorstein et al., 1994).
In some circumstances, however, a mean Z‑score will not be useful. For example, in some studies of refugees, the death rate among those most severely malnourished can be high and the lower end of the distribution can be truncated: the mean is hardly affected (Yip and Sharp, 1993). In such cases, a comparison of the distribution of indices of the entire population in relation to the reference population is more useful (Figure 13.4).
If the distribution of the reference values is normal, percentiles and Z‑scores are directly related, as shown in Table 13.2:| Below mean | Above mean | ||
|---|---|---|---|
| Percentile | Z‑score | Percentile | Z‑score |
| 5.0 | –1.645 | 55.0 | 0.126 |
| 10.0 | –1.282 | 60.0 | 0.253 |
| 15.0 | –1.036 | 65.0 | 0.385 |
| 20.0 | –0.842 | 70.0 | 0.524 |
| 25.0 | –0.675 | 75.0 | 0.675 |
| 30.0 | –0.524 | 80.0 | 0.842 |
| 35.0 | –0.385 | 85.0 | 1.036 |
| 40.0 | –0.253 | 90.0 | 1.282 |
| 45.0 | –0.126 | 95.0 | 1.645 |
| 50.0 | –0.000 | ||
| Characteristic | Z‑score | Per- centile | % of median |
|---|---|---|---|
| Adherence to
ref- erence distribution | Yes | Yes | No |
| Linear scale
permitting summary statistics | Yes | No | Yes |
| Uniform criteria
across all ages and indices | Yes | Yes | No |
| Detects
changes at ext- remes of distributions | Yes | No | Yes |
13.1.3 Height-for-age difference
There is some debate about using absolute (centimeters) vs. relative (Z‑scores) scales to describe changes in growth in populations of children over time. Leroy and colleagues (2014) argue that although HAZ is useful to assess childen's attained height at a given age, HAZ is inappropriate to evaluate changes in height as children age at both the individual and population level. As shown earlier in the example of the Z‑score calculation of an individual, the construction of a Z‑score for height-for-age uses as a denominator the Z‑score of the reference population. The Z‑score is based on cross-sectional data, and reflects the scatter of height values at a specific age. Such Z‑scores of the reference population are not constant, however, but actually increase linearly during childhood, thus limiting the usefulness of HAZ to assess changes in height over time. Instead, Leroy et al. (2014) recommend using height-for-age difference (HAD) to describe and compare height changes as populations of children age. Height-for-age difference is defined as a child's height minus the median height of the growth standard at that age, expressed in centimeters. Leroy and colleagues compared changes in height as populations age based on absolute height-for-age differences (HADs) and HAZs using data from 51 nationwide surveys from low- and middle-income countries (Leroy et al., 2014). A comparison of these changes based on the two methods for children 1–59mo is shown in Figure 13.6.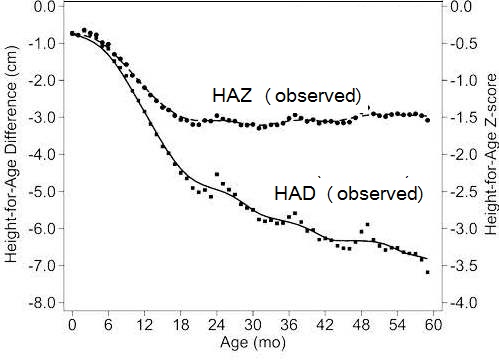
Based on the mean HAD curve, the children started with an average height deficit of 0.8cm, with the most pronounced faltering (i.e., steepest slope) evident between 6 and 18mo, as shown for the HAZ curve. Nevertheless, in contrast with the trend in the HAZ curve, the deficits in linear growth depicted by the HAD curves continued to increase after 18mo, albeit at a lower rate than before 18mo. Indeed, the slopes of the HAD curve provide no indication that the process of growth faltering leveled off even at 5y. The bumps noted in the curves just after 24, 36, and 48mo are reportedly due to the tendency to report age in completed years rather than exact months (Victora et al., 2010). Such growth deficits were also evident in five regions (E. Europe and Central Asia, North Africa and Middle-East, Latin America and Carribean, Africa South of the Sahara, South Asia), although the magnitude of the deficits varied between regions. See Leroy et al. (2014) for more details.
Globally, 70% of the absolute deficit accumulated in height (HAD) at 60mo could be attributed to faltering during the first “1000” days (conception to 24mos), but 30% was due to continued increases in deficit from age 2–5y. However, such continued increases were masked by the use of HAZ with the age-related changes in Z‑scores. These findings emphasize the importance of using the mean HAD to provide an accurate assessment of population-level catch-up in linear growth at all ages. For more discussion see Leroy et al. (2014; 2015) and Lundeen et al. (2014).
13.1.4 Percent-of-median
Growth indices can be expressed as percent-of-median value of the reference data when the distribution around the median value is unknown. Percent-of-median is the ratio of a measured anthropometric value (e.g. weight) in the individual, to the median value of the reference data for the same age or height, expressed as a percentage. It is especially useful when the distribution of the reference data has not been normalized, such as the earlier Harvard reference data, and explains why so many of the first classification schemes based on the Harvard reference data (e.g., Gomez and Wellcome classifications) used percent-of-median (Gorstein et al., 1994).Use of percent-of-median does not provide the same information as the Z‑score, and the relationship between these two criteria differs with age and height. Such discrepancies may be especially important if intervention activities are prioritized across populations according to the prevalence of low anthropometric indices. A comparison of selected Z‑scores and percent-of-median curves for weight-for-height, height-for-age, and weight-for-age is given in Gorstein et al. (1994).
A further limitation of the percent-of-median is that, unlike percentiles or Z‑scores, the interpretation of specific percent-of-median varies across age groups and growth indices Table 13.3. This arises because the calculation of the percent-of-median does not take into account the distribution of the data within the reference set, and particularly the differing widths of the distributions of the weight-for-age, weight-for-height, and height-for-age indices (Waterlow et al., 1977). Indeed, it is this variability that inhibits the universal use of a constant percentage of the reference median (e.g. 70%) across all ages and for all growth indices. For example, 60% of median weight-for-age represents a more severe state of malnutrition for younger than for older children. Moreover, when the index weight-for-height is used, 60% of the median is inappropriate; such a deficit at any age is incompatible with life (Dibley et al., 1987).
13.2 Use of anthropometric indices in clinical settings
Anthropometry in clinical settings has the following applications for individuals: screening for early detection of abnormal changes in growth, and assessing the response of an individual to therapy (WHO, 1995). Increasingly, the three conventional growth indices (weight-for-age, length/height-for-age, and weight-for-length/height) are used together with BMI for children age 0–19y, all expressed as either percentiles or Z‑scores. Recumbent length is the recommended measurement for children younger than 24mo, whereas in those aged ≥ 24mo, standing height should be used.Health care providers who measure and assess the growth of children or supervise these activities can access the WHO Training Course on Child Growth Assessment which provides instructions on both measuring a child's growth and interpreting growth indicators manually using the WHO international growth reference charts. The course is available from (WHO).
Alernatively, software can be used to compute percentiles or Z‑scores for the three growth indices (weight-for-age; length/height-for-age; and weight-for-length/height) and BMI-for age for a child aged from 0–19y using two modules — Anthropometric calculator and Individual assessment — both available in WHO AnthroPlus 2009. Calculations are based on the WHO Child Growth Standard for children 0–5y (WHO, 2006) and the WHO Growth Reference for children aged 5–19y (de Onis et al., 2007).
13.2.1 Screening to identify abnormal growth
Accurate measurements of weight and length or height on each child are needed. WHO has developed an Anthropometry Training Video which can be downloaded from WHO. Box 13.3 summarizes some of the points emphasized by WHO to ensure the collection of accurate growth data.- Make sure all equipment is correctly calibrated on a regular basis.
- Conduct training based on recommended measurement protocols as well as standardization sessions for those who collect the data.
- Take the child's date of birth from a written record if available. Otherwise ask for both the child's date of birth and age on the day measured, since the year of birth is frequently reported incorrectly. If birth dates are not recorded or known with certainty, probe the caregiver for the approximate date of birth based on a local events calendar.
- If WHO AnthroPlus is used, the software calculates the precise age, depending on the age of the child in days (for those aged 0–60mos) or months (for those aged 5–19y). Alternatively, secure the WHO child age calculator consisting of a rotating disk mounted on a calendar in polyvinyl chloride film, if attending a training workshop in a regional WHO Regional Office.
- Measure and record recumbent length in children younger than 24mo or standing height from 24mo onwards, where possible. There is a 0.7cm difference between length and height. If a child older than 2y is measured lying down instead of standing, then 0.7cm is subtracted by the software to derive an estimated height. Alternatively, if a child younger than 24mo is measured standing, then 0.7cm is added by the software to derive an estimated length.
- Record whether the child has edema or not before measuring the child's weight: edema is a clinical sign of severe undernutrition that can mask a very low weight. To check for the presence of edema, grasp the child's foot so that it rests in your hands with your thumb on top of the foot. Press the thumb down gently for a few seconds. If a pit (dent) remains in the foot after lifting your thumb, then the child has edema. No weight measurement should be taken if edema is present.
- Once the data on age, sex, weight, and length/height have been recorded, check the results and if the child appears to have extreme Z‑score values, the child should be re-measured immediately. Note: calculating the Z‑score values before proceeding with the measurement of the next subject is good practice.
Z‑score | Length/height- for-age | Weight-for age | Weight-for- length/height | BMI-for-age |
|---|---|---|---|---|
| Above 3 | See note 1 | See note 2 | Obese | Obese |
| Above 2 | Overweight | Overweight | ||
| Above 1 | Possible risk of overweight (See note 3) | Possible risk of overweight (See note 3) | ||
| 0 median | ||||
| Below −1 | ||||
| Below −2 | Stunted (See note 4) | Underweight | Wasted | Wasted |
| Below −3 | Severely stunted (See note 4) | Severely underweight | Severely wasted | Severely wasted |
13.2.2 Screening to identify abnormal changes in growth
In general, to identify abnormal changes in growth, measurements in a child should be repeated at monthly intervals during the first 6mo, then every 2–3mo during later infancy and early childhood, and then every 6–12mo (Guo et al., 1991). Special attention must be given when measuring length in children below 2 years of age; guidelines are available in FANTA Anthropometric Guide (2018).Such serial measurements provide information on the pattern of growth over time. This enables a child with failure to thrive to be identified. Abnormal growth is apparent from the direction of the growth curve: an abnormal height-for-age growth curve is horizontal or, in the case of weight-for-height, moves downwards. The former indicates that the child is not growing, and the latter shows that the child is losing weight. Such a trend may indicate that the child has been ill. Alternatively, the trend may be desirable if the child is overweight. Consult the WHO Training Course on Child Growth Assessment for more examples.
As an example, Figure 13.7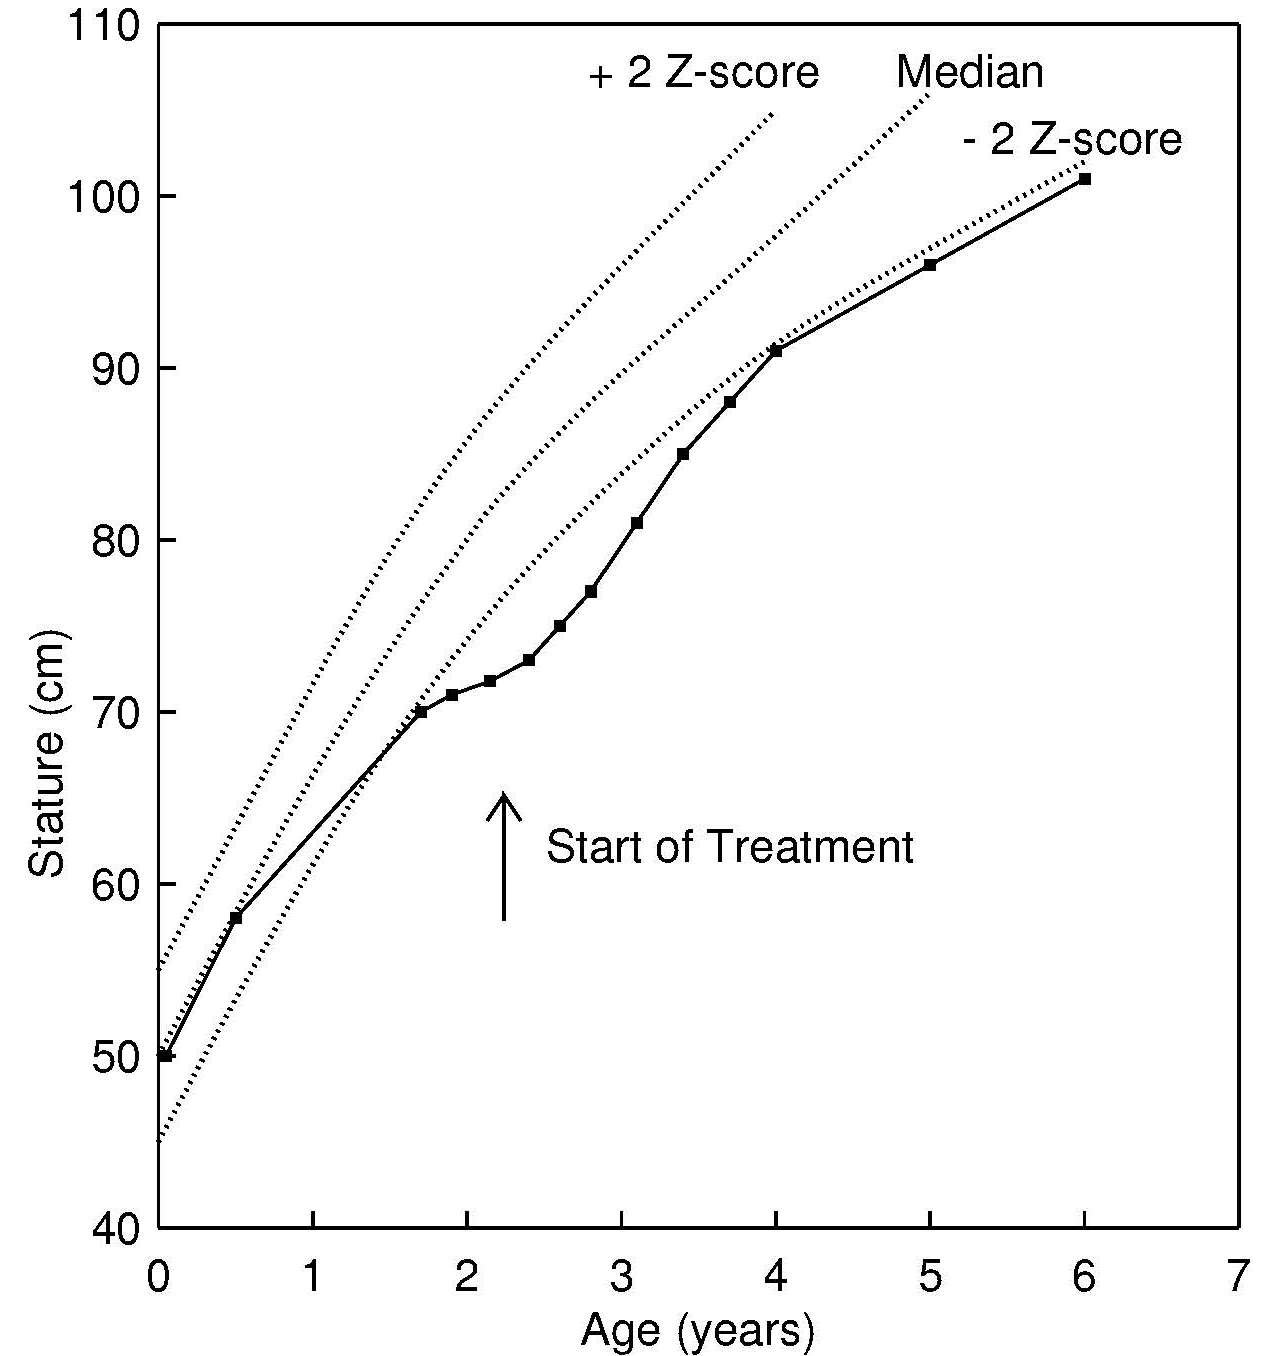
When a child exhibits deceleration or slow growth of length or height, as shown in Figure 13.7, then the child must be evaluated to distinguish between a shifting of linear growth, sometimes termed “rechanneling”, constitutional growth delay, and underlying pathology. Any shift in linear growth is determined by genetic influences, and tends to occur within the first 18mos of life, when the growth of an apparently healthy child may cross one or more Z‑score or percentile lines. In contrast, the exact cause of constitutional growth delay is unknown. It occurs later than rechanneling, and is characterized by a temporary delay in skeletal growth and height of a child, and is not accompanied by any other physical abnormalities causing the delay. Alternatively, slow growth can arise from many pathological conditions, such as malnutrition (Figure 13.7), chronic disease (e.g., tuberculosis), non-organic failure to thrive (caused by a severe psychosocial disturbance in the family), or organic disorders. The latter may encompass congenital and acquired disorders, or abnormal function of the endocrine system or metabolism, and gastrointestinal dysfunction (e.g., malabsorption); details are given in WHO (1995). Guidelines on how to investigate causes of undernutrition in a child are given in the WHO Child Growth Training Course described earlier.
Although changes in a child's growth are apparent on distance growth charts, abnormal changes in the rate of growth of a child can be detected much earlier when growth velocity charts, rather than distance growth charts, are used: growth velocity measurements are much more sensitive to recent changes in growth but require careful measurement procedures to be of value. WHO has developed a set of growth velocity charts which are recommended for international use (de Onis et al., 2011).
The prevalence of overweight and obesity is increasing globally in children younger than 5y, and is an important contributor to diabetes and other noncommunical diseases in later life. The WHO Child Growth Training Course provides guidelines on how to investigate causes of overweight and obesity in infants and children 0–6mo; 6mo–2y; and 2–5y.
Trends in pediatric overweight and obesity in the United States are an ongoing serious health concern as about 17% of U.S. children and adolescents are obese. In the U.S., the use of BMI in association with the CDC (2000) BMI percentiles are recommended by the U.S. Endocrine Society to diagnose overweight or obesity in children and adolescents > 2y. Overweight is diagnosed in the U.S. if a child or adolescent > 2y has a BMI > 85th percentile but < 95th percentile for age, as obese if the BMI is > 95th percentile, and as extremely obese if the BMI is > 120% of the 95th percentile or > 35kg/m2 (Styne et al., 2017). They recommend calculating, plotting, and reviewing a child's or adolescent's BMI percentile at least annually during well-child and/or sick visits, and if a child or adolescent has a BMI > 85th percentile, then they should be evaluated for potential comorbidities. The Endocrine Society also provides advice to prevent obesity; for more details see Styne et al. (2017).
13.2.3 Assessing response to therapy
Serial measurements are also useful when assessing the response to therapy, as shown in Figure 13.7; again at least two anthropometric measurements are required. Selection of the indicator of response to the therapy must be made carefully. It must take into account the possible time lag between the start of the intervention and the time when a response is apparent.In the example shown in Figure 13.7, the child was enrolled in a 2y intervention program because at age 2y the child's length-for-age growth curve fell below the −2 Z‑score reference, at which point the curve tended to flatten out, indicating that the child was growing slowly. After 2 years of treatment, catch-up growth in response to the therapy is clear, although the child did not approach the −2 Z‑score reference until she was 4y.
An infant with severe acute malnutrition (SAM) is known to respond to a nutrition intervention by first putting on weight, only later “catching” up in linear growth. Consequently, the recommended discharge criteria from a therapeutic feeding program for a child with SAM defined by a weight-for-height < −3 Z‑score (based on the WHO Child Growth Standard) is when the child has reached a weight-for-height above −2 Z‑score and no edema (WHO/UNICEF, 2009). These discharge criteria are based on the lower risks of mortality compared to those children below −3 Z‑score, as shown in Figure 13.8.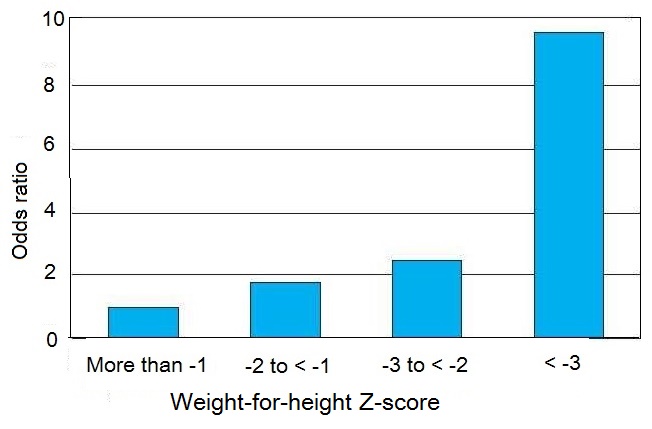
13.3 Screening systems to identify individuals at risk in a population
Anthropometry has a range of applications that can be used at the population level. Increasingly, screening systems are being used to map countries according to levels of severity of malnutrition (UNICEF/WHO/World Bank, 2021), and to identify priority countries for action. Screening systems are also being used to monitor progress across countries in an effort to mobilize countries to achieve the Sustainable Development Goals.In public health, it is often not possible to obtain serial measurements on the same individuals to identify abnormal changes in growth, as described in the clinical setting in Section 13.2.2. Instead, screening systems are used to identify individuals in a population “at risk” to malnutrition and who may require intervention. Some screening systems are used only in emergency settings, when low-cost portable equipment and the use of trained unskilled personnel are primary considerations. In such circumstances, only one anthropmetric measurement (e.g., MUAC) may be taken. All the systems use at least one anthropometric meaurement and one or more reference limits drawn from appropriate reference data. In some cases, cutoff points based on functional impairment or clinical signs of deficiency or mortality risk may be used.
An optimal screening system is one in which no misclassification occurs; all the individuals designated as “at risk” are actually malnourished (i.e. there are no false positives; sensitivity is 100%). Similarly, those individuals classified as “not at risk” are truly unaffected (i.e. there are no false negatives; specificity is 100%).
In practice, classification schemes are not perfect; some misclassification will always occur so that some individuals identified as “at risk” to malnutrition will not be truly malnourished (false positives), and others classified as “not at risk” to malnutrition will in fact be malnourished (false negatives). Unfortunately, specificity and sensitivity data for the anthropometric indices selected are usually not known for the target population. Instead, when selecting a screening system, values for sensitivity and specificity obtained elsewhere are often used and assumed to be appropriate for the target population (Habicht et al., 1979; 1982).
Unfortunately, literature values for sensitivity and specificity are unlikely to apply to the target population when the indices assess an outcome (e.g. low birth weight) which is influenced by several biological factors. For example, low birth weight can be due to both prematurity and intrauterine growth retardation, and its sensitivity as an indicator of neonatal mortality is greater for the former than the latter (WHO, 1995). Factors such as the severity of the deficiency, age, and sex may also affect the magnitude of the expected response of the chosen indicator. A detailed discussion of the selection criteria for indicators can be found in Habicht et al. (1982) and Habicht and Pelletier (1990).
A more general way of selecting an optimal screening system is shown in Figure 13.9,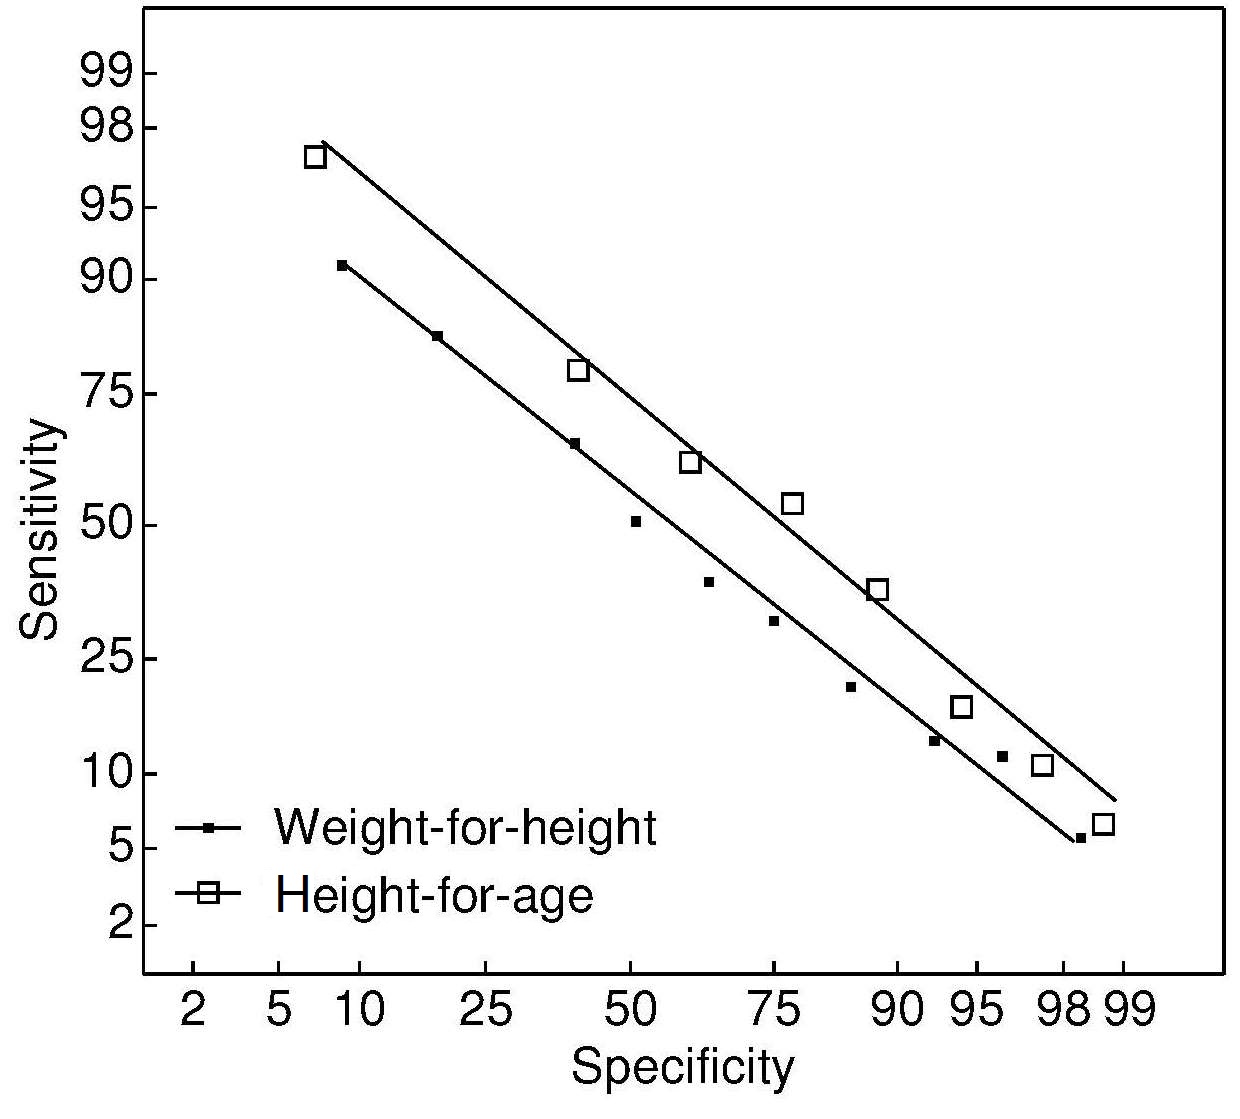
In many of the early classification systems, cutoff points were defined as a designated percentage of the median of the reference population, for the reason outlined earlier. Now the approach preferred by WHO is to use reference limits based on Z‑scores (WHO, 1995). Examples of screening systems that use this approach and are based on a single anthropometric index or a combination, and that can be used to classify individuals in a population “at risk” to malnutrition are outlined below.
13.3.1 Use of weight-for-length/height for young children
As noted earlier, low weight-for-length/height is described as “thinness” and reflects a pathological process referred to as “wasting”. It arises from a failure to gain sufficient weight relative to length or height, or from losing weight. The prevalence of wasting in a population is defined as the proportion of children with a Z‑score for weight-for-length or height less than −2 (i.e., < 2SDs below the age- and sex-specific WHO reference mean). Wasting is said to represent acute malnutrition which should be treated with an acute intervention to reverse the wasting and prevent death. The onset of wasting is often highly seasonal with an onset that is fairly acute and often associated with both changes in the food supply and the prevalence of infectious diseases. The highest prevalence of low weight-for-length often occurs during the postweaning period (12–23mos) (WHO, 1986).WHO further classify low weight-for-length/height as:“moderate acute malnutrition” when the weight-for-length/height is between −2 and −3 Z‑score, and “severe acute malnutrition” (SAM) if the Z‑score is below −3 of the WHO Child Growth Standards (WHO/UNICEF, 2009). Treatment of children with moderate acute malnutrition involves improving their existing diets by nutritional counseling to ensure consumption of nutrient-dense foods that meet their additional needs for weight and length gain and functional recovery. Only in settings where there is a high prevalence of wasting or food insecurity at the community or household level should food supplements, usually fortified blended flours, be provided (WHO/UNICEF/WFP/UNHCR, 2009). For more details on the nutrient needs of children with moderate acute malnutrition, see Golden (1990).
Currently, children with SAM (weight-for-length/height Z‑score below −3) are treated most frequently with Ready-to-Use Therapeutic Foods or F75 and F100 milk-based diets; for more treatment details see WHO (2013). WHO recommends that all children with SAM who also have medical complications, severe edema, poor appetite, or present with one or more Integrated Management of Childhood Illness danger signs, should be admitted to hospital for inpatient care. Transfer of children with SAM from inpatient to outpatient care should be based on the clinical condition of the children and not on specific anthropometric outcomes. Justification for the use of weight-for-length/height Z‑score below −3 for identifying SAM is shown in Box 13.4.
- Risk of death for children with a weight-for-height below −3 Z‑score is much higher than for children with weight-for-height Z‑score above −3 Z‑score (see Figure 13.8);
- Children with weight-for-height Z‑score below −3 Z‑score have a higher weight gain when receiving a therapeutic diet compared to other diets, resulting in faster recovery;
- There are very few children below −3 Z‑score (i.e., < 1%) in a well-nourished population;
- Use of the recommended protocols and appropriate therapeutic foods is not associated with any known risk or negative effects on the children.
As noted earlier, the WHO recommended criterion used for discharge when weight-for-height has been used as an admission criterion is when weight-for-height reaches > −2 Z‑score with no pitting edema (WHO, 2013). This discharge criterion is based on the lower risks of mortality compared to those children below −3 Z‑score as shown in Figure 13.8. Percentage weight gain should no longer be used as a discharge criterion (WHO, 2013).
Note that use of the new WHO Child Growth Standard in low income countries has resulted in a 2–4 times increase in the number of infants and children falling below −3 Z‑score compared to using the former NCHS / WHO reference population published by WHO in 1983.
Overweight in young children is becoming increasingly common, as noted earlier. Although WHO defines any child as overweight with a weight-for-length/height Z‑score above +2, and as obese with a weight-for-length/height Z‑score above +3, increasingly BMI-for-age Z‑scores are being used to define risk of overweight, overweight, and obesity in children.
13.3.2 Use of MUAC for children
Mid-upper-arm circumference (MUAC) is used for screening individual children for targeting interventions in the community when weight and stature measurements are impossible and the precise age of the child is unknown. In such cases, a fixed cutoff point for MUAC is often used. For example, to diagnose children with SAM aged 6–60mo, WHO (2009) recommends a fixed MUAC cut-off point of 115mm as one of the independent criteria that can be used by trained community health workers and community members. This MUAC cutoff was chosen because children with a MUAC less than 115mm were observed to have a highly elevated risk of death compared to those with a MUAC above 115mm (Myatt et al., 2006). In addition, the prevalence of SAM based on a MUAC cutoff of 115mm and that defined by a weight-for-height below −3 Z‑score based on the new WHO Child Growth Standard is believed to be similar, based on an analysis of measurements on more than 450,000 children aged 6–60mo in 31 countries. Table 13.5.| Indicator | Measure | Cut-off |
|---|---|---|
| Severe wasting2 | Weight-for-height1 | < −3 Z‑score |
| Severe wasting2 | MUAC | < 115mm |
| Bilateral edema3 | Clinical sign |
The WHO recommended discharge criteria from treatment for children diagnosed with SAM using the MUAC cutoff is based on a MUAC > 125mm and no edema for at least 2wk. If children have been admitted based only on bilateral pitting edema, then the criteria for discharge should be the one used in programs. To avoid any relapse, children with SAM who have been discharged from treatment should be monitored periodically (WHO, 2013).
Concerns have been raised over the use of the MUAC cutoff alone as a prognostic indicator of mortality. As an example, Grellety and Golden (2018) claim that up to 45% of SAM children at high risk of death will not be identified using this approach. This finding was based on an examination of the relative mortality rates of children 6–60mos who had SAM (n=76,887) classified by the three diagnostic criteria depicted in Table 13.5. Instead, these investigators urge that the use of weight-for-height Z‑scores should be retained as an independent criterion for diagnosis of SAM, and innovative methods developed to identify those children with a low weight-for-height Z‑score but not a low MUAC in community screening programs. In the interim, they suggest that use of both a weight-for-height < −3 Z‑score and MUAC < 115mm should be retained and used routinely as diagnostic criteria for SAM in an effort to identify those children who should receive treatment.
Use of a fixed cutoff assumes that MUAC is relatively independent of age for children 1–5y (Burgess and Burgess, 1969). This assumption has been questionned by several investigators. Data from both affluent and nonaffluent populations show that MUAC is age dependent, resulting in over-diagnosis of wasting among younger children and under-diagnosis among older ones, when a fixed cutoff point is used (de Onis et al., 1997). In view of these concerns, WHO has developed MUAC-for-age reference data for children 6–60mo (Figure 13.10).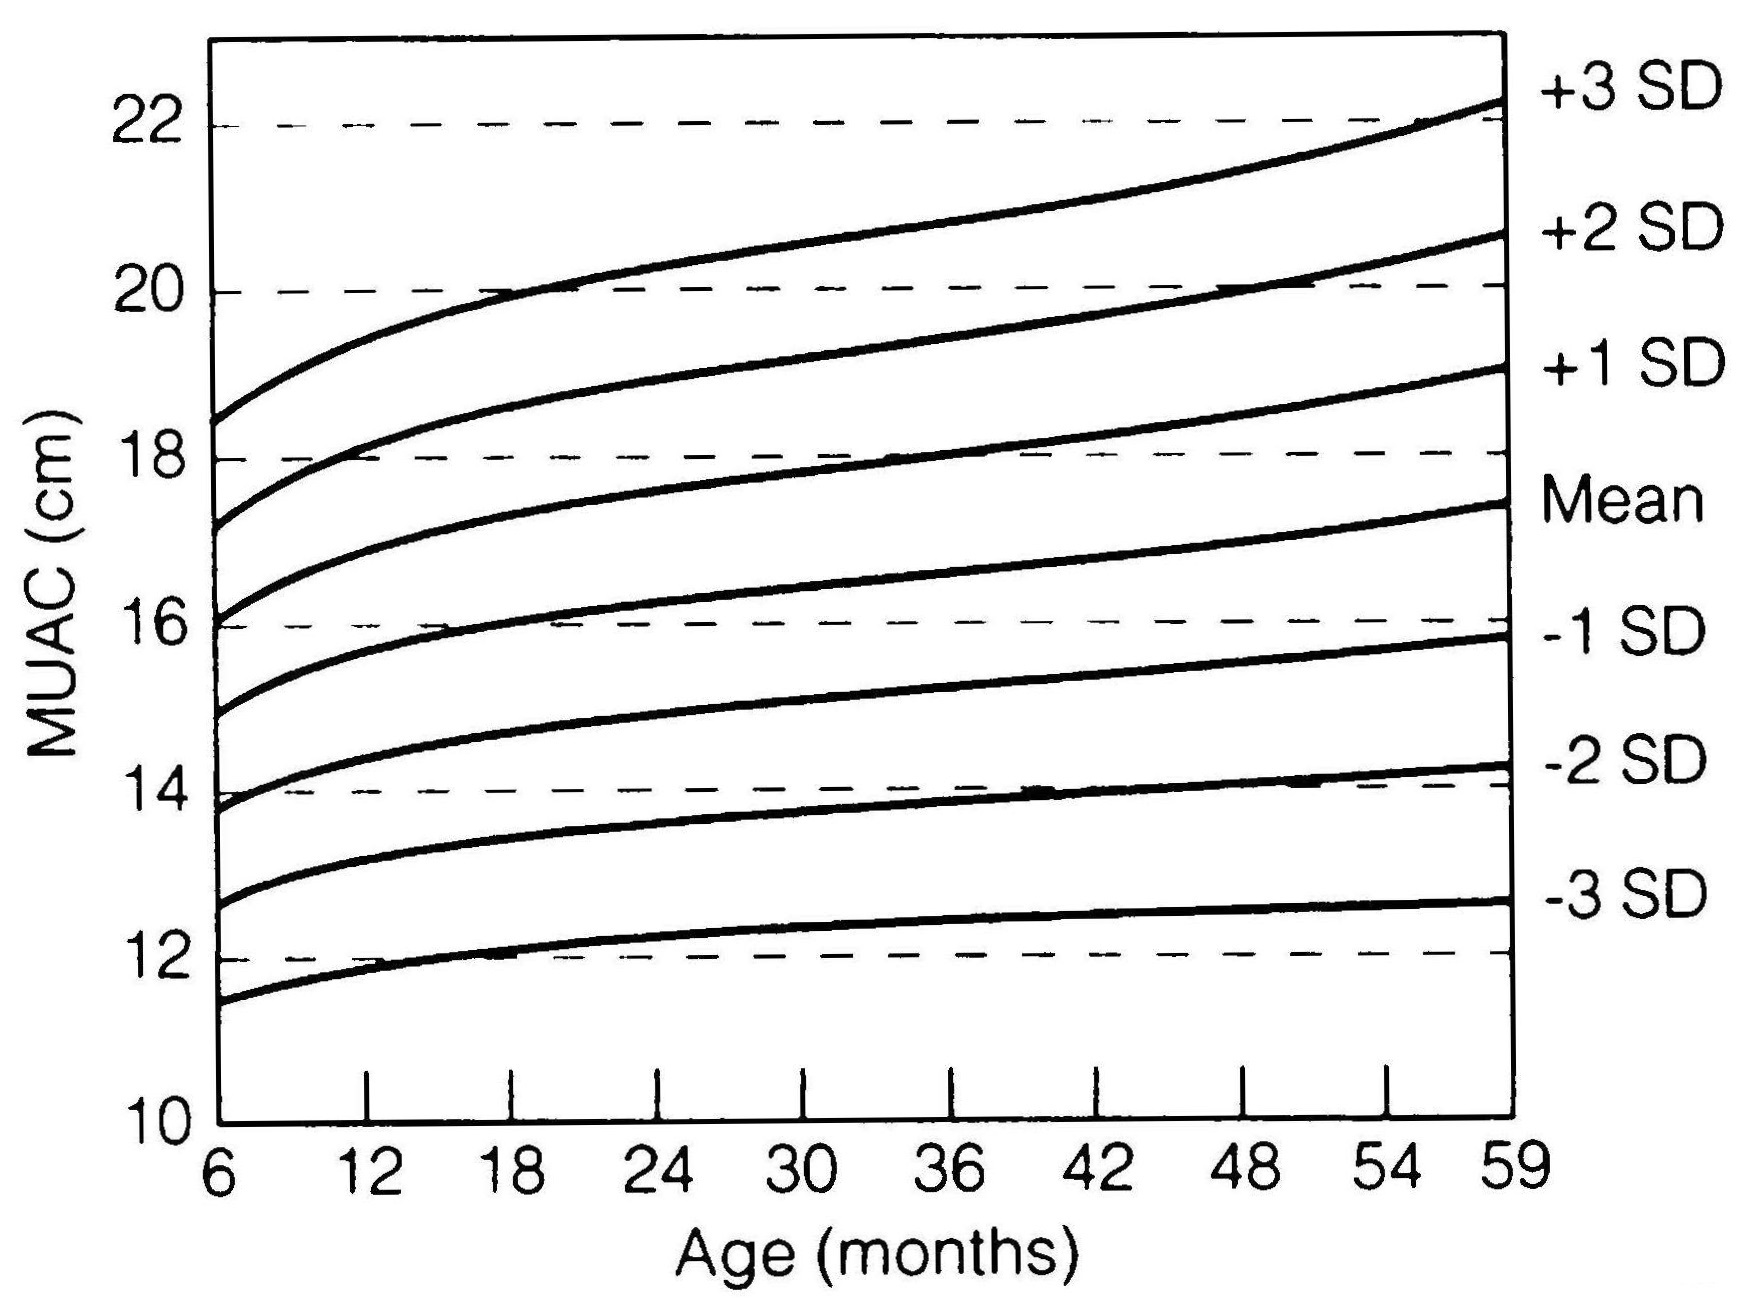
13.3.3 Use of MUAC and Calf Circumference for adults
The importance of adult undernutrition is becoming increasingly recognized. Both the Food and Agricultural Organization (FAO) and WHO have adopted BMI to assess adult undernutrition and have defined cutoffs grading the severity of low BMI in adults. However, in emergency situations, measurements of weight and height, required to calculate BMI, are difficult to obtain from severely emaciated individuals who often cannot stand unaided. Therefore, MUAC and calf circumference, measurements that only require a tape measure, have been investigated as a substitute for BMI.Significant correlations between measurements of MUAC and BMI have been demonstrated in women of reproductive age (Khadivadeh, 2002), and severely under-nourished adult populations from low-income countries (Collins, 1996). Reports of positive associations between calf circumference and BMI have been primarily reported in clinical settings and mostly in the elderly (Aparecida et al., 2012). However, there is little known about the relationships between both MUAC and calf circumference (CC) and health outcomes in adults.
WHO has proposed universal cutoff values for MUAC of 22cm for females and 23cm for males, and below 31cm for calf circumference (for both sexes) to screen for undernutrition (WHO, 1995). However, in view of the reported regional and ethnic variations in body composition, these cutoff values may not be appropriate for Asian populations who have a higher proportion of body fat than other races (e.g., Caucasians and Africans) (Deurenberg et al., 1998) (see Chapter 11).
As an example, in a study in northern Vietnam of women of reproductive age (n=4,981), a higher MUAC cutoff (23.5cm) was used to screen for underweight in comparison to the BMI. This 23.5cm MUAC cutoff had a sensitivity of 89.1%, a specificity of 71%, and a positive predictive value of 84% when analyzed using ROC curves. If the lower WHO cutoff (22cm) had been used, many women at risk for undernutrition would have been misclassified as healthy. By contrast, the calf circumference cutoff proposed by WHO (31cm) was found to be appropriate, although slightly less accurate than the MUAC cutoff for predicting underweight (Nguyen et al., 2014). More studies are needed to examine the utility of MUAC and calf circumference in predicting functional outcomes.
MUAC during pregnancy has also been investigated as a screening tool for risk of low birth weight and late fetal and infant mortality. Maternal arm circumference is relatively stable during pregnancy, so its measurement is independent of gestational age (Mohanty et al., 2006). Several investigators have reported that MUAC, when used as a proxy of nutritional status of women during pregnancy, is a strong predictor of maternal mortality (Christian et al., 2008) and fetal outcomes such as low birth weight (Mohanty et al., 2006; Assefa et al., 2012). In contrast, calf circumference is not recommended as a proxy measurement of status during pregnancy. Edema is increasingly common as pregnancy advances, so calf circumference may be increased particularly in late pregnancy (WHO, 1995).
13.3.4 MUAC-for-height: QUAC stick
The Quaker arm circumference measuring stick (QUAC stick) was developed as a rapid, cheap, and simple screening tool for the nutritional assessment of children. It avoids the use of cumbersome scales and minimizes errors in measuring height (Arnhold, 1969). The measuring stick is used to compare a child's MUAC with the two reference limits of the MUAC reference data corresponding to the child's height.The modified QUAC stick developed by WHO uses MUAC-for-height data from the MUAC-for-age reference for children < 5y (de Onis et al., 1997; Mei et al., 1997). Three sets of MUAC-for-height curves were developed: one for boys, one for girls, and one for both boys and girls combined. The curves are for children of height 65–145cm. Recumbent length measurements were adjusted to standing height when the MUAC-for-height reference data were constructed to eliminate any discrepancy caused by differences in the two stature measurements.
Mei et al. (1997) also provide instructions on the construction and use of the modified QUAC stick shown in Figure 13.11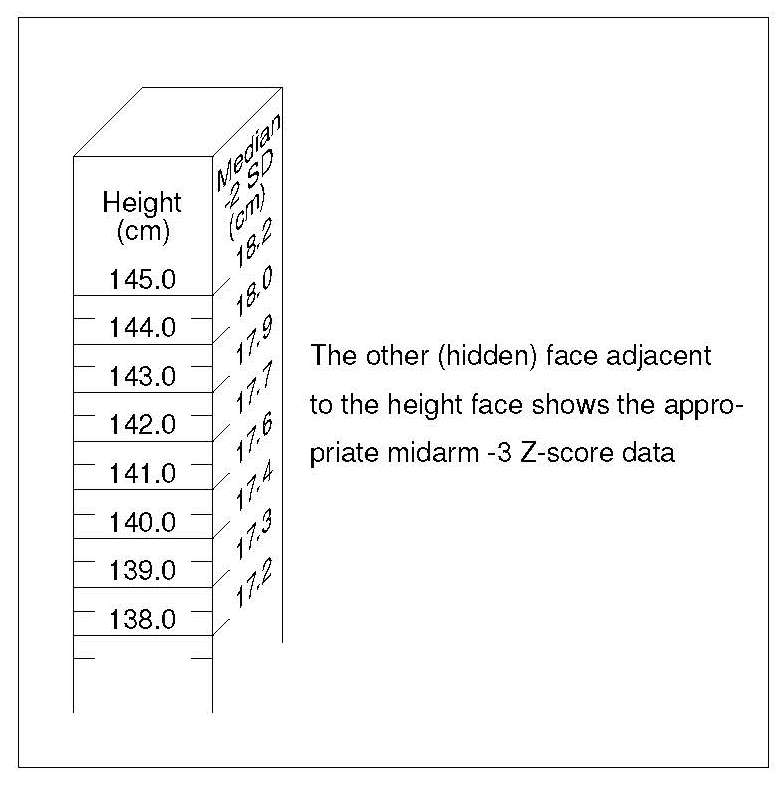
The WHO-modified QUAC stick consists of a vertical stick, about 150cm long and 3 × 3cm in cross-section. One face is marked from 0 at the bottom up to 145cm near the top in 0.5cm increments. On one adjacent face, the corresponding reference values for the median −2 Z‑score of MUAC-for-height are marked; the other face, adjacent to the height measurements, shows the values for median −3 Z‑score of the MUAC-for-height.
To use the QUAC stick, it is first placed firmly upright on a platform against a vertical wall. The child is then asked to stand straight with his or her back against the height measure. Next, the MUAC of the child is measured using the technique described in Chapter 11. Then a note is made about whether the value is below that given on the “median −3 Z‑score” face at the point on the stick marked by the child's height. If the measurements is below this value, the child is noted as having a severe nutritional deficit; if above and yet still below the appropriate value on the “median −2 Z‑score” face, the deficit is recorded as moderate. In this way, all children are identified as having severe, moderate, or no deficit. Note that the method eliminates the necessity of recording both the height and MUAC of the child for subsequent comparison with reference data.
The performance of MUAC-for-height for screening was evaluated using weight-for-age < −2 Z‑score as the “gold standard” for identifying malnourished children (Mei et al., 1997). Results indicated that the sensitivity and specificity for MUAC-for-height was better than MUAC based on a fixed cutoff for screening malnourished children 6–59mo from Sri Lanka, Nepal, Togo, and Malawi.
13.3.5 Weight-for-height wall chart
A wall chart developed by Nabarro and McNab (1980) is based on weight-for-height and three percentage ranges of the corresponding median weight-for-height of the earlier NCHS reference data. These are 70%–80%, 80%–90%, and 90%–110%. Wasted children are identified as those with a percentage weight-for-height less than 80% of the reference median. The chart has the advantage of visually identifying the extent of wasting in a very simple manner. In addition, during nutritional rehabilitation, a target weight can be readily identified. The chart is fixed to a smooth wall, and the child is positioned on a level floor against the chart at a point corresponding to the child's weight (Figure 13.12).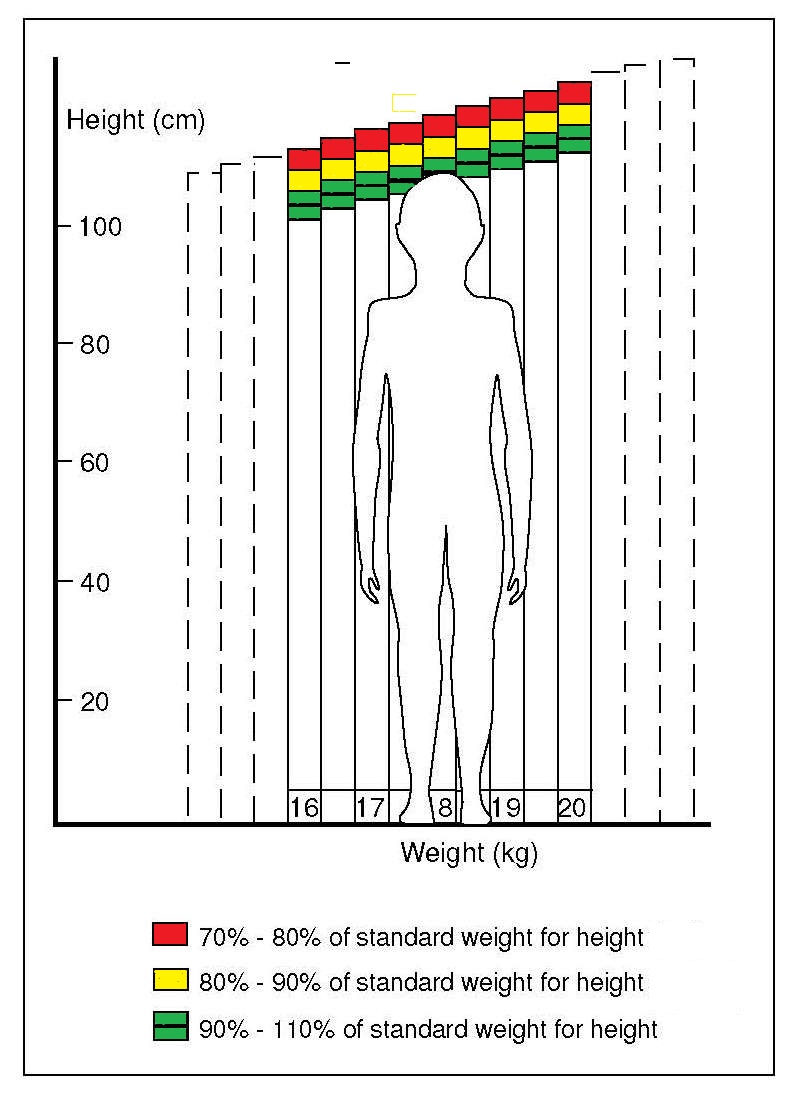
For small children, two persons may be required to position the child correctly for the measurement. To avoid misclassifying children with edema or ascites (fluid in the abdominal cavity), a brief clinical examination should also be undertaken. The charts can be modified to include different colors, numbers of colors, and alternative growth reference data and reference limits, depending on the resources and needs of the population.
13.3.6 Use of Body Mass Index for children
In view of the increasing worldwide prevalence in under-five children of overweight and obesity, and their subsequent role in diabetes and other chronic diseases in adulthood, WHO has endorsed “reduce and maintain childhood overweight to less than 3%” as one of the six global nutrition targets (Box 13.1; WHO, 2014). The worldwide prevalence of overweight and obesity among preschool children has increased from 4.2% (95% CI:3.2%, 5.2%) in 1990, to 6.7% (95% CI: 5.6%. 7.7%) in 2010, and is expected to have reached 9.1% (95% CI:7.3%, 10.9%), or about 60 million in 2020 (de Onis & Lobstein, 2010).Body mass index (BMI) is considered the most practical, universally applicable, and non-invasive index of overweight and obesity. An increased BMI-for-age in childhood and adolescence is associated with higher percentages of body fat and known risk factors for cardiovascular disease.
The WHO defines a child 0–5y as “at risk of overweight” if BMI Z‑score is > +1 and < +2; “overweight” if BMI Z‑score > +2 and “obese” if BMI Z‑score > +3, based on the WHO Child Growth Standard (WHO, 2006; de Onis & Lobstein, 2010). For children aged 5–19y, BMI-for-age Z scores above +1 and above +2 based on the WHO 2007 growth reference data (de Onis et al., 2007) are applied to define overweight and obesity, respectively.
13.3.7 Use of Body Mass Index for adults
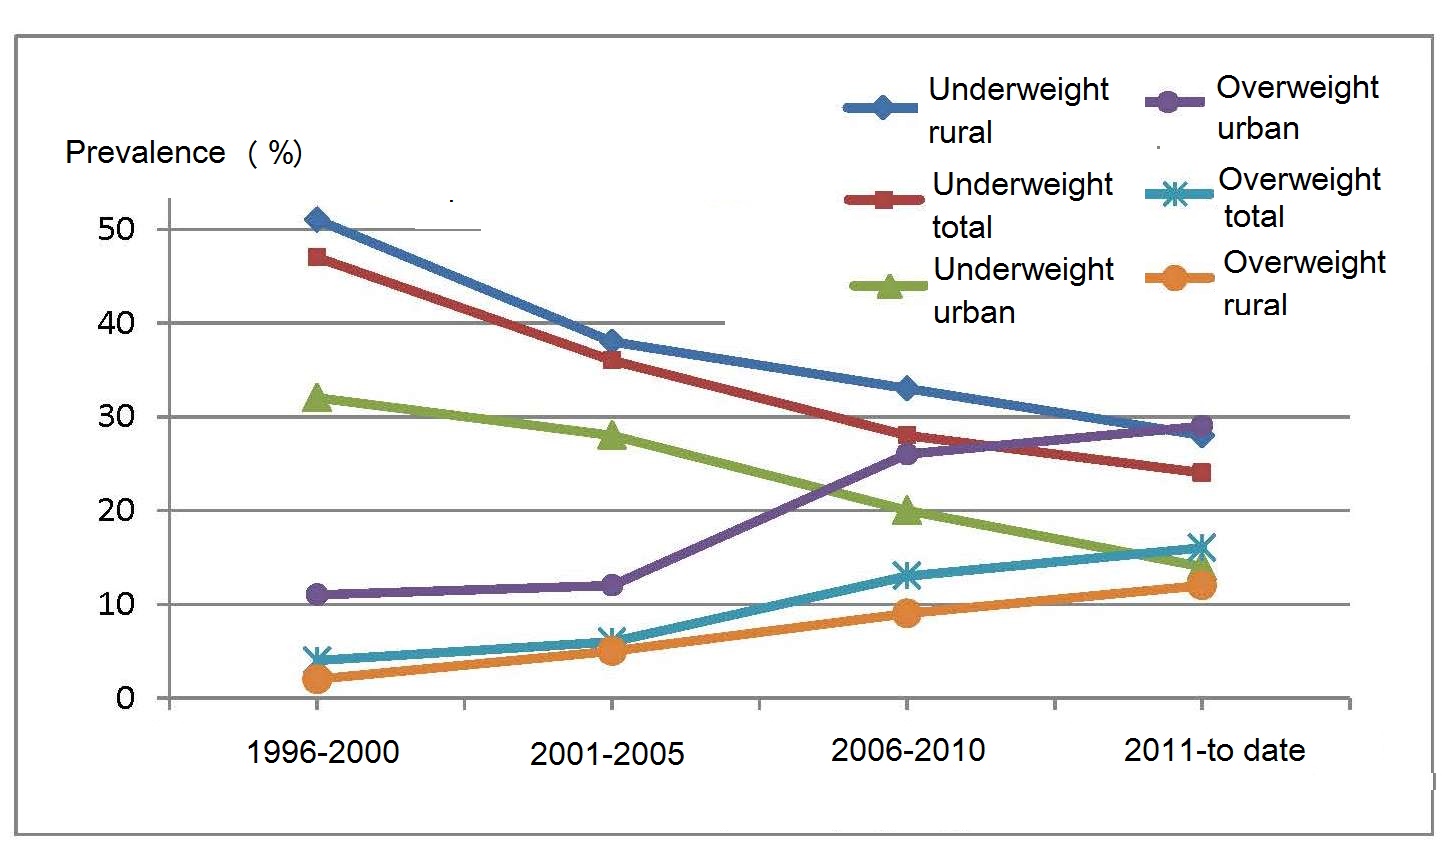
Over the past few decades both low- and middle-income countries have faced a double burden of malnutrition as a result of the rapid increase in the prevalence of overweight together with a persistent prevalence of underweight. For example, in 2016, the global estimate among adults for overweight or obesity was more than 33% while underweight was 10% (NCD Risk Factor Collaboration, 2017). Both conditions are associated with increased morbidity and mortality and increase the risk of developing non-communicable diseases (Zhang et al., 2021; NCD Risk Factor Collaboration, 2017). This increasing trend for a double burden of malnutrition has been attributed to unequal changes in food production, dietary patterns, and physical activity as communities have encountered the nutrition transition (Hoque et al., 2015).
WHO has recommended the use of a graded classification of overweight and obesity to:
- Compare weight status within and between populations
- Identify individuals and groups who are at increased risk of morbidity and mortality
- Identify priorities for intervention at both the individual and community levels
- Allow interventions to be evaluated appropriately
| Classification | BMI (kg/m2) | Risk of comorbidities |
|---|---|---|
| Underweight | < 18.50 |
Low (but risk of clinical problems is increased) |
| Normal range | 18.50–24.99 | Average |
| Overweight | ≥ 25.00 | |
| Pre-obese | 25.00–29.99 | Increased |
| Obese class I | 30.00–34.99 | Moderate |
| Obese class II | 35.00–39.99 | Severe |
| Obese class III | ≥ 40.00 | Very severe |
The general term “overweight” is used by WHO (2000) to describe all individuals with BMI ≥ 25kg/m2. Individuals with BMI from 25.0 to 29.9 are further termed “pre-obese”. Three classes of obesity are defined based on BMI cutoffs of 30, 35, and 40kg/m2. This classification system is not intended for use with pregnant and lactating women, or persons < 18y.
Although WHO recommends the universal use of these cutoffs internationally (WHO Expert Consultation, 2004), nevertheless WHO recognized that a substantial proportion of Asians were at high risk of type 2 diabetes and cardiovascular disease with BMIs lower than the existing WHO cutoff for overweight (i.e., ≥ 25kg/m2). (Figure 13.15).
Several investigators have studied the determinants of both underweight and overweight in low- and middle-income countries in an effort to develop country-specific strategies to reduce or halt the double burden of malnutrition. (Al Kibria, 2019), for example, using data from the national Demographic and Health Survey (DHS) in Nepal, examined the prevalence and factors affecting underweight, overweight, and obesity among adults in 2016. They followed the WHO recommendation and estimated the prevalence by sex over a broad range of BMI categories which included three for underweight and seven for overweight, as shown in Table 13.7.
| BMI cut-offs | Men | Women |
|---|---|---|
| ≤ 16.00 | 2.1 (1.7–2.5) | 3.5 (3.1–4.0) |
| 16.00–16.99 | 2.9 (2.5–3.4) | 3.9 (3.5–4.4) |
| 17.00–18.49 | 10.1 (9.3–10.9) | 10.5 (9.8–11.2) |
| 18.50–22.99 | 49.8 (48.5–51.2) | 43.2 (42.0–44.3) |
| 23.00–24.99 a | 15.9 (14.9–16.9) | 14.1 (13.3–14.9) |
| 25.00–27.49 b | 11.5 (10.7–12.4) | 11.6 (10.9–12.3) |
| 27.50–29.99 a | 5.2 (4.6–5.8) | 7.7 (7.1–8.3) |
| 30.00–32.49 b | 1.9 (1.6–2.3) | 3.4 (3.0–3.8) |
| 32.50–34.99 | 0.1 (0.0–0.7) | 1.5 (1.3–1.8) |
| 35.00–37.49 | 0.1 (0.0–0.7) | 0.5 (0.3–0.7) |
| 37.50–39.99 | 0.1 (0.0–0.2) | 0.1 (0.1–0.2) |
| ≥ 40.00 | 0.1 (0.0–0.1) | 0.1 (0.0–0.2) |
The increasing double burden of underweight and overweight in women during the preconception period is especially concerning as both are known to contribute to maternal and fetal complications during pregnancy (Salihu et al., 2009; Han et al., 2011). In a systematic review and meta-analysis of 34 studies, pre-pregnancy underweight (defined by a BMI < 18.5) contributed to a 32% higher risk of preterm birth, while for overweight women, the risk of preeclampsia and gestation diabetes mellitus approximately doubled, an effect that was even greater among women with pre-pregnancy obesity. These adverse effects of both underweight and overweight in the preconception period on pregnancy outcomes are likely to be amplified in adolescents or women with closely-spaced pregnancies and thus depleted nutrient reserves. These findings emphasize the importance of appropriate interventions to optimize maternal BMI in the pre-conception period (Dean et al., 2014).
13.3.8 Composite Index of Anthropometric Failure (CIAF)
The three conventional growth indices — weight-for-age, weight-for-height, and height-for-age — are described in Section 13.1; additional details are available in Chapter 10. Each index provides important information on different aspects of undernutrition (e.g., chronic versus acute) and can be used to select the most appropriate intervention.In many low income countries, weight-for-age is the most commonly used growth index for children, with the proportion underweight (i.e., weight-for-age Z‑score < −2) being used extensively globally as a proxy indicator to monitor progress in meeting the Millennium Development Goal to eradicate hunger. However, as discussed earlier and in detail in Chapter 10, underweight can be caused by stunting or wasting or a combination thereof and does not distinguish between them. Therefore, underweight when used on its own does not identify the sum of those children who are stunted and/or wasted, and thus provides an underestimate of the overall magnitude of undernutrition among children in the population. This is unfortunate because for policy and planning in a country, it is important to understand the overall scale of the problem of undernutrition to ensure sufficient resources can be allocated.
Consequently, an alternative classification system — termed the Composite Index of Anthropometric Failure (CIAF), has been developed by Nandy and Svedberg (2012), and is presented in Table 13.8.| Group | Description of the group | Definition |
|---|---|---|
| A | No anthro- pometric failure | Normal WAZ, HAZ, WHZ |
| B | Wasting only | WHZ < −2 SD but normal WAZ and HAZ |
| C | Wasting and underweight | WHZ and WAZ < −2 SD but normal HAZ |
| D | Wasting, under- weight & stunted | WHZ, WAZ and HAZ < −2 SD |
| E | Stunting and underweight | HAZ and WAZ < −2 SD normal WHZ |
| F | Stunting only | HAZ < −2 SD normal WAZ and WHZ |
| G | Stunted and overweight |
HAZ < −2 SD and WHZ > +2 SD |
| H | Overweight only | WHZ > +2 SD and WAZ > +2 SD normal HAZ |
| Y | Underweight only | WAZ < −2 SD normal HAZ and WHZ |
Comparison of the percentage of children classified as undernourished, based on the three conventional growth indices, and the CIAF using the new WHO Child Growth Standards for children under 5y have consistently shown more undernourished children using the CIAF than all the conventional indices (Nandy and Svedberg, 2012; Savanur and Ghugre, 2015). Children exhibiting multiple anthropometric failures are especially vulnerable.
With the emergence of the dual burden of malnutrition, the original CIAF model of classification for under-nutrition is no longer sufficient. This has led to the extension of the CIAF model include two new groups: “stunted and overweight”; and “overweight only”, as shown in Table 13.8. In some studies, BMI‑Z score has been used to define overweight instead of WHZ > +2 SD, with the BMI‑Z score cutoff varying according to the age group of the children (Bejarano et al., 2019). The CIAF extended model provides policy-relevant information on the pattern of child malnutrition in any country.
As an example, the use of the extended CIAF (ECIAF) to classify malnutrition due to both undernutrition and over-weight in children (n=10,679) age 3–13.99y was explored in a study involving six Argentine provinces. The percentage of preschool children 3–4.99y with malnutrition based on ECIAF was lower than in the school children 5–13.99y (15.1% vs. 28.4%). In the whole sample, about 25% of the malnutrition was caused by undernutrition and 75% by over-weight (Bejarano et al., 2019). Kuwornu et al. (2020) also used the ECIAF to measure the overall burden of early childhood malnutrition in Ghana from 2008–2011 for children 6–59mos based on three national surveys.
13.4 Applications of anthropometry in public health
- International comparisons of growth
- Identifying the determinants and consequences of malnutrition
- Targeting interventions
- Evaluating response to an intervention
- Nutritional Surveillance
| Group | Age Classes |
|---|---|
| Newborn children, infants and pre-school children |
0 to < 6mos 6 to < 12mos 12 to < 24mos 24 to < 36mos 36 to< 48mos 48 to < 69mos |
Three methods have been recommended by WHO to evaluate cross-sectional anthropometric data for use in public health. These three methods are itemized in Box 13.6. To calculate the prevalence estimates for stunting and overweight based on national population data, the reader is advised to use the WHO tracking tool to set national targets and monitor progress. Note wasting is excluded from the tracking tool because of its high short-term variability. See WHO Global Target Tracking tool for more details. However, these methods can also be augmented with more complex statistical techniques to identify the determinants and consequences of malnutrition, and to set targets and/or assess the response to interventions, depending on the study objectives.
- Comparison of the frequency distribution of anthropometric indices with appropriate WHO growth reference data using Z‑scores
- Summary statistics of the Z‑scores: mean; median; SD; standard error (SE) with the 95% confidence interval (CI) for each growth indicator
- Calculation of number and proportion of individuals (as %) with anthropometric indices below or above a designated cutoff (95% CIs)
13.4.1 international comparisons of growth
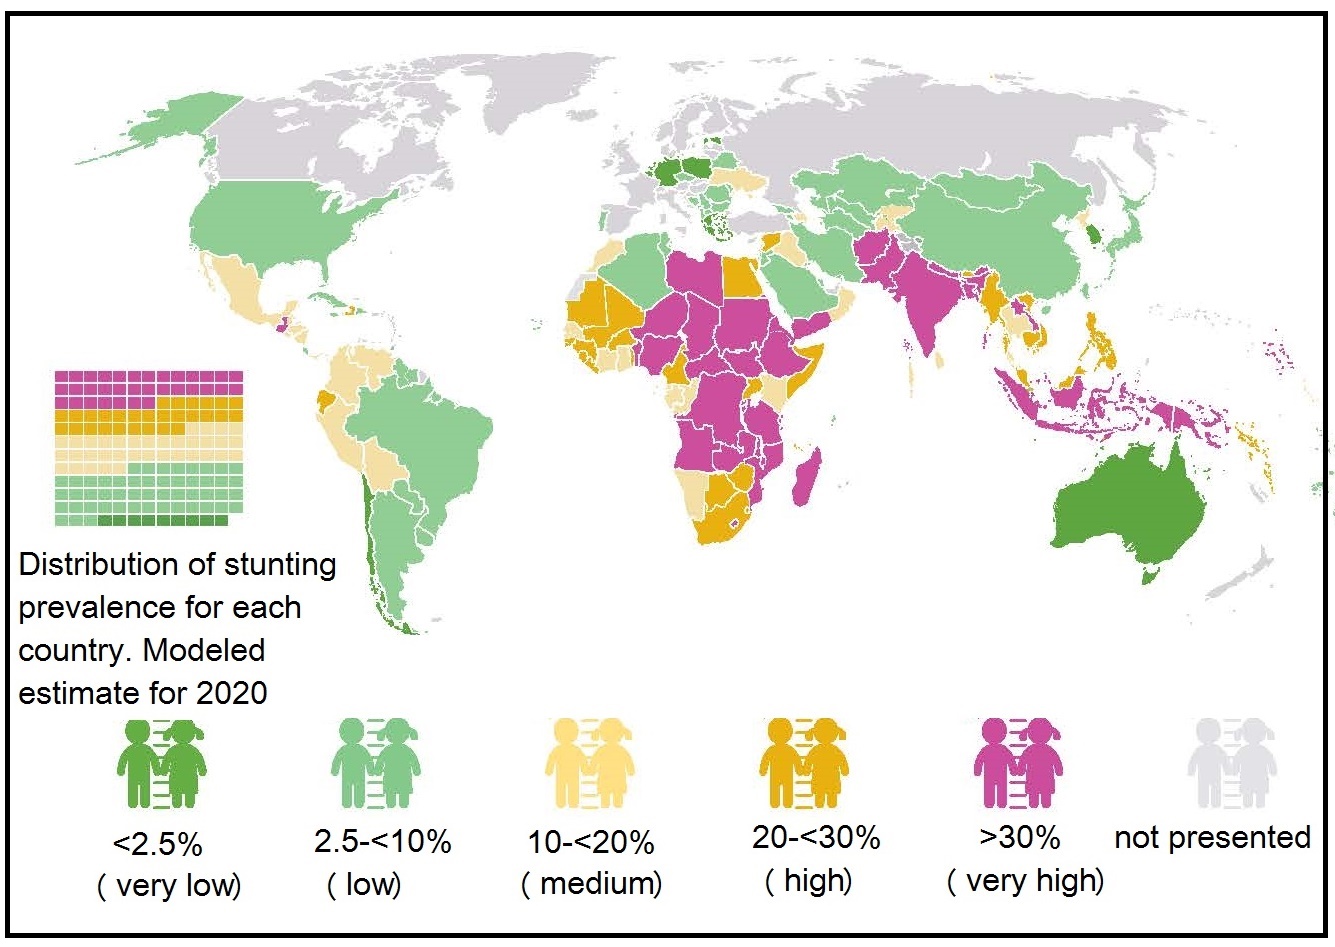
(UNICEF/WHO/World Bank Group, 2017) highlight the levels and trends in child malnutrition across countries based on the thresholds of severity shown in (Table 13.10).| Wasting | overweight | Stunting | |||
|---|---|---|---|---|---|
| Prevalence thresholds (%) | Labels | Prevalence thresholds (%) | Labels | Prevalence thresholds (%) | Labels |
| < 2·5 | Very low | < 2·5 | Very low | < 2·5 | Very low |
| 2·5–< 5 | Low | 2·5–< 5 | Low | 2·5–< 10 | Low |
| 5–< 10 | Medium | 5–< 10 | Medium | 10–< 20 | Medium |
| 10–< 15 | High | 10–< 15 | High | 20–< 30 | High |
| ≥ 15 | Very high | ≥ 15 | Very high | ≥ 30 | Very high |
As an example, Figure 13.17
depicts a modeled
percentage of children under 5y affected by
stunting in countries worldwide in 2020,
categorized by the five prevalence thresholds for
stunting presented in
Table 13.10.
Currently, no estimates exist on
children suffering simultaneously from two forms
of malnutrition such as stunting + overweight or stunting + wasting.
With the recognition that anomalies in the distribution of abdominal fat are as great a risk factor for disease as is excess body fat per se, waist circumference is increasingly used as a surrogate estimate of intra-abdominal fat content in adults, often in combination with BMI as a surrogate indicator of obesity. However, to date, the use of this combination in large scale population studies is limited.
Adult cutoffs for waist circumference that vary by sex and ethnicity have been developed (M: ≥ 102cm, F: ≥ 88cm, WHO, 2000) with lower cutoffs proposed for Asians (M: ≥ 90cm, F: ≥ 80cm, Lear et al., 2010) than Europeans, as reported for BMI. Nevertheless, more research is needed to establish whether specific cut-offs are needed for African-American, Hispanic, and Middle Eastern populations (Lear et al., 2010); see Chapter 11 for more details.
13.4.2 Identifying the determinants and consequences of malnutrition
The main direct determinants of malnutrition are frequently dietary intake and infection, both of which are affected by underlying determinants such as household socioeconomic conditions, food security, education, health services, or water, sanitation and hygiene (i.e., WASH). Anthropometric indices can be used in conjunction with household and WASH data, to examine factors associated with malnutrition as well as its consequences. Anthropometric indices are especially useful in extreme acute situations such as famine, as the determinants of very high levels of wasting are severe energy deficits. The latter can be confirmed by a rapid reduction in the prevalence of low weight-for-height following re-feeding.In non-disaster situations, however, the causes of wasting, stunting, or overweight are much more difficult to identify because multiple factors may be involved, making it important to collect information or measure all potential risk factors. Aguayo et al. (2016) investigated the determinants of stunting and poor linear growth in children in the state of Maharashtra, India where 22.7% of children 0–23mos were stunted, of whom 7.4% were severely stunted. They used data from the 2012 comprehensive nutrition survey which included questionnaires focussed on the households, mothers, and infant and young child feeding (IYCF) practices, using the standardized IYCF indicators developed by WHO (2008).
In the state of Maharashtra, the mean HAZ was significantly lower (−1.74 vs. −0.25) and the prevalence of stunting significantly higher (40.5% vs. 9.2%) among children age 18–23mos than among children age 0–5mos. Multivariate regression analyses suggested that the most consistent determinants of stunting and poor linear growth in these Indian children < 23mos were birthweight and child feeding, women's nutrition and status, and household sanitation and poverty; for more specific details see Aguayo et al. (2016). Based on these results, policies, programs, and investments to improve linear growth and reduce the prevalence of stunting in the State of Maharashtra should be prioritized in four key areas, as shown in Box 13.7.
- Improve women's nutrition and reduce low birthweight;
- Improve complementary foods and feeding practices for children age 6–23mos;
- Improve access to and use of sanitation facilities;
- Mitigate household poverty through effective social safety nets coupled with effective communication and counseling.
Overweight and obesity in childhood is also of increasing public health concern in both developed and developing countries, as noted earlier. Hence, identifying modifiable risk factors for child overweight and obesity that can be targeted through public health interventions is also important. In a report of Kenyan preschool children between 3–5y (n=1495) based on data from a nation-wide Demographic Health Survey (DHS), Gewa (2010) examined the associations between childhood overweight and obesity and selected maternal and child-related factors. Maternal overweight and obesity, higher levels of maternal education, being a large or very large child at birth, and being stunted were each associated with higher odds of overweight and obesity among these Kenyan preschoolers. Some of these factors are modifiable and could be targeted through appropriate public health interventions. For more discussion, see Gewa (2010).
Nevertheless, the interpretation of such cross-sectional data on the determinants of stunting and overweight is difficult. Anthropometry and the data from the households, mothers, and young children are collected at the same time during a cross-sectional survey, whereas both stunting and overweight reflect long-term cumulative influences which may have existed for a long time before the households were surveyed.
Child stunting, wasting, under-weight or overweight each have short- and long-term health consequences which are well documented (Black et al., 2008; Nahar et al., 2020). The capacity of anthropometric indicators to predict the risk of these adverse health consequences has been the subject of much research; it depends on several factors. These include the indicator selected, the specific risk under question, the age of the children, the baseline levels of the anthropometric deficit, and the health status in the study population at baseline. The findings vary according to the study setting. Nonetheless, information from these investigations is important because they can promote the survival of these “at risk” children through appropriate interventions.
Many settings in developing countries are characterized by poverty, infections, and inadequate dietary intakes. As a result, children may exhibit multiple anthropometric deficits simultaneously, which may amplify their risk for adverse health outcomes such as morbidity or mortality. To address this concern, the association between simultaneous anthropometric deficits and the risk of adverse health consequences have been studied by some investigators.
| Group | % of Children | Mean SLI (95% CI) |
|---|---|---|
| A (no failure) | 40.2 | 22.4 (22.2, 22.6) |
| F (stunting only) | 10.1 | 20.1 (19.7, 20.5) |
| Y (underweight only) | 5.9 | 19.4 (18.9, 19.9) |
| B (wasting only) | 2.6 | 19.3 (18.6, 20.1) |
| C (wasting and underweight) | 6.1 | 18.3 (17.8, 18.8) |
| E (stunting and underweight) | 27.9 | 16.9 (16.7, 17.1) |
| D (wasting, stunting and underweight) | 7.2 | 15.3 (14.9, 15.7) |
| Diarrhea | Severe diarrhea | Acute res- piratory infection |
|
|---|---|---|---|
| Group | Odds ratio 95% CI | Odds ratio 95% CI | Odds ratio 95% CI |
| A (no failure) | 1.00 | 1.00 | 1.00 |
| B (wasting only) | 1.06 (0.86–1.30) | 0.45 (0.19–1.10) | 0.92 (0.75–1.14) |
| C (wasting and underweight) | 1.45b (1.27–1.65) | 1.19 (0.82–1.73) | 1.28b (1.12–1.46) |
| D (wasting, stunting and underweight) | 1.72b (1.52–1.95) | 1.95b (1.45–2.61) | 1.39b (1.23–1.58) |
| E (stunting and underweight) | 1.54b (1.42–1.67) | 2.03b (1.66–2.49) | 1.34b (1.24–1.46) |
| F (stunting only) | 1.04 (0.92–1.17) | 1.08 (0.78–1.48) | 1.02 (0.91–1.14) |
| Y (underweight only) |
1.19c (1.03–1.37) | 1.64
(1.17–2.29) | 1.16c (1.01–1.33) |
The associations of child stunting, wasting, and underweight with increased risk of mortality are well recognized (Fawzi et al., 1997). In many cases, these studies have been cross-sectional, as noted earlier, with mortality estimates based on the effects of individual anthropometric indicators. However, as highlighted by Nandy et al. (2005), multiple anthropometric deficits may occur simultaneously, which may amplify the risk of mortality.
Khan and Das (2020) used the CIAF model (Section 13.3.8) to classify undernutrition and investigate risk of child mortality based on data on children < 5y from the National Family Health Survey in India in 2015–2016. Although no causal inferences could be drawn, their results indicated that districts with a higher burden of multiple anthropometric failures based on the CIAF index were associated with an elevated risk of infant and child mortality; see Khan and Das (2020) for more discussion of the findings.
Prospective studies, unlike cross-sectional studies, provide the best information about causation of disease and the most direct measurement of the risk of developing disease. McDonald et al. (2013) were the first to estimate the mortality risk associated with multiple anthropometric deficits in prospective cohorts based on a meta-analysis of data from 10 prospective studies in Africa, Asia, and Latin America. Unfortunately, cause-specific mortality was not investigated due to insufficient statistical power. In this study, the recent anthropometric status of the children was classified into seven subgroups shown in Table 13.13.| Classification of anthropometric status | n (%) |
|---|---|
| Not stunted, wasted, or underweight | 27,794 (51.7) |
| Stunted only | 7475 (13.9) |
| Wasted only | 1025 (1.9) |
| Underweight only | 1358 (2.5) |
| Stunted and underweight but not wasted | 11,501 (21.4) |
| Wasted and underweight but not stunted | 1655 (3.1) |
| Wasted, stunted, and underweight | 2953 (5.5) |
More studies are needed to establish whether there are unique determinants of multiple anthropometric deficits, as well as to identify the combination of anthropometric deficits associated with the greatest risk of mortality. With this knowledge, interventions could be targeted to the subgroup of children who may benefit the most.
13.4.3 Targeting interventions
Anthropometry can be used as a screening tool to identify the areas of greatest need (e.g., areas with a high prevalence of stunting or wasting or multiple anthropometric deficits) and, hence, likely to gain the most benefit from any intervention. WHO and UNICEF have classified the severity of malnutrition in young children < 60mos into five categories based on the percentage prevalence threshold of wasting, overweight, and stunting (de Onis et al., 2018) (Table 13.14).| Wasting | overweight | Stunting | ||||||
|---|---|---|---|---|---|---|---|---|
| Prevalence thresholds (%) | Labels | (n) | Prevalence thresholds (%) | Labels | (n) | Prevalence thresholds (%) | Labels | (n) |
| < 2·5 | Very low | 36 | < 2·5 | Very low | 18 | < 2·5 | Very low | 4 |
| 2·5 – < 5 | Low | 33 | 2·5 – < 5 | Low | 33 | 2·5 – < 10 | Low | 26 |
| 5 – < 10 | Medium | 39 | 5 – < 10 | Medium | 50 | 10 – < 20 | Medium | 30 |
| 10 – < 15 | High | 14 | 10 – < 15 | High | 18 | 20 – < 30 | High | 30 |
| ≥ 15 | Very high | 10 | ≥ 15 | Very high | 9 | ≥ 30 | Very high | 44 |
The number of countries in the different threshold categories for wasting, overweight, and stunting, shown in Table 13.14, is based on data accessed in 2018 from the WHO Global Database on Child Growth and Malnutrition and drawn from nationally representative surveys in 134 countries of children < 5y.
Comparison of the prevalence estimates for each anthropometric indicator can trigger countries to identify the most appropriate intervention program to achieve “low” or “very low” prevalence threshold levels. For example, in Table 13.14 , in the countries in which the prevalence of stunting was “very high” (i.e., n=44), intervention activities should focus on resolving factors associated with stunting. These often include increasing the availability of food, and improving diet quality, hygiene, and potable water supplies, as well as programs to prevent and treat infectious diseases (Gorstein et al., 1994).
13.4.4 Evaluating response to an intervention
When using anthropometry to evaluate the performance of an intervention, at least two measurements, taken before and after the intervention period, should be recorded, where feasible. In child growth monitoring and promotion programs, for example, serial measurements of weight, and sometimes length/height, are taken on children attending child welfare clinics or community health centres. These measurements are then plotted manually on distance growth charts, preferably those developed by WHO (Figure 13.3), to provide information on the pattern of growth over time and the response to the intervention, where appropriate; see Section 13.2.2 and Section 13.2.3 for more details. When choosing an anthropometric indicator to monitor the response, the time lag between the start of the intervention and the time when a response can be anticipated must always be considered. As noted in Section 13.2.3, children who are wasted, respond to a nutrition intervention by gaining weight first, only later catching up in linear growth. Hence, plotting weight-for-length/height (if available) or weight-for-age on the WHO Child Growth Standard distance chart would be appropriate.For large scale public health programs, the purpose of an evaluation is to influence decisions about the effectiveness of the programs. These decisions may include to continue, expand, modify, strengthen, or discontinue a program. Habicht et al. (1999) have reviewed the various designs recommended for evaluating public health programs. The designs vary depending on the purpose of the evaluation and the level of precision required and are summarized in Box 13.8.
- Adequacy — Purpose of the evaluation:
determine whether the prevalence of
stunting is adequate (according to a
predetermined criteria (e.g., very
low prevalence threshold: < 2.5%).
- Types of design: Cross-sectional survey of the prevalence of stunting (i.e., HAZ < −2 Z‑score) at a certain point in time, and comparison of prevalence findings with the pre-established criteria of adequacy (i.e., < 2.5% stunting).
- Plausibility — Purpose of the evaluation:
determine whether it is plausible to conclude that the intervention
contributed to current prevalence of stunting or to the observed changes in
the prevalence of stunting.
- Types of design: Quasi-experimental or:
- Cross-sectional survey with treatment and comparable control group;
- Longitudinal study with before and after measurements (examine changes in treatment group only);
- Case-control study with measurement of cases compared with matched comparable controls.
- Types of design: Quasi-experimental or:
- Probability — Purpose of the evaluation:
determine with a pre-established level of probability that the impact
on stunting prevalence is due to the intervention.
- Types of design:
Double-blind, randomized experimental design:
- Randomization of the intervention;
- Before and after measurements with intervention and control groups;
- Both subjects and researchers are blind to the treatment during the intervention and the analyses.
- Types of design:
Double-blind, randomized experimental design:
In an adequacy evaluation, program activities cannot be causally linked to the observed changes. Nevertheless, the adequacy evaluation may provide the necessary reassurance that the expected goals of the program are being met, thus ensuring the continued support for the program. Examples of public health programs in which adequacy evaluation has been applied include a 10‑year Micronutrient and Health (MICAH) program implemented from 1996–2005 in selected areas of Ethiopia, Ghana, Malawi, and Tanzania by World Vision (Berti et al., 2010), and the large-scale program to improve infant and young child feeding (IYCF) and nutrition in Ethiopia by the Alive and Thrive initiative (Menon et al., 2013).
Plausibility evaluation is conducted when decision makers require a greater degree of confidence that the observed changes were indeed due to the program. For an evaluation to be plausible, it must be able to show that the intervention appears to have an effect above and beyond other confounding factors which might have caused the observed effects. Hence, although this design does not require randomization of intervention and control activities to the comparison groups, nevertheless, attempts must be made to control for the influence of possible confounding factors. This can be achieved at the intervention design stage by the careful selection and matching of the comparison or control groups before the evaluation is begun. Alternatively, the influence of confounders or modifiers can be assessed afterwards at the analysis stage, when stratification or multivariate analyses can be used, provided information on potential confounders or modifiers has been collected or measured (Habicht et al., 1999). Of the plausibility designs summarized in Box 13.8, those of choice are the quasi-experimental or case-control designs. For details on selecting appropriate control or comparison groups for plausibility evaluation, see Rogers (2014) and White & Sabarwal (2014). For guidance on the statistical strategies to control for confounders and modifiers, the reader is advised to consult a biostatistician.
Probability evaluation designs provide the highest level of confidence that the intervention caused the outcome, and are considered the gold standard method. They require the use of a randomized, controlled, double-blind design which aims to ensure there is only a small known probability (usually < 0.05) that the observed difference in the prevalence between the intervention and control communities (or individuals) is due to confounding, bias, or to chance. With the double-blind randomization of the subjects to intervention and control groups, baseline differences between the intervention and control groups are minimal.
Figure 13.19.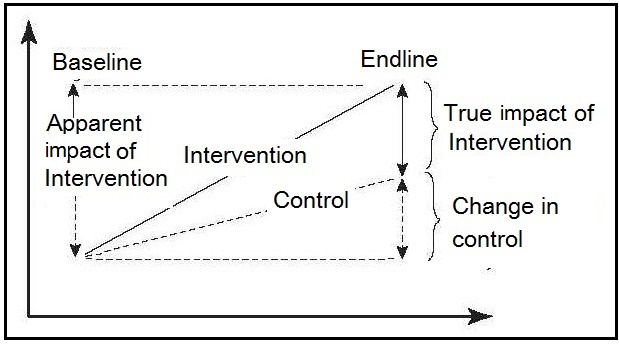
In order to attribute the changes in the outcomes to the interventions implemented, Alive and Thrive used the difference-in-difference (DID) or double difference method. This method compares the difference in changes in outcomes over time between the intervention and comparison groups to estimate impact, and is said to yield a reliable attribution of impact to an intervention. For more details see White and Sabarwal (2014).
Challenges may arise however, when interpreting the data of the impact of the intervention when nonintervention-related changes occur, and additional statistical techniques may be required to understand and inform policy makers about which underlying factors are most important in explaining the improvements in linear growth; see Nguyen et al. (2017) for more details. Gertler et al. (2011) also provide details on statistical methods to evaluate large-scale programs.
Table 13.15| intervention | Control | Adjusted differences* | P | |
|---|---|---|---|---|
| Mean weight at 18mos (kg) | 10.77 (1.16) | 10.48 (1.02) | 0.199 (-0.033 to 0.431) | 0.093 |
| Mean length at 18mos (cm) | 79.36 (2.74) | 78.29 (2.66) | 0.714 (0.146 to 1.282) | 0.014 |
| Mean WAZ at 18mos | -0.33 (0.90) | -0.62 (0.83) | 0.194 (0.008 to 0.380) | 0.041 |
| Mean LAZ at 18mos | -0.81 (0.80) | -1.19 (0.83) | 0.272 (0.099 to 0.445) | 0.002 |
| Mean WLZ at 18mos | 0.15 (0.87) | 0.05 (0.79) | 0.048 (-0.139 to 0.237) | 0.609 |
| Linear growth velocity ** | -0.031 (0.043) | -0.057 (0.050) | 0.021 (0.012 to 0.031) | <0.0001 |
| Number stunted at 18mos | 8 of 171 (4.7%) | 26 of 165 (15.8%) | 3.035 * (1.207 to 7.636) | 0.018 |
Abnormal changes in the rate of growth can be identified much earlier when growth velocity instead of distance growth is assessed, as noted previously (Section 13.2.2). However, growth velocity can only be assessed in interventions when the same children have been measured on more than one occasion, as was performed in the study of Penny et al. (2005). In this study in Peru, length velocity was very significantly greater in the intervention group than in the controls at 18mos.
For short-term interventions, assessment of weight gain or weight velocity rather than length or height velocity is more appropriate and easier to measure. As an example, in a randomized controlled trial, Sie et al. (2018) evaluated the effect of a 5-day course of three different antibiotics (amoxicillin, azithromycin, and cotrimoxazole) on growth among preschool children in Burkina Faso. Short-term growth was assessed from weight and height measurements taken at baseline and 30 days following the last medication dose from which weight velocity (g/kg/d), change in weight (g) and height (in cm), together with WHZ, WAZ, and HAZ- scores, were calculated. Results confirmed that children randomized to amoxicillin gained significantly more weight, had higher weight velocity and WHZ and WAZ‑scores compared to their placebo siblings, but there were no differences in weight gain in those children randomised to azithromycin or cotrimoxazole. Moreover, as expected, no difference in height gain or HAZ were detected over the 30day study period across any of the study arms. These findings highlighted that amoxicillin may have short-term growth-promoting effects in children in settings with a high prevalence of undernutrition and child mortality.
13.4.5 Nutritional surveillance
The overall purpose of a nutritional surveillance program is to gather, interpret, and disseminate information about nutrition. WHO (1995) defines nutritional surveillance as:The continuous monitoring of the physical status of a population, based on repeated surveys or on data from child health or growth-monitoring programs.The nutrition information collected can be used to achieve the objectives shown in Box 13.9.
- Aid long-term planning in health and development;
- Provide input for program management and evaluation;
- Give timely warning of the need for intervention to prevent critical deteriorations in food consumption.
- population-based;
- decision and action orientated;
- sensitive and accurate;
- relevant and timely;
- readily accessible;
- communicated effectively.
The U.S. has conducted a comprehensive national surveillance system since 1959 on the health status of US residents as part of the National Health and Nutrition Examination Surveys (NHANES). Data on anthropometry, demographic and socioeconomic status, dietary and health-related measures are collected.
The U.K. also has a surveillance system designed to assess the food consumption, nutrient intakes and nutritional status of the general population 18mos and older living in private households. The system is termed the National Diet and Nutrition Survey Rolling Program and began in 2008.
Successive national DHS surveys have also been used to track the rates of change in the prevalence of stunting, underweight, and overweight in some countries. As noted earlier (Section 13.3.7), in a meta-analysis of data on women of reproductive age from five successive national DHS surveys in Bangladesh from 1996 to 2011, the prevalence of underweight was reported to decrease from 47% to 24% over this time period, whereas that of overweight increased from 4% to 16% (Figure 13.16). This shift in BMI from underweight to overweight from 1996 to 2011 was most strongly and positively associated with urban residence, age, higher socioeconomic status, and higher education attainment (Hoque et al., 2015).
Recently, WHO has provided countries with tools to develop or strengthen their surveillance systems so they have the national capacity to monitor changes in the global nutrition target indicators shown in Box 13.2. These indicators focus specifically on childhood stunting, anemia in women of reproductive age, low birthweight, overweight, and exclusive breastfeeding.The tools developed by WHO/UNICEF include the provision of six policy briefs, each covering one of the global targets with details of the actions that should be prioritized to meet the global target. In addition, a web-based tracking tool has also been developed to assist countries to set national targets and chart their progress of achieving the six global goals. Details of the indicators recommended to monitor each target are available from WHO (2013). More details of these tools are available from WHO (2019).
The rising global burden of chronic, non-communicable diseases (NCDs) has also led WHO to adopt a Global Monitoring Framework that includes 25 key indicators to track progress in the prevention and control of NCDs. This initiative prompted WHO in 2002 to develop a stepwise approach to NCD surveillance (STEPS) (WHO STEPS Surveillance Manual, 2005). The approach involves a standardized but flexible framework for countries to monitor the main NCD risk factors based on national household surveys of adults aged 18 to 69y, preferably repeated every 3 to 5 years.
In step 1 of this approach, self-reported information on demographics and behavioral risk factors are collected through in-home interviewer-administered questionnaires. This is followed by step 2 in which physical measurements of height and weight (to calculate BMI), waist circumference, and blood pressure are undertaken. Step 3 is performed at a local clinic or health center for biochemical assessment for blood glucose, blood lipids, and urinary sodium (Riley et al., 2016).
Since 2009, WHO has introduced eSTEPS for the data collection which has led to a more streamlined and standardized approach to quality control. WHO also provides technical support through training workshops for the implementation of STEPS, as well as STEPS “Data to Action” workshops to strengthen the in-country development of national NCD policies and programs.
Data generated through STEPS has been used in a number of projects.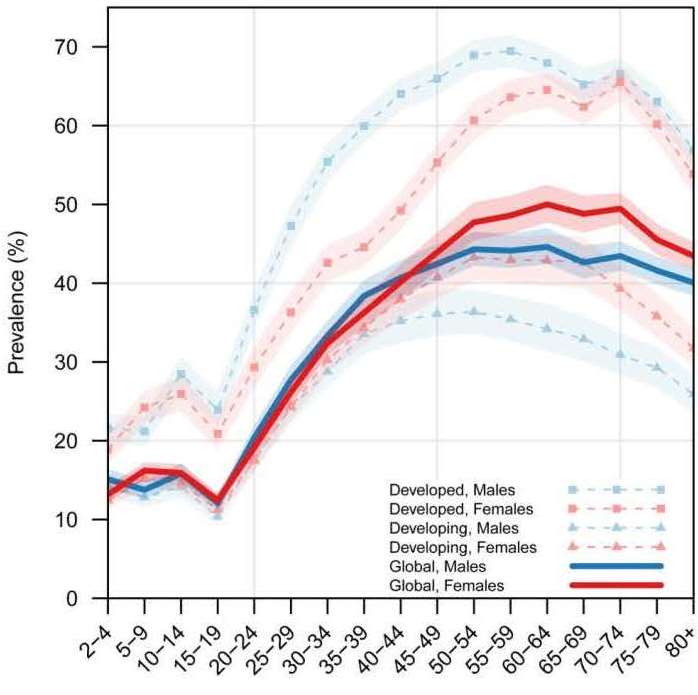
There has been a concerted effort over the past decade to strengthen nutritional surveillance globally. This effort is not only good public health practice, but it has also increased public and government awareness of the extent of the problems of malnutrition in both developing and developed countries. Future developments in surveillance may include methods that quantify intra-abdominal and subcutaneous adipose tissue, and measure physical activity patterns using wearable technology, and assay hemoglobin A1c as an indicator of diabetes. For more discussion of the challenges, limitations, and future directions of STEPS, see Riley et al. (2016).
As noted in Section 13.1.3, questions have been raised about the validity of interpreting changes in HAZ scores across time as representative of growth faltering or catch-up growth. Several studies have reported that HAZ scores increased despite increasing height deficits, highlighting that that the use HAZ scores rather than absolute height differences from the median (HADs) may result in opposite conclusions about the occurrence of catch-up growth (Lundeen et al., 2014). Hence caution is required when defining catch-up growth. The authors recommend that absolute height differences should always be included along with HAZ‑scores when evaluating catch-up growth in height in populations with a high prevalence of growth failure. More research is needed to determine which of the two metrics is better at predicting different outcomes.