
Gibson RS1,
Principles of Nutritional
Assessment: Zinc
3rd Edition, August, 2024
Abstract
Multiple physiological functions are affected by zinc deficiency because of the involvement of zinc in numerous metabolic processes as a catalytic, structural, and regulatory ion. As a consequence, in zinc deficiency numerous nonspecific changes occur, including impairments in growth, immune function, appetite, taste acuity, and possibly neurobehavioural function. Zinc homeostasis in the body is tightly controlled over a wide range of zinc intakes, primarily by adjusting losses of endogenous fecal zinc. Such strict homeostatic control leads to difficulties in the assessment of zinc insufficiency and excess. The BOND Expert Zinc Panel recommended three indicators to identify populations at elevated risk of zinc deficiency — the prevalence of usual zinc intakes below the estimated average requirement, the percentage with low plasma / serum zinc concentrations, and the percentage of children < 5y who are stunted (i.e., HAZ < –2SD). Reference limits for plasma / serum zinc (depending on age, sex, time of day, fasting status) are available to identify populations at risk of zinc deficiency, provided the correct protocols are followed for the collection, separation, and analysis of plasma zinc. Moreover, in view of the poor specificity of impaired linear growth, assessment of this functional indicator should be made in combination with at least one of the other indicators. Assessment of marginal zinc deficiency in individuals is more difficult because of the absence of frank clinical signs and the lack of a reliable sensitive and specific biomarker. The recommended approach combines a medical history, qualitative dietary and clinical assessment, with plasma / serum zinc providing supplementary data. The BOND Expert Zinc Panel classified other potential zinc biomarkers into three groups: (1) potentially useful (hair zinc, urinary zinc, and neurobehavioral function); (2) emerging biomarkers (nail zinc, zinc-dependent proteins, oxidative stress and DNA integrity; zinc kinetics, taste acuity), and (3) not useful (zinc-dependent enzymes, erythrocyte and leukocyte zinc); strengths and weaknesses of each are discussed. CITE AS: Gibson RS. Principles of Nutritional Assessment. Zinc. https://nutritionalassessment.org/zinc/Email: Rosalind.Gibson@Otago.AC.NZ
Licensed under CC-BY-4.0
( PDF ).
24c.1 Zinc
In an adult 70kg male there is approximately 1.5–2.5g of zinc, of which over 80% is found in the skeletal muscle and bone. Much smaller amounts are present in the liver, gastrointestinal tract, skin, kidney, lung, prostate, and other organs, as shown in (Table 24c.1).| Tissue | Zn conc. (mg/kg wet wt) |
Total content (mg) |
Percent of total body zinc |
|---|---|---|---|
|
Skeletal muscle Skeleton —Bone —Marrow —Periarticular tissue —Cartilage Liver Lung Skin Whole blood Kidney Brain Teeth Hair Spleen Lymph nodes Gastrointestinal tract Prostate Other organs/tissues Total |
50 90 20 11 34 40 40 15 6 50 10 250 200 20 14 15 100 Variable |
1400 450 60 11 30 72 40 39 33 15 14 11.5 4 3.6 3.5 1.8 1.6 50 2240 |
63 20 3 < 1 1 3 2 2 1 1 1 1 < 1 < 1 < 1 < 1 < 1 2 100 |
24c.1.1 Functions of zinc at the cellular level
At the cellular level, zinc has three major metabolic functions — catalytic, structural, and regulatory (King and Cousins, 2014). More than 300 metalloenzymes require zinc as a catalyst for function or regulation. During zinc deficiency, their activity is decreased, although their structure does not change, and with the addition of zinc, enzyme activity is restored. Zinc metalloenzymes are involved in nucleic acid metabolism and cellular proliferation, differentiation, and growth; examples are listed in (Table 24c.2). So far, no consistent changes in the activity of any zinc metalloenzymes have been linked with signs and symptoms of zinc deficiency in experimental zinc depletion-repletion studies in humans (King et al., 2015).| Zinc metalloenzymes |
|---|
| Alcohol dehydrogenase |
| Alkaline phosphatase |
| Carbonic anhydrase |
| Carboxypeptidase |
| Deoxynucleotidyl transferase |
| DNA polymerase |
| Glutamic acid dehydrogenase |
| Malic acid dehydrogenase |
| Nucleoside phosphorylase |
| RNA polymerase |
| Tyrosine kinase |
| Zinc-copper superoxide dismutase |
24c.1.2 Physiological functions of zinc
Multiple physiological functions are affected by zinc deficiency due to the ubiquitous involvement of zinc in cellular metabolism. A modest deprivation in zinc intake over the long-term results in detectable changes in growth, immune function, and possibly neurobehavioural function. Other signs of marginal zinc deficiency include poor appetite and impaired taste acuity (hypogeusia). Impaired growth in zinc deficiency arises from the role of zinc in DNA transcription and gene expression, signal transduction pathways, and endocrine function (e.g., insulin-like growth factor); these effects are summarized in Figure 24c.1.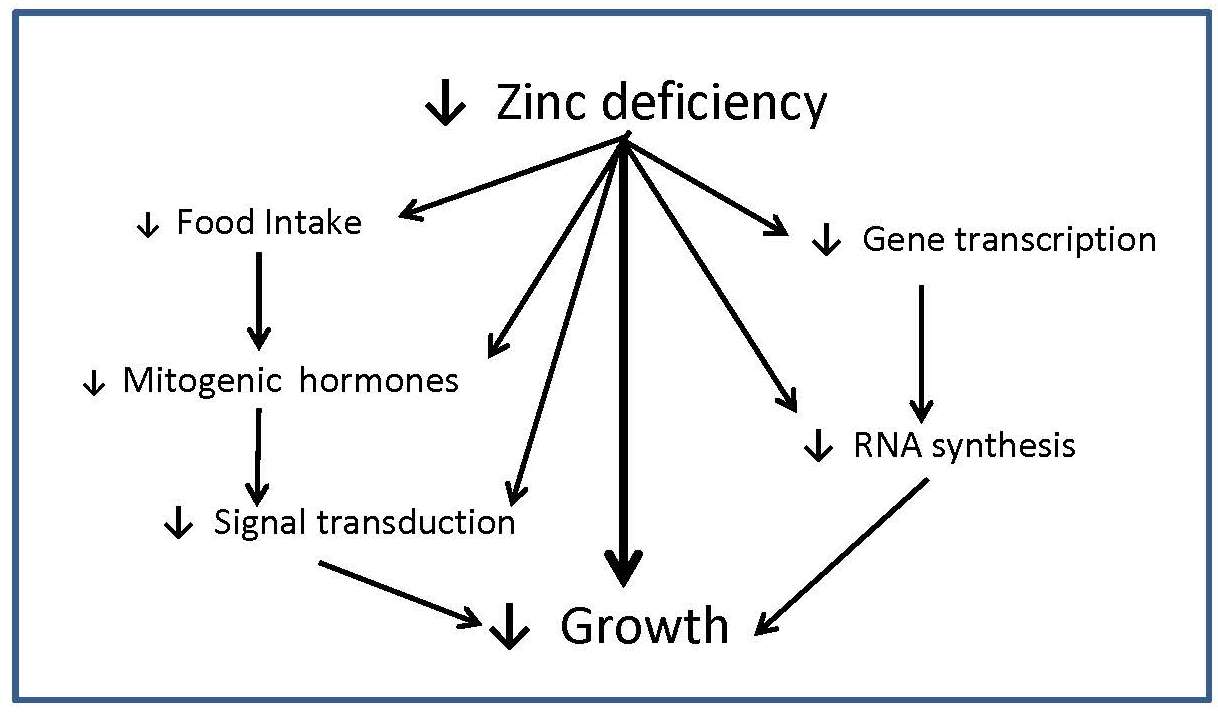
24c.1.3 Absorption and metabolism of zinc
Zinc is mainly absorbed in the upper part of the small intestine by two mechanisms: a saturable, carrier-mediated process and, secondly, by a non-mediated, or passive process. Two families of zinc transporters control the transport of zinc on the enterocyte membrane and account for the saturable component. Once zinc is absorbed into the enterocyte, movement of zinc within the cell is influenced by metallothionein and the transporter ZnT7. Export of zinc from the intestinal epithelial cells into the portal vein is controlled by the ZnT1 transporter. About 30%–40% of the zinc in portal blood is exchanged with the liver, the main organ involved in zinc metabolism. From the liver, zinc is released into the systemic circulation for delivery to peripheral tissues bound mainly to albumin and α2‑macroglobulin (King and Cousins, 2014). Almost no zinc circulates in an unbound state. Absorption of zinc by a nonsaturable or passive mechanism only occurs at high intestinal luminal zinc concentrations generated through consumption of pharmacologic doses of zinc (King and Cousins, 2014). At such high doses (i.e., > 20mg/d Zn), fractional absorption of zinc via the passive mechanism is very low, suggesting that a dose of supplemental zinc above 20mg will have a limited influence on zinc nutrition (Tran et al., 2004). Zinc homeostasis in the body is tightly controlled over a wide range of zinc intakes. This is achieved primarily by adjusting zinc excretion through the gastrointestinal tract. Losses of zinc via the gastrointestinal tract comprise both unabsorbed dietary zinc and endogenous fecal zinc. The sources of endogenous fecal zinc are uncertain but probably include secretions from pancreatic and intestinal mucosal cells. When zinc intakes are very low, there is a decrease in zinc secretion into the intestinal lumen, and endogenous fecal zinc declines. With increasing zinc intakes, endogenous fecal zinc losses increase to maintain homeostasis. If the adult zinc intake is extremely low (e.g., < 2mg/day), then the reductions in losses of endogenous fecal zinc may be insufficient to re-establish zinc homeostasis. In these circumstances, additional metabolic adjustments occur to mobilize zinc from the small, exchangeable pool located in liver, pancreas, kidney, spleen, and possibly bone, to maintain zinc-dependent functions (King, 2011). Unlike iron, absorption of zinc does not change in response to alterations in whole-body zinc homeostasis or status. Instead, zinc absorption is influenced by current zinc intake, not the past or long-term zinc intakes, or status (Chung et al., 2008; King, 2010). Figure 24c.2.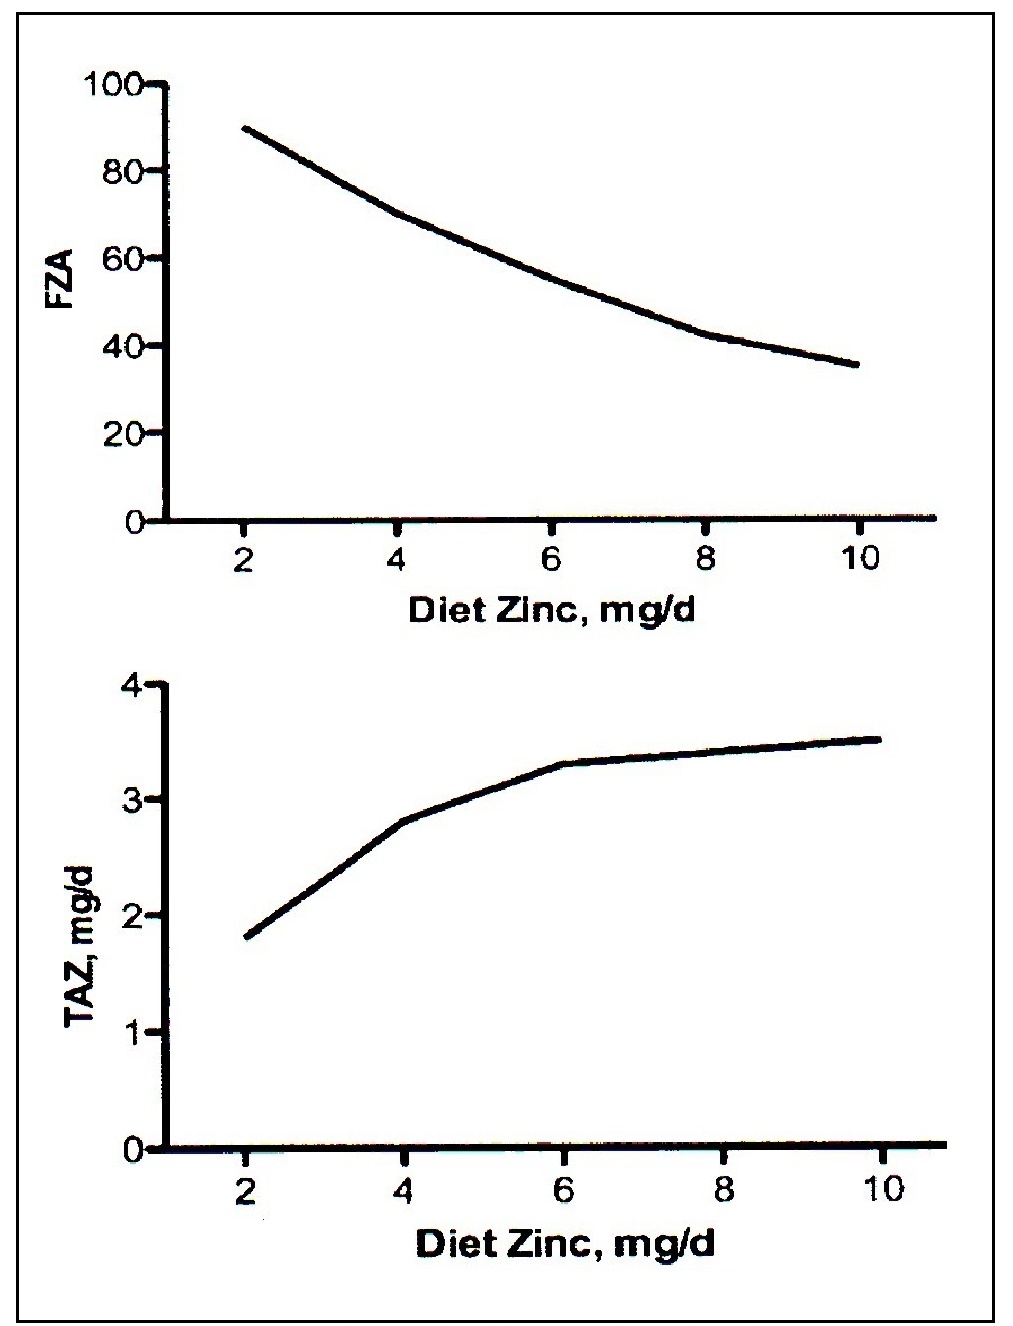
24c.1.4 Zinc deficiency in humans
When homeostatic mechanisms fail to ensure that requirements for zinc are met, clinical symptoms of zinc deficiency ensue. The first cases of dietary zinc deficiency in humans were described in the 1960s in male dwarfs from the Middle East (Prasad et al., 1963). Typical clinical features, which were corrected by zinc supplementation, included growth retardation, delayed secondary sexual maturation (hypogonadism), poor appetite, mental lethargy, and skin changes. In North America and New Zealand, overt and severe nutritional zinc deficiency was first recognized in hospital patients who received either parenteral nutrition or enteral feedings without zinc supplements (Kay and Tasman-Jones, 1975; Arakawa et al., 1976). Two genetic disorders are known to induce zinc deficiency: acrodermatitis enteropathica and sickle cell disease (King et al., 2015). Secondary zinc deficiency has been documented in the presence of Crohn disease, inflammatory bowel disease, ulcerative colitis, and malabsorption syndromes. A variety of other diseases — including renal and liver diseases, diabetes, acquired immuno-deficiency syndrome, and alcoholism — also induce secondary zinc deficiency. In such cases, zinc deficiency may arise from either increased urinary excretion of zinc (hyperzincuria) or excess endogenous fecal zinc losses (Aggett and Comerford, 1995). Treatment with certain drugs has also been associated with secondary zinc deficiency. For example, long-term treatment with penicillamine for Wilson’s disease (Smolarek and Stremmel, 1999) diethylenetriamine pentaacetate for the treatment of iron overload in thalassemia and sickle cell anemia (King and Cousins, 2014), and the administration of chlorthiazide (used to treat edema) and glucagon (used to control blood glucose levels) (Prasad and Oberleas, 1976) have all been implicated as iatrogenic causes of zinc deficiency. In some industrialized countries marginal zinc deficiency, characterized by slow physical growth, has been identified in apparently healthy infants and children (Hambidge et al., 1972a; Walravens and Hambidge, 1976; Walravens et al., 1983; Smit-Vanderkooy and Gibson, 1987; Gibson et al., 1989a). More recent double-blind preventative zinc supplementation studies in both industrialized and low-income countries have confirmed an increasing range of other functional impairments associated with zinc deficiency in children, in addition to impaired growth (Brown et al., 2009). In many of these studies, abnormalities of the immune system and increased risk of some common childhood infections have been reported. In settings where zinc deficiency is likely to be a problem, reductions in the incidence of diarrhea following preventive zinc supplementation have been observed, although the impact on lower respiratory infections, including pneumonia, has been less consistent (Haider and Bhutta, 2009; Brown et al., 2009; Lassi et al., 2010; Roth et al., 2010; Mayo-Wilson et al., 2014; Liu et al., 2018), and no clear effect on the incidence malaria (Brown et al., 2009; Mayo-Wilson et al., 2014). Therapeutic zinc supplementation has been shown to reduce the duration of acute and persistent diarrhea (Bhutta et al., 2000; Haider and Bhutta, 2009) , and is now recommended by World Health Organization to be included in diarrhea control programs (WHO/UNICF, 2004). Reports of zinc-related neurobehavioral abnormalities in children and/or adults include delays in child development, anorexia, dysfunction of smell and taste, irritability, mood and depression. However, studies of zinc deficiency or zinc supplementation on neurobehavioral function, have produced inconsistent results, possibly due in part to the differences in the measurement methods used (Warthon-Medina et al., 2015). In a meta-analysis of trials in infants and young children, for example, analysis of a small subset of randomized controlled trials (n=6) showed no significant effect of zinc on cognitive function or motor skills (Warthon-Medina et al., 2015). In contrast, results of a randomized controlled trial on Peruvian infants suggested that supplemental zinc may support normative neuro-development in infants consuming low zinc diets (Colombo et al., 2014). Several preventive zinc supplementation trials have also been conducted during pregnancy. The results have been inconsistent; only some have reported a positive effect of supplemental zinc on pregnancy outcome measures. In 2007, a meta-analysis showed a 14% reduction in infants born prematurely among zinc supplemented women, but no impact on infant birthweight, although there was a suggestion of a positive effect on birthweight in a subset of the women who were underweight or zinc-deficient (Hess and King, 2009). Two subsequent meta-analysis, one spanning five continents, of randomized controlled trials in which zinc supplements were given together with other micronutrient supplements, again indicated that only the effect on risk of preterm birth was significant, with no evidence of any effect on any parameter of fetal growth (low-birthweight, birthweight, length at birth, head circumference at birth) (Chaffee and King, 2012; Ota et al., 2015). More recently, a meta-analysis of studies of preventive zinc supplementation during pregnancy for three months or longer, reported no significant increase in birthweight and no decrease in the risk of low birthweight (Liu et al., 2018). Zinc status is sometimes compromised in the elderly, probably because of low zinc intakes and age-related changes in physiological function (de Jong et al., 2001). As well, the presence of hypochlorhydria, malabsorption syndromes, and the use of certain medications may have exacerbating roles (Aggett and Comerford, 1995). There are several reports of improvements in some aspects of immune function in older adults, including nursing home elderly, following zinc supplementation (Bogden et al., 1994; Barnett et al., 2016). Other possible zinc-related degenerative changes in the elderly that warrant further study include hypogeusia, delayed wound healing, anorexia, deterioration of glucose tolerance, and depression (Marcellini et al., 2006; Levenson, 2006; Lin et al., 2017). For example, correlations between zinc status (based on serum zinc concentrations) and symptoms of depression have been observed in observational studies in elderly women (Marcellini et al., 2006). Improvements in patients with depression given supplemental zinc have also been reported, especially when the supplemental zinc is used in combination with antidepressant drug therapy (Ranjbar et al., 2014).24c.1.5 Food sources and dietary intakes
There is no functional reserve or body store of zinc, as noted earlier, so an adequate regular supply of readily absorbable zinc is required. Hence, individuals consuming a usual diet low in zinc and/or with poor zinc bioavailability may be nutritionally zinc deficient. Food sources of readily absorbable zinc include organ meats, red meat, poultry, fish, and shellfish; oysters are one of the richest food sources of absorbable zinc. In general, the amount of zinc is higher in dark red meat than in white meat. Starchy roots, tubers, fruits, and vegetables have a low zinc content. Zinc is less readily available in whole grain cereals, nuts and legumes: their zinc content varies, depending on the zinc content of the soil or fertilizer treatment, growing location, and processing methods (e.g., milling of cereals). Loss of zinc from most foods during cooking is minimal. Several dietary components have been investigated as potential modifiers of zinc bioavailability. A systematic review, however, concluded that for many of these potential modifiers, data were insufficient to accurately determine their impact on zinc absorption (Bel-Serrat et al., 2014). A notable exception is phytic acid (myoinositol hexakisphosphoric acid (InsP6) and its associated magnesium, potassium, and calcium salts — termed “phytates” — potent inhibitors of zinc absorption, as noted earlier. In general, phytic acid and its salts are found in high concentrations in unrefined cereals, legumes, nuts and oil seeds. Concentrations vary widely depending on the botanical variety, environmental or climatic growing conditions, the use of phosphate fertilizers, and the stage of maturation. The highest levels are reached at seed maturity. During some food-processing, preparation and cooking practices, such as milling / pounding, soaking, germination / malting, mixtamalization, or fermentation, phytate is dephosphorylated to the lower myo-inositol phosphate forms (IP1 to IP4) that don't inhibit zinc absorption (Gibson et al., 2018). The inhibiting effect of phytate on zinc absorption follows a dose-dependent response. Hambidge and colleagues have developed a trivariant model to predict the inhibitory effect of different levels of phytate on zinc absorption as a function of zinc intake (Miller et al., 2007). Development of this model led the European Food Safety Authority (EFSA) to generate dietary zinc requirements for adults based on four levels of dietary phytate (EFSA, 2014). When daily phytate intakes in adults reach 1200mg/d, a level surpassed in some low income countries with staple diets of unfermented cereals and/or legumes, the average zinc requirement for adults, compiled by EFSA (2014) nearly doubles (Gibson et al., 2019). Values for the phytate content of raw and processed plant-based staples are available in the FAO / INFOODS / IZiNCG Global Food Composition Database for Phytate. Molar ratios of phytate-to-zinc of individual foods or whole diets can be used to estimate the likely proportion of zinc absorbed. Diets with a phytate-to-zinc molar ratio of more than about 15 have poor zinc bioavailability, whereas those with ratios between 5 and 15 are said to have medium bioavailability, and those with ratios less than 5 have good bioavailability (WHO/FAO, 2004). In the past, millimolar ratios of phytate × calcium : zinc were also used to predict zinc absorption because dietary calcium was said to influence the inhibitory effect of phytate on zinc bioavailability. The use of this ratio has now been discontinued in the absence of any demonstrated effect of calcium on zinc absorption from diets adequate in zinc, irrespective of whether intakes of dietary phytate were high or low (Hunt and Beiseigel, 2009). Whether calcium has an adverse effect in phytate-containing diets low in zinc is uncertain (King et al., 2015). Earlier, the amount and type of dietary protein was said to enhance zinc absorption but more recent data have not confirmed this (IZiNCG, 2004; Miller et al., 2013). A competitive interaction between iron and zinc may occur, depending on the form of the iron, as well as the conditions and levels under which both the iron and zinc are given (Lönnerdal, 2000). A decrease in zinc absorption may occur when the ratio of iron to zinc is very high (i.e., > 25:1) and when the iron is administered in water and fed under fasting conditions. Hence, women taking high-dose prenatal iron supplements (60mg elemental iron/day) may require additional zinc (Caulfield et al., 1999). For example, supplementation with 60mg elemental iron in a multiple micronutrient supplement blunted the increase in serum zinc observed in Cambodian women who received the same supplement but with no iron (Holmes et al., 2019). However, this interaction is less apparent when the iron is provided in a complex food matrix (Olivares et al., 2012; Esamai et al., 2014). In general, in omnivorous adult diets in affluent countries, meat and meat products supply the greatest amount of zinc, followed by cereals and dairy products (Briefel and Johnson, 2004; EFSA, 2014). However, interest in vegetarian diets has increased in these countries with high-phytate diets of cereals, legumes and nuts replacing meat and meat products (American Dietetic Association, 2003). Increasingly zinc fortified beverages, fortified cereals, and supplements are becoming important sources of dietary zinc, especially among young children in North America (Arsenault and Brown, 2003; Butte et al., 2010).24c.1.6 Effects of high intakes of zinc
There are no reported cases of toxicity from excess intakes of dietary zinc, although toxicity arising from short-term exposure to very high levels of contaminant zinc (> 300ppm), from the improper storage of food or beverages in galvanized vessels, has been reported (Brown et al., 1964). Signs and symptoms include dehydration, vomiting, electrolyte imbalance, abdominal pain, nausea, lethargy, dizziness, and muscular incoordination (Fosmire, 1990). Adverse effects of excess zinc on copper metabolism have been described (Prasad et al., 1978a; Fischer et al.,1984; Samman and Roberts, 1988; Yadrick et al., 1989) with a decrease in the activity of erythrocyte Cu,Zn‑SOD being the most consistent finding (Fischer et al.,1984). However, the clinical significance of a decrease in erythrocyte SOD activity is unknown. High intakes of zinc have also been associated with reductions in serum HDL cholesterol levels in some studies (Hooper et al., 1980),. and detrimental effects on the immune system (Chandra, 1984). Hence, excessive self-supplementation with zinc may have an adverse effect on health, although doses of 25–35mg/day zinc in adults do not appear to pose a health hazard (Smith, 1994). In Europe the zinc content of the most common single nutrient supplement is 30mg per capsule (range 15–50mg), and 10–15mg (range 2–20mg) for multi-nutrient supplements (EFSA, 2002). The Tolerable Upper Intake Level (UL) for zinc set by the U.S. Food and Nutrition Board for adults and pregnant and lactating women > 19y, is 40mg/d, a level based on the adverse effects of high doses of supplemental zinc (50mg Zn/d) on copper status biomarkers, notably reductions in the activity of erythrocyte Cu,Zn‑SOD. For infants the corresponding UL is 4mg, with adjustments for children based on body weight (IOM, 2001). Concern has been raised that the UL set by U.S. Food and Nutrition Board for preschool children (i.e., 7mg/day) in the US and Canada may be too low as many have dietary zinc intakes that exceed the UL due to their consumption of zinc-fortified beverages, fortified ready-to‑eat breakfast cereals, and zinc supplements (Arsenault and Brown, 2003; Butte et al., 2010). Sensitive biomarkers of copper status were reportedly unchanged by supplementation with 5, 10, or 15mg of zinc daily for four months in healthy boys in a double-blind, placebo-controlled randomized trial (Bertinato et al 2013). EFSA (2002) has set a lower level for the UL for adults and pregnant and lactating women (25mg Zn/d), although their UL for preschoolers 1–3y is the same as that of U.S. Food and Nutrition Board (i.e., 7mg/d).24c.1.7 Biomarkers of zinc status
Zinc is classified as a type II nutrient (Golden, 1995) because it is essential for multiple metabolic functions, as discussed earlier. As a consequence, in zinc deficiency the physiological effects that arise are associated with a number of diverse biochemical changes, making it difficult to identify biomarkers of zinc nutrition (King, 2011). In contrast, reductions in tissue nutrient concentrations of type I nutrients, such as iron, iodine, and vitamin A, arising from deficits in dietary intakes, cause a decline in one or more specific functions which can be readily identified using selected biomarkers (King, 2011). To identify populations at elevated risk of zinc deficiency, three indicators were recommended by WHO / UNICF / IAEA / IZiNCG: (a) prevalence of usual zinc intakes below the estimated average requirement, (b) percentage with low plasma/serum zinc concentrations, and (c) percentage of children aged < 5y who are stunted (i.e., HAZ < –2SD) ; (de Benoist et al., 2007), These recommendations were endorsed by the BOND Expert Zinc Panel (King et al., 2015). For details see IZiNCG Technical Brief No. 1 (2007). For each indicator, a “trigger level” is given for the prevalence considered indicative of elevated risk and of public health concern, at which level an intervention to improve population zinc status is warranted. Reference limits for plasma/serum zinc (depending on age, sex, time of day, fasting status) are available to identify populations at risk of zinc deficiency, provided the correct protocols are followed for the collection, separation, and analysis of plasma zinc. Assessment of the functional indicator — impaired linear growth — should be made in combination with at least one of the other indicators in view of its poor specificity (King et al., 2015). In the future, a model comprising key metabolic indicators, serum albumin, and a biomarker of inflammation may be developed for population zinc assessment (King, 2018). Assessment of zinc status at the individual level is particularly difficult because serum or plasma zinc concentrations are homeostatically controlled and do not decline with marginal zinc intakes. Hence, serum or plasma zinc is only useful to measure zinc status in individuals with either a very low or high supply of dietary zinc. Instead, the recommended approach for individuals combines a medical history, dietary and clinical assessment, with plasma or serum zinc providing only supplementary data (King et al., 2015). The BOND Zinc Expert Panel classified the other possible zinc biomarkers into three groups: (1) potentially useful (2) emerging biomarkers and (3) those deemed not useful. These are shown below in Box 24c.1.
Box 24c.1 Possible Zinc Biomarkers. From
(King et al., 2015).
- Potential Biomarkers that show promise, but data are insufficient to establish specific cutoffs indicating zinc inadequacy in populations: Hair zinc, Urinary zinc, Neurobehavioral function
- Emerging Biomarkers for which there is some theoretical basis for a relation to zinc intake or status, but testing is insufficient to confirm the relation: Nail zinc, Zinc-dependent proteins (i.e. cellular metallothionein, metallothionein and zinc-transporter expression), Oxidative stress and DNA integrity, Zinc kinetics , Taste acuity
- Not useful Biomarkers that do not relate consistently to zinc intake or status: Zinc-dependent enzymes, Erythrocyte and leukocyte zinc
24c.2 Dietary Zinc Intake
Assessment of dietary zinc intakes is the best method for estimating zinc exposure in individuals and populations. To determine dietary zinc intakes, a quantitative dietary method such as a weighed or estimated food record or a validated 24-h recall must be used. Details of the procedures to estimate dietary zinc intakes using a modified 24-hr recall specifically for use in lower income countries are available in a Dietary Technical Monograph (#8) (Gibson and Ferguson, 2008). Information on dietary zinc intakes can be used for several purposes. At the population level, data can be used to: estimate the prevalence of inadequate zinc intakes, classify subpopulations at elevated risk, design and monitor zinc intervention programs, and identify dietary patterns that contribute to inadequate zinc intakes. At the individual level, those at risk of inadequate intakes can be identified for dietary counseling. Tools have been developed to facilitate the collection of dietary zinc intakes and analyze the data to assess dietary adequacy (IZiNCG Technical Briefs) No.3 and No.7. Inadequate intakes of dietary zinc can arise from low intakes of zinc per se, poor bioavailability, or a combination of these dietary factors, as noted earlier. In low income countries, where unrefined cereals and legumes containing high levels of phytate are often the major source of energy and zinc, inadequate intakes of bioavailable forms of zinc are the most likely cause of zinc deficiency. Other diets based on starchy roots or tubers have a low total zinc and phytate content. Values for the phytate content of raw and processed plant-based staples are available in the FAO / INFOODS / IZiNCG Global Food Composition Database (Infoods Phytate Database). When collecting dietary intake data for zinc, intakes of dietary phytate should also be determined, whenever possible. Data on both zinc and phytate intakes permit the calculation of phytate-to-zinc molar ratios from which an estimate of the bioavailability of zinc can be obtained, as noted in Section 24c.1.524c.2.1 Measurement of zinc intake for populations
The recommended dietary indicator to identify a population or population subgroup at elevated risk of zinc deficiency is the prevalence of usual zinc intakes below the estimated average requirement (King et al., 2015). Because information on usual zinc intakes is required, food intakes must be measured on two non-consecutive days or three consecutive days. It is preferable that multiple days of intake data are collected for all individuals in the population. However, if this is not possible, then at least two non-consecutive days of dietary intake data from a sub-sample (40–50) of individuals per stratum should be collected. Figure 24c.4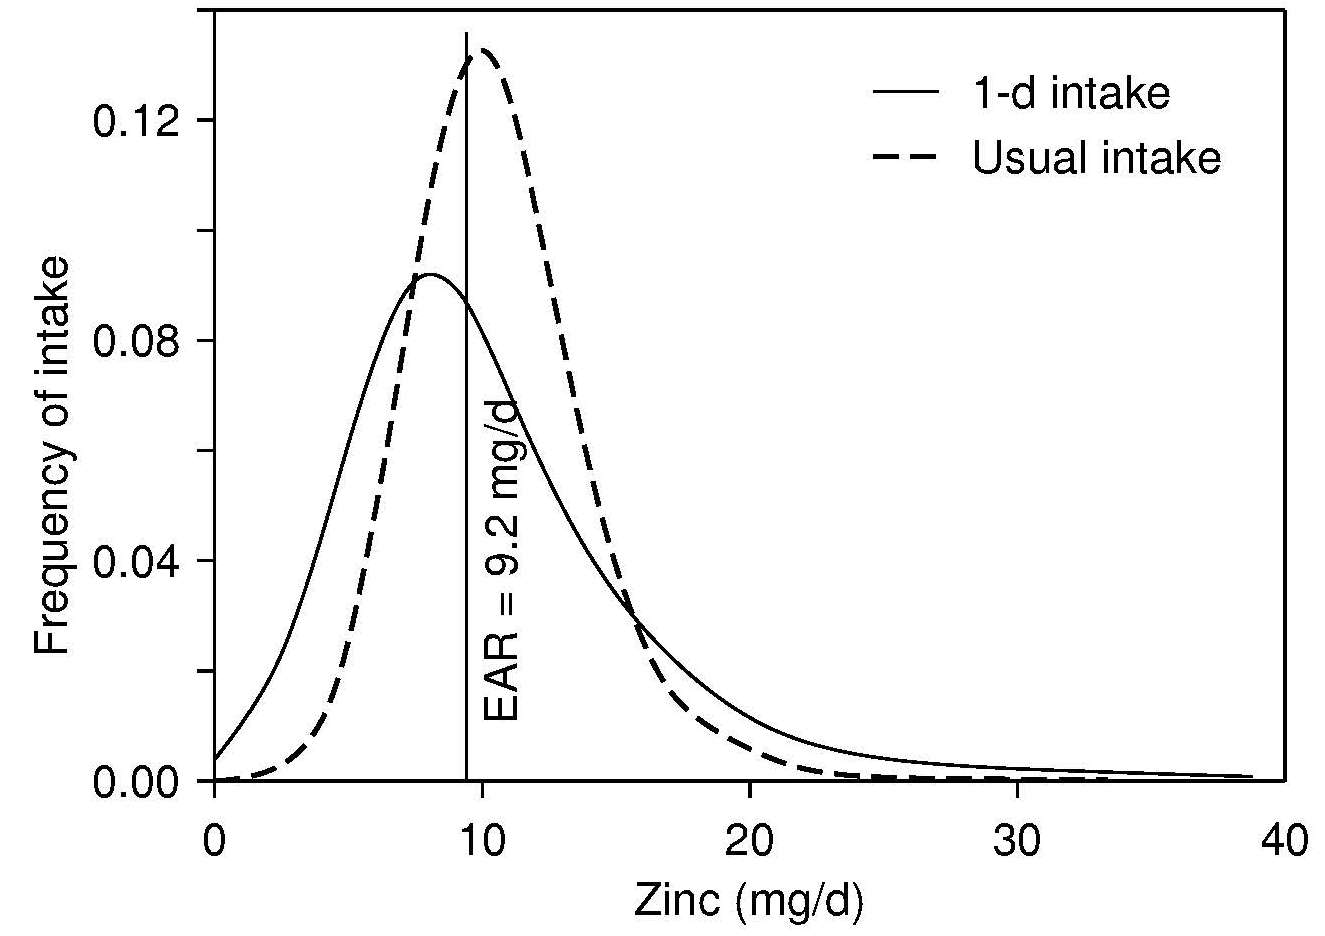
Box 24c.2 Steps to determine the dietary
intake at the population level
- Select a representative sample of the population
- Measure food intake by using either a 1-day weighed or estimated food record or a validated 24-h recall, preferably on at least two non-consecutive days for each individual or for at least a subsample of individuals in the population (40-50 individuals for each life-stage group with a different zinc requirement).
- Calculate zinc and phytate intakes and dietary phytate-to-zinc molar ratios for each individual by using an appropriate food composition database for the country. For non-pregnant and non-lactating adults, the amount of zinc likely to be absorbed may also be calculated.
- Adjust the distribution of observed zinc intakes to represent usual zinc intakes by removing the variability introduced by day-to-day variation in an individual's zinc intake.
- Select the appropriate EAR and apply the EAR cutoff method to estimate the prevalence of usual zinc intakes below the EAR. Alternatively, in countries where local food composition values for zinc and phytate are not available, collect 24-h duplicate diet composites from each individual for the chemical analysis of zinc and phytate, again with repeats on ≥40–50 individuals per stratum as described above (IZiNCG Technical Briefs) No.3.
24c.2.2 Interpretation of zinc intakes for populations
Several expert groups have set dietary zinc recommendations that include EARs for zinc, although discrepancies exist, depending on the sources of the data, the concepts and methods used, as described in Gibson et al. (2016). For example, the EARs for zinc set by the United States and Canada are based on a fixed adjustment for zinc absorption from habitual diets for both children and adults (Food and Nutrition Board, 2001). In contrast, the European Food Safety Authority (EFSA, 2014) have generated dietary zinc requirements based on four levels of dietary phytate intake for adults (> 18y) and said to cover the average phytate intakes in European populations: (300mg/d; 600mg/d; 900mg/d; 1200mg/d). In view of the uncertainty about whether recommendations for dietary zinc based on phytate intakes can also be made for young children, the EFSA EARs for infants and children are not adjusted for phytate. The prevalence of usual zinc intakes below the EAR is simply estimated by calculating the percentage of individuals within a specific life-stage group with usual intakes below the respective EAR. An elevated risk of zinc deficiency in the population is said to exist when 25% or more of the population have zinc intakes less than the EAR. However, to assist with the interpretation of the risk of zinc deficiency, it is recommended that estimates of the adequacy of zinc intakes be combined with biochemical data on serum zinc concentrations (IZiNCG Technical Brief) No.3. In cases where the amount of zinc likely to be absorbed is calculated for non-pregnant and non-lactating adults ≥ 19y using the updated trivariate saturation response model of Miller et al. (2007), then the prevalence of absorbable zinc intakes below the appropriate physiological requirement for absorbed zinc should be calculated. For IZiNCG, these requirements are 1.86mg/d for adult women and 2.69mg/d for adult men ≥ 19y of age. For further details of this calculation see (IZiNCG Technical Brief) No.3.24c.2.3 Measurement and interpretation of usual zinc intakes for individuals
Usual intakes of dietary zinc at the individual level can also be determined using quantitative dietary methods such as a weighed or estimated food records or validated 24-h recalls, provided a large number of measurement days per individual are conducted. Details on how to define the desired number of replicate days per individual are available in Gibson and Ferguson (2008). Alternatively, a dietary history or validated semi-quantitative food frequency questionnaire can be used to provide retrospective information about usual food consumption patterns, preferably over more than one month; details are available in Thompson et al. (2015). Assessment of the intake of zinc-rich foods (e.g., meat, poultry, fish), zinc-fortified foods, and high-phytate foods (e.g., unrefined cereals, nuts, and legumes) can be used to predict the intake of absorbable zinc (King et al., 2015). Inferences can be made about the adequacy of the zinc intake of an individual by comparing the difference between the estimate of the usual zinc intake of the individual and the respective values for the EAR and Recommended Nutrient Intake (RNI) for zinc. If the usual intake of the individual is greater than the RNI, then there is a high level of confidence that the usual intake is adequate, whereas if the usual intake is between the EAR and the RNI, the usual zinc intake probably needs to be improved, and if the usual intake is less than the EAR, then the usual intake very likely needs to be improved. Details on the guidelines for the qualitative interpretation of individual intakes are available from the Institute of Medicine (2000).24c.3 Serum zinc
Serum and plasma zinc concentrations can be used interchangeably because differences between these two sources of circulating zinc are very small (English and Hambidge, 1988). Fasting serum zinc concentrations are homeostatically controlled within fairly narrow limits (about 80–100µg/dL (12–15µmol/L). Only 0.1% of the total body zinc is present in the serum, whereas 3% and 63% are in the liver and skeletal muscle, respectively (Table 24c.1). Of the zinc in whole blood, from 12% to 22% is in the serum; the remainder is within the erythrocytes. Zinc is transported in the serum bound principally to albumin (70%), so conditions that alter serum albumin levels will, in turn, affect serum zinc concentrations. The remaining zinc in serum is tightly bound to α2‑macroglobulin (18%), and the rest is bound to other proteins such as transferrin and ceruloplasmin and to amino acids, primarily histidine and cysteine (Cousins, 1985). Serum zinc concentration is considered the best available biomarker of zinc exposure, status, and risk of zinc deficiency at the population level (de Benoist et al., 2007; Lowe et al., 2009; Hess et al., 2007). Evidence for this recommendation is derived from investigations on the following: (1) the effect of dietary zinc restrictions and repletion on serum zinc concentrations; (2) the effects of zinc supplementation on serum zinc; (3) the association between serum zinc and clinical signs of zinc deficiency; and (4) a comparison of initial serum zinc concentrations between individuals who do or do not show a functional response to the correction of zinc deficiency (King et al., 2015). In brief, in severe dietary zinc restriction (i.e., < 1mg/d) in previously healthy adults, there is a sharp decrease in serum zinc concentrations, with values returning to baseline levels within 1–2 weeks of zinc supplementation Figure 24c.5.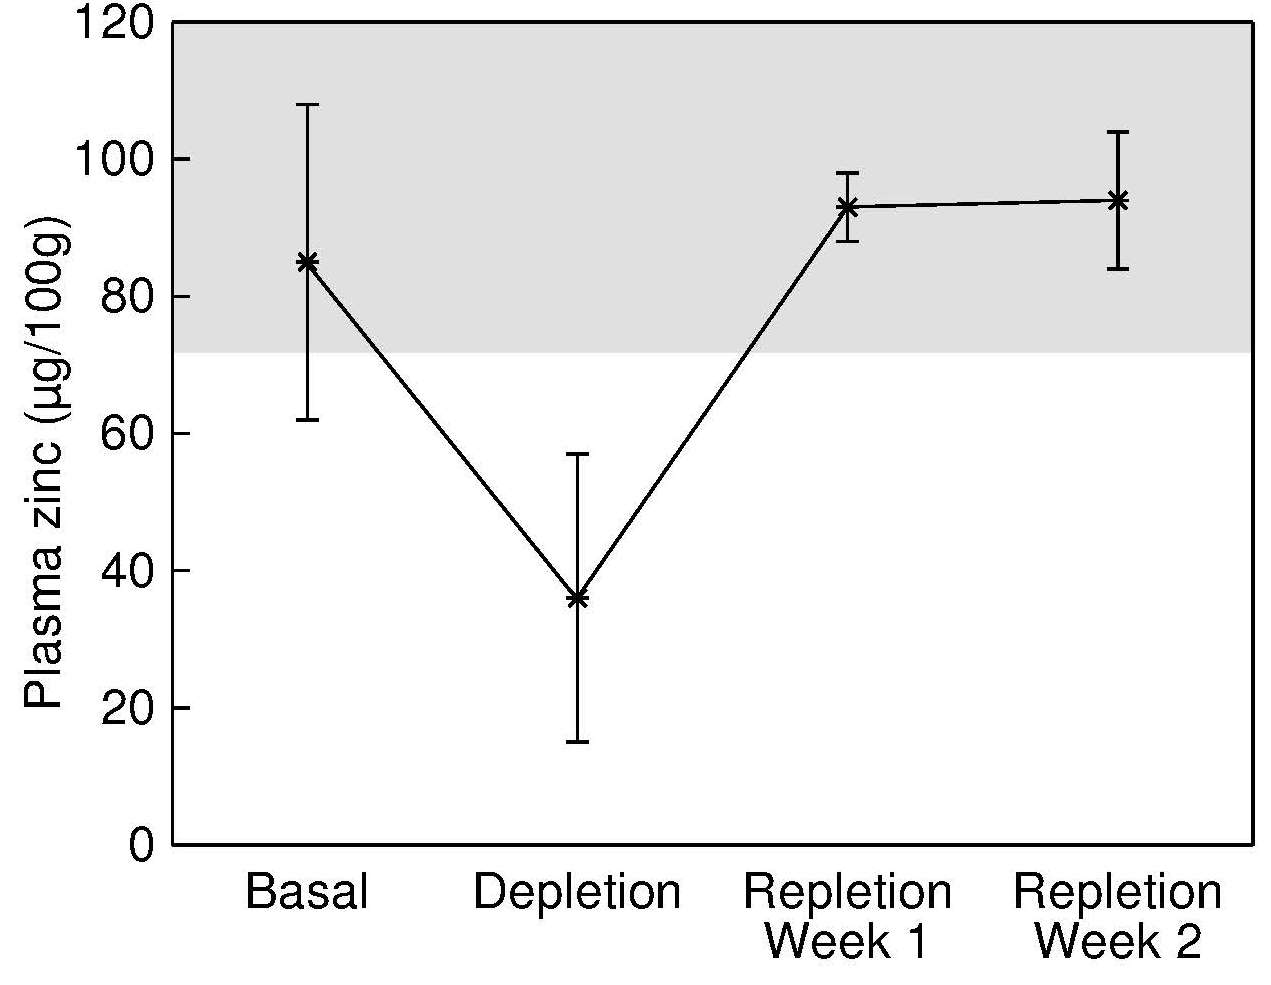
24c.3.1 Factors affecting serum zinc
Age-related changes in serum zinc concentrations (Table 24c.3)| Age (years) | Male serum zinc (μg/dL) | Female serum zinc (μg/dL) |
|---|---|---|
| 6–8 | 80.8±1.4 | 77.7±0.9 |
| 9–13 | 81.7±1.2 | 81.1±1.6 |
| 14–18 | 85.5±2.3 | 81.3±1.9 |
| 19–30 | 84.9±1.4 | 77.9±1.3 |
| 31–50 | 84.4±0.7 | 79.6±0.7 |
| 51–70 | 82.4±1.9 | 79.8±1.5 |
| ≥71 | 78.7±2.3 | 80.5±1.5 |
| All participants Time/fasting status |
n | Median serum zinc (µg/dL ± SE) |
|---|---|---|
| Morning, fasting | 1423 | 86.8 ± 0.8 |
| Morning, nonfasting | 89 | 85.0 ± 3.1 |
| Afternoon | 1124 | 76.9 ± 0.9 |
| Evening | 489 | 73.8 ± 0.9 |
| Participants (n) |
Mean serum zinc (µmol/L) |
Mean serum alkaline phos- phatase (U/L) |
|---|---|---|
| Non-users (202) | 12.11 | 22.8 |
| OC Users (128) | 11.81 | 19.5 |
| Probability of significant diff.a | 0.05 | 0.01 |
24c.3.2 Interpretive criteria
Table 24c.4 (shown above) presents the medium serum zinc by fasting status and time of sampling for all NHANES III participants. The International Zinc Consultative Group (IZiNCG) reanalyzed serum zinc data from NHANES II. In this reanalysis, data for participants with conditions significantly affecting serum zinc concentrations were excluded. These were individuals: with low serum albumin (< 3.5g/dL); with an elevated white blood cell count (> 11.500 cells per µL); using oral contraceptive agents, hormones or steroids; or experiencing diarrhea. The IZiNCG also took age, gender, fasting status (i.e., > 8h since the last meal), and time of day of the sample collection into account in the reanalysis; details are given in (Hotz et al., 2003) and (IZiNCG, 2004). From these reference data on healthy individuals, IZiNCG defined statistically derived reference limits based on the 2.5th percentile of serum zinc concentration for males and females aged < 10y and ≥ 10y (by fasting status) and time of sampling. These are given in (Table 24c.6) for children < 3y. IZiNCG suggests that the cutoffs for children < 10y also be applied to children < 3y, until appropriate reference data are available (IZiNCG, 2004).| Collection time |
Children < 10y |
Males ≥ 10y |
Females ≥ 10y |
|---|---|---|---|
| AM fasting | NA | 11.3 | 10.7 |
| AM other | 9.9 | 10.7 | 10.3 |
| PM | 8.7 | 9.3 | 9.0 |
24c.3.3 Measurement of serum zinc
Blood samples for serum or plasma zinc should be taken under carefully controlled, standardized conditions. Contamination from various sources such as preservatives, evacuated tubes, lubricants, anticoagulants, water, and rubber stoppers must be avoided. The reader is advised to consult the IZiNCG website for practical tips on the collection of blood samples for the measurement of serum or plasma zinc (IZiNCG Technical Brief No.2, 2007). For venipuncture blood samples, trace-element-free evacuated tubes with siliconized rather than rubber stoppers must always be used. Stainless steel or siliconized needles and Teflon or polypropylene catheters can all be used. For capillary blood samples, the use of polyethylene serum separators with polyethylene stoppers and olefin-oligomer is recommended (Iyengar, 1998). As noted earlier, fasting status, time of day of blood collection, time elapsed since the previous meal and since the blood sample was centrifuged, and presence of inflammation should all be recorded so that serum zinc values can be adjusted statistically as needed (Arsenault et al., 2011) prior to selecting the appropriate IZiNCG reference limits. Box 24c.3. shows pre-collection considerations recommended by IZiNCG (2007) to minimize contamination during the collection of samples for serum / plasma zinc:Box 24c.3 Pre-collection
considerations to minimize contamination
Once the blood has been collected, blood samples should be placed in a
refrigerator or on ice and allowed to clot for
30–40 minutes, and then
centrifuged to separate the serum or plasma. This approach minimizes
any transfer of zinc from the cells to the serum or plasma.
Alternatively, if centrifugation on site is not feasible, then the
blood should be placed in a cool box or refrigerator immediately after
collection where it can be held at
2–10°C for up to 24 hours
prior to being centrifuged and the serum or plasma separated. After
separation, the serum or plasma should be transferred to a
trace-element free screw-top vial for storage either in a refrigerator
(for up to several days) or frozen until analyses. Any obviously111
hemolyzed samples (i.e., > 1g hemoglobin/L) should be discarded
(Killilea et al., 2017;
IZiNCG Technical Brief No.xx, 2020).
Some investigators prefer to use plasma because it is readily
separated, less susceptible to platelet contamination, and not subject
to contamination from a reaming instrument
(Smith et al., 1985).
For plasma samples, the recommended anticoagulant is zinc-free heparin.
Before using any other anticoagulant it should be screened for
contaminant zinc. For more details, see King et al.
(2015).
The most frequently used method for the analysis of serum zinc is flame
atomic absorption spectrometry (AAS), using a direct method in which
the samples are diluted by 5 to 10-fold in solvents such as 6% aqueous
butanol or 10% aqueous propanol
(King et al., 2015).
Dilution of the
serum reduces the viscosity of the sample, which minimizes both the
matrix effect on the rate of aspiration and the tendency for the flame
atomic absorption burner-head to become blocked.
This may be especially a problem with
plasma because of precipitates that form in these samples. Sometimes
the serum or plasma samples are ashed at low temperatures prior to
analysis by flame AAS. For very small samples, flameless AAS can be
used. Increasingly, inductively coupled plasma (ICP) atomic emission
spectrometry or ICP mass spectrometry are being used. For all methods,
in‑house quality controls and standard reference materials (SRMs) such
as bovine serum (SRM 1598) from the National Institute of Standards and
Technology should be used. A coefficient of variation of < 5% is attainable
for zinc using flame AAS. Use of a trichloroacetic
acid deproteinization technique is not recommended.
Box 24c.4
shows the optimal procedures for the collection and
analysis of serum or
plasma samples to avoid adventitious trace element contamination. as recommended by IZiNCG
(2004).
- Obtain supplies of diposable polyethylene gloves, free of talc or other coatings, for those handling blood samples.
- Arrange for samples be processed in a laminar flow class 100 clean room, laminar flow hood, or otherwise in a clean, dust- and smoke-free laboratory.
- Check that stainless steel needles are available.
- Pre-screen anticoagulants, if required, for adventitious zinc contamination prior to use; zinc-free heparin is preferred.
- Pre-screen trace-element-free polyethylene evacuated tubes, stoppers, and serum separators for zinc contamination prior to use.
- Pre-screen polyethylene storage vials and transfer pipets for zinc contamination before use.
- Decontaminate all equipment to be used, with the exception of the prescreened disposable items. This can be achieved by careful washing (soak for 24h in ultrapure 10%–20% HCl or HNO3 solution and then rinsing three or four times with distilled, deionized water)
- Cover or seal all materials and equipment to be used, prior to storage to avoid dust.
Box 24c.4 Optimal collection and analysis procedures
Practical tips for implementing these procedures are provided in
IZiNCG Technical Brief No.2
(2012).
Serum or plasma samples for zinc analyses can be
refrigerated (4°C) for
2–3 weeks prior to analysis. For longer
storage periods, samples should be frozen at −25°C or below.
To prevent dehydration during long-term storage, especially if
frost-free freezers are used, serum or plasma samples should be stored
together with ice cubes in sealed plastic bags.
- Arrange for the participant to be seated.
- Clean the participant’s skin with alcohol at the site of the antecubital vein.
- Restrict occlusion of the participants’s arm with tourniquet to about 1 min.
- Draw blood, using a stainless steel needle, and collect into trace-element-free evacuated blood collection tubes without anticoagulant for processing serum.
- Place blood sample immediately in a refrigerator or on ice and allow to clot for 30–40min.
- Centrifuge blood sample at 2000–3000g for 10–15 min.
- Separate the serum using a zinc-free tranfer pipet.
- Discard any obviously hemolyzed serum samples.
- Consider retaining frozen red-cell residue for other determinations.
- Store serum samples frozen unless they are to be analyzed immediately.
- For analysis, dilute the sample quantitatively 5 or10-fold in solvents such as 6% aqueous butanol or 10% aqueous propanol.
- As soon as possible, determine sample zinc concentration using AAS or an alternative with appropriate standard dilutions, along with in-house quality controls and standard reference materials.
24c.4 Linear growth
The limited sensitivity and specificity of linear growth and other similar “bioindicators” means linear growth must be measured alongside other biomarkers of zinc (i.e., plasma or serum zinc) and other growth-limiting nutrients to establish the role of zinc in poor growth. There is no pharmacological effect of zinc on growth in zinc-replete individuals and linear growth is considered the best functional bioindicator associated with the risk of zinc deficiency in populations (King et al., 2015). Other functional bioindicators known to be responsive to zinc supplementation (e.g., diarrheal episodes) are difficult to define in a standardized manner. Justification for the selection of linear growth as the zinc functional bioindicator is summarized below in Box 24c.5. (Fischer -Walker and Black, 2005).Box 24c.5 Justification for linear growth as the zinc functional bioindicator
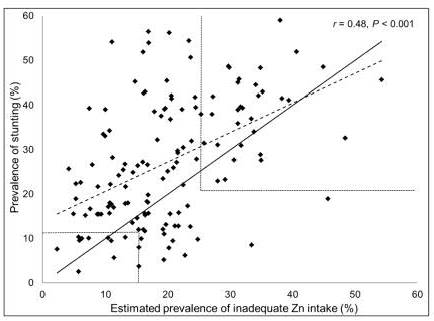
In a study by Wessells and Brown
(2012),
the prevalence of
inadequate zinc intakes in 138 low- and middle-income countries was
estimated from food balance sheet data. In these countries
the prevalence of stunting in children
less than 5y was positively
correlated with the estimated prevalence of inadequate zinc intake (r=0.48.
P=0.0001) as shown in
Figure 24c.7.
- Low height- or length-for-age is often responsive to zinc supplements.
- Standardized methods exist to measure height or weight that are widely used.
- Reference data (i.e.,WHO growth reference data) (WHO , 2006) are available for interpretation.
- Linear growth is likely to be the primary response to an increased intake of absorbable zinc whereas weight gain is likely to occur as a result of increased linear growth.
24c.4.1 Interpretive criteria
The percentage of children < 5y with height- or length-for‑age less than −2SDs below the age-specific median of the WHO Multicentre Growth Reference Study (MGRS) population is recommended for assessing the zinc status of populations (WHO, 2006). Risk of zinc deficiency is considered to be of public health concern when the prevalence of low height‑ or length-for‑age Z-scores among children aged less than 5y is ≥ 20% (de Benoist et al., 2007. The prevalence of low height- or length-for-age Z-scores (HAZ) for children 0–5y can be calculated from the WHO Child Growth Standard (WHO , 2006) and the computer program WHO (AnthroPlus). Note that in a healthy population of children the mean Z-score will be about 0.0 and the SD of the Z-score about 1.0; 2.5% of all the childen will have an HAZ-score < –2.24c.4.2 Measurement of height or length
For infants and children ≤ 85cm (i.e. ≤ 2y), recumbent length is the recommended measure, preferably with the use of an infantometer with a range of 30–110cm, equipped with a digital counter reader. Recumbent length should be recorded to the nearest millimeter, or even more precisely (i.e., 0.1mm) when possible. Wooden or acrylic length measuring boards can be used, but they are rarely fitted with digital counters so are less reliable. Note that recumbent length for a child of about 2y is about 5mm greater than standing height for the same child (Haschke and van’t Hof, 2000). Children > 85cm and adults should be measured in the standing position, preferably using a free-standing stadiometer (range 65–206cm), again equipped with a digital counter reader capable of measuring stature to 0.1mm. Platform scales with movable measuring rods should not be used as they are less accurate. Clothing should be minimal when height measurements are taken so that posture can be clearly seen. Shoes and socks should not be worn. The timing of the measurement should be recorded; diurnal variations in height occur due to compression of the spine as the day progresses (Buckler, 1978). Consequently, in population studies, standing height should always be measured at the same time of day, preferably in the afternoon. When measuring recumbent length or standing height, attempts should be made to minimize measurement errors. In longitudinal studies involving sequential measurements on the same group of individuals, one person should conduct all of the measurements throughout the study to eliminate between-examiner errors. This is especially critical when growth velocity is estimated; growth increments are generally small and are associated with two error terms, one for each measurement occasion. Recommendations of the minimal intervals necessary to provide reliable data on growth increments during infancy and early childhood are available (de Onis et al., 2004). In the WHO MGRS, the minimal interval recommended for reliable data on length measurements was every two weeks for infants from 2–6 weeks of age, monthly for ages 2–12 months, and bimonthly in the second year. During adolescence, increments measured over 6 months are the minimum interval recommended (WHO, 1997). For shorter intervals, the combined errors may be too large in relation to the expected mean increment. In large regional surveys, several well-trained anthropometrists are often needed to rotate among the participants to reduce the effect of measurement bias. Regular standardization sessions to assess both within‑ and between-examiner reliability should be conducted throughout the data collection period to maintain the quality of the measurements and to identify and correct systematic errors in the measurements; details of the procedures used in the WHO Multicenter Growth Reference Study (MGRS) are given in de Onis et al. (2004). An anthropometric training video prepared for the WHO MGRS is also available on request from WHO. The WHO MGRS recommends that the maximum allowable difference in length for acceptable precision between measurements by two anthropometrists is 7.0mm. (de Onis et al., 2004). Details of the measurement techniques and standardization protocols for both recumbent length and stature are given. Statistical methods exist for removing anthropometric measurement errors from cross-sectional anthropometric data; details are given in Ulijaszek and Lourie (1994).24c.5 Urine zinc
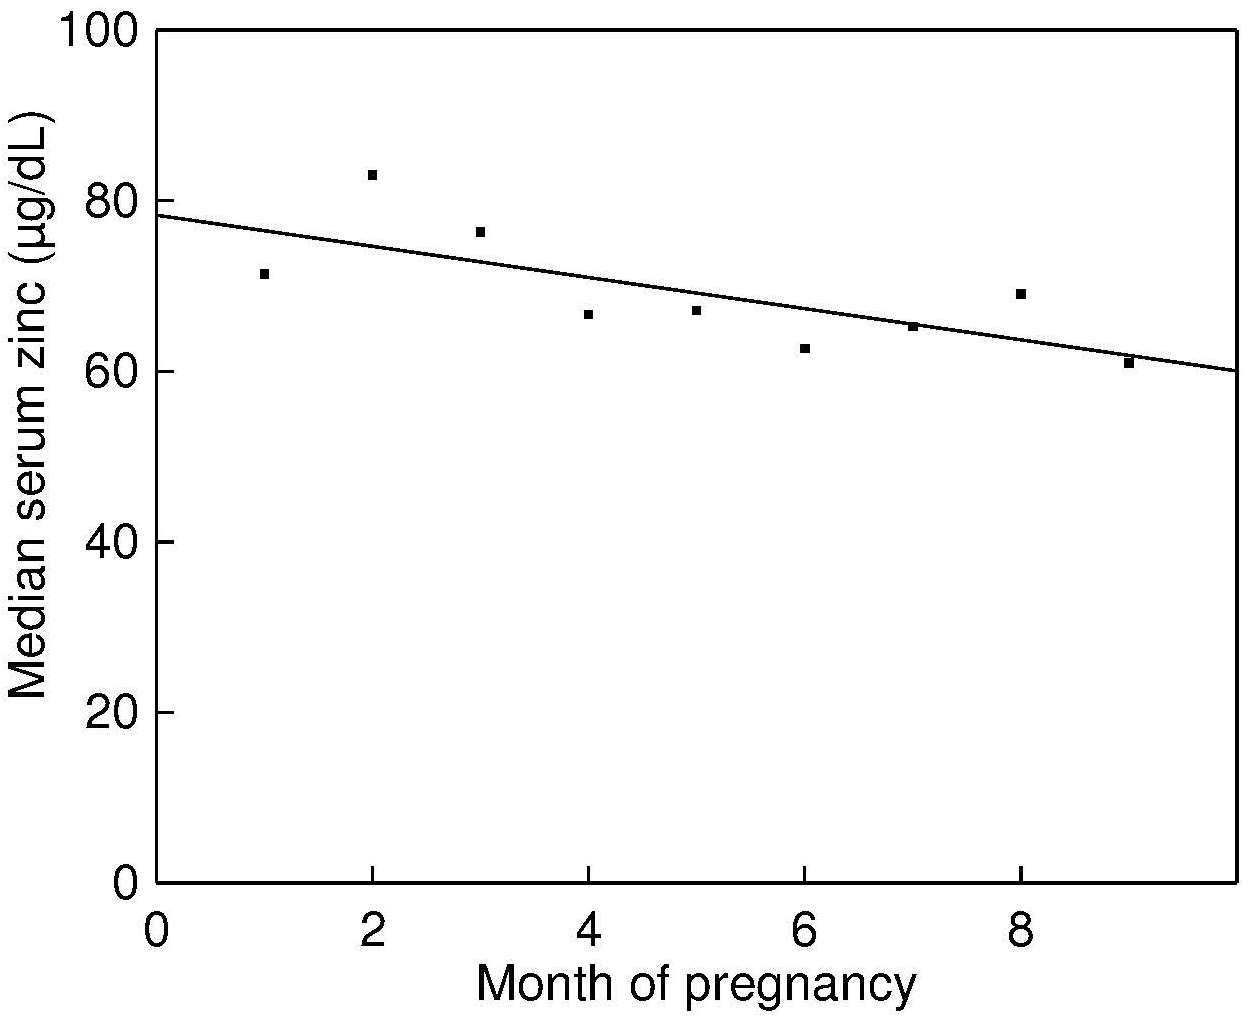
Daily excretion of zinc in the urine is typically 0.3–0.6mg. A systematic review and meta-analysis examining the response of urinary zinc excretion to changes in dietary intake was conducted by Lowe and co-workers (2009). They concluded that urinary zinc is a useful biomarker of increases in exposure to zinc supplements (i.e. > 15mg Zn/d) in adults with adequate zinc status at baseline. However, only when dietary zinc intakes are very low (< 1mg dietary Zn/d) is a decrease in urinary zinc excretion in adults apparent (Baer and King, 1984; Johnson et al., 1993; King et al., 2000). Comparable studies on infants and children have not been conducted. Urinary zinc excretion is confounded by a variety of clinical conditions that induce hyperzincuria. These include sickle cell disease, alcoholism and liver disease, certain renal diseases and infections, injury, and burns. Starvation, strenuous physical exercise, diabetes, and trauma may also increase urinary zinc excretion (King et al., 2015). Hypertensive patients on long-term therapy with chlorothiazide also exhibit hyperzincuria (Prasad, 1983). Certain physiological conditions also influence urinary zinc excretion. Increases have been reported during pregnancy with concentrations returning to prepregnant levels after delivery (Fung et al., 1997). Whether changes occur during lactation is uncertain (King et al., 2015). Consequently, the overall health and diet of an individual must always be evaluated when using urinary zinc as a biomarker of zinc exposure. The BOND Zinc Expert Panel classified urinary zinc as a “potential” biomarker that shows promise (King et al., 2015), based on its usefulness as a marker of compliance with zinc supplementation programs when at least 15mg Zn/d was given (Lowe et al., 2009). They emphasize, however, that the need to collect a 24‑hour urine sample and the lack of established cutoffs limit the usefulness of urinary zinc as a biomarker. Moreover, because urinary zinc only responds to very low dietary zinc intakes, its use as a biomarker of dietary zinc intake among free-living populations is limited.24c.5.1 Measurement of urinary zinc excretion
The amounts of zinc excreted in the urine usually range from 300 to 600µg/d. A 24-h urine collection is preferred because diurnal variation in urinary zinc excretion may be significant. Measurements of urinary zinc are usually performed by flame AAS.24c.6 Hair zinc concentrations
Zinc is incorporated into the hair matrix when the hair is exposed to the blood supply during synthesis within the dermal papilla (Kempson et al., 2007). When the growing hair approaches the skin surface, the hair undergoes keratinization and the zinc accumulated during its formation becomes sealed into keratin protein structures and isolated from metabolic processes. Hence, the zinc content of the hair shaft reflects the quantity of zinc available in the blood supply at the time of the hair growth, not at the time of sampling (Kempson et al., 2007). Consequently, positive correlations between hair and serum zinc concentrations can only be expected in settings where zinc status is unchanged or chronic zinc deficiency exists. Assuming a normal rate of hair growth (i.e., about 1cm hair growth/month), the zinc concentration in the proximal 1–2cm of hair (i.e., the hair closest to the scalp) reflects the zinc uptake by the follicle 4–8 weeks before sample collection (Hopps, 1977). In cases where hair growth is arrested, as may occur in severe acute malnutrition (Erten et al., 1978) and acrodermatitis enteropathica (Bradfield and Hambidge, 1980), hair zinc should not be used. In such cases, hair zinc concentrations may be normal or even high. The advantages of using hair as a biomarker are listed in Box 24c.6.Box 24c.6 The advantages of using hair as a biomarker.
From IZiNCG Technical Brief #8.
(IZiNCG, 2018).
Nevertheless, several technical and biological factors
may affect hair zinc concentrations. Hair is exposed to exogenous
surface contamination so all specimens must be washed using a
recommended procedure. Biological factors may include age, possibly
sex, season of the year, and rate of growth, as noted earlier
(King et al., 2015;
IZiNCG, 2018).
Neither cosmetic treatments or hair color
affect hair zinc concentrations, provided appropriate washing methods
are used
(Kempson et al., 2007).
The effects of all these possible
confounding factors must be considered when interpreting hair zinc
concentrations. The BOND Zinc Expert Panel classified hair zinc as a
“potential” biomarker that shows promise, but requires the
establishment of specific cutoffs to indicate zinc inadequacy in
populations
(King et al., 2015).
In part, the use of hair zinc concentration as a
biomarker of zinc exposure has been hampered by the failure of
commercial laboratories to adopt standardized methods for sampling and
washing the hair samples, and to report the accuracy and precision of
their analytical methods
(Hambidge, 1982;
King et al., 2015).
Hair zinc concentrations were shown to respond positively and significantly to
supplemental zinc in a systematic review and meta-analysis of three
studies in healthy adults
(Lowe et al., 2009),
although their response to zinc depletion is uncertain
(Lowe et al., 2009).
In children,
responses of hair zinc to supplemental zinc have been inconsistent,
although some associations between low hair zinc concentrations and
zinc-related functional outcomes (e.g., impaired taste acuity,
appetite, linear growth, recurrent respiratory tract infection) have
been reported
(Hambidge et al., 1972;
Buzina et al., 1980;
Chen et al., 1985;
Smit-Vanderkooy and Gibson, 1987;
Gibson et al., 1989a;
Cavan et al., 1993a;
Ferguson et al., 1993).
In addition, some studies
have shown significant relationships between hair zinc concentrations
and dietary zinc indices, most notably dietary phytate:zinc molar
ratios, in individuals consuming predominantly plant-based diets
(Ferguson et al., 1989;
Gibson and Huddle, 1998).
- Concentrations are higher than in serum or urine making their measurement easier.
- Specimen collection is relatively non-invasive and samples can be collected and stored at room temperature without deterioration and the need for speial prservatives.
- Concentrations are not subject to the rapid fluctuations produced by a recent meal, diurnal or circadian variation, or infection, as seen in serum zinc,
- Concentrations reflect exposure over a longer retrospective time frame than serum or urine.
24c.6.1 Interpretive criteria
There are no universally accepted reference values for hair zinc concentrations (Mikulewicz et al., 2013), and, as a result, the use of hairr zinc as a biomarker for assessing risk of zinc deficiency in populations has been limited. None of the reference values published to date have been compiled from a nationally representative reference sample of well nourished, healthy individuals free from conditions known to affect zinc status, unlike the IZiNCG procedure used to define reference values for serum zinc (King et al., 2015). In addition, standardized procedures for the sample collection, washing, and chemical analysis of the specimens, have not been employed (Mikulewicz et al., 2013). Hence there is an urgent need to compile a set of universal reference values for hair zinc concentrations. Guidelines for establishing universal reference values are available in Mikulewicz et al. (2013). Reference values should be represented by the geometric mean ± CV (%) or median for hair zinc concentrations, preferably by sex and life-stage group. Reference limits indicative of unusually low hair zinc concentrations, represented by the 2.5th percentiles for males and females for each life-stage group, should also be determined. With these data, the feasibility of employing hair zinc to assess the likely risk of zinc deficiency in future national nutrition surveys could be explored. Table 24c.7 presents the best available reference values for hair zinc (µg/g) derived from published studies for children ranging in age from 3 13y. Note data for both sexes are combined in five of the study groups in Table 24c.7, and that younger children tend to have lower hair zinc concentrations (IZiNCG, 2018, Table 24c.7).| Country Reference |
Age (y) |
Sex | n | Mean (SD) |
Median |
|---|---|---|---|---|---|
| Italy (Senofonte et al., 2000) | 3–6 | F/M | 58 | 101 (67) | 92 |
| Korea (Park et al., 2007) | 3–6 | F/M | 655 | 70 (50) | 66 |
| Italy (Senofonte et al., 2000) | 6–10 | F/M | 96 | 157 (50) | 152 |
| Italy (Senofonte et al., 2000) | 10–13 | F/M | 258 | 158 (41) | 155 |
| Italy (Dongarra et al., 2011) | 11–13 | F/M | 130 | 189 (59) | 179 |
| Belgium (Vanaelst et al., 2012) | 6–10 | F | 218 | 216 |
24c.6.2 Measurement of hair zinc
Hair specimens should be collected from a representative sample of the target population or subgroups of interest during the same season of the year. Samples (at least 50mg) should be cut at skin level from the occipital region of the scalp (i.e., across the back of the head in a line between the top of the ears) with stainless steel scissors. Only the proximal (i.e., closest to the scalp) 1.0–2.0cm of the hair strands should be retained. These specimens will reflect the zinc uptake by the follicles 4–8 weeks prior to sample collection provided the rate of hair growth has been normal. Hair samples should be placed in labeled trace-element-free polyethylene bags for storage; any remaining hair strands should be discarded. Before washing the specimens to remove exogenous contaminants such as atmospheric pollutants, water, and sweat, any nits and lice should be removed if necessary using a microscope or magnifying glass and Teflon-coated tweezers. For each specimen, details of the ethnicity, age, gender, hair color, height, weight, date of collection, presence of malnutrition (where relevant), and use of dandruff shampoos or cosmetic treatments should always be recorded to aid in the interpretation of the data. Washing with nonionic detergents (e.g., Triton X‑100) with or without acetone is preferred for hair as these detergents are less likely to leach bound zinc from the hair and yet are effective in removing superficial adsorbed zinc. Washing with chelating agents such as EDTA should be avoided because they remove some of the tightly bound zinc that is an integral part of the hair sample (Shapcott, 1978). After washing and rinsing, the hair samples must be vacuum- or oven-dried depending on the chosen analytical method, and stored in a desiccator prior to laboratory analysis. For a detailed guide for measuring hair zinc concentrations the reader is advised to consult IZiNCG (Technical Brief No.8). Several laboratory methods can be used to measure hair zinc concentrations in the washed specimens, depending on the instruments available. Washed specimens can be be prepared for analysis using microwave digestion when available, or wet or dry ashing, although the use of tetramethylammonium hydroxide (TMAH) to solubilize hair at room temperature warrants investigation. The latter method eliminates time-consuming ashing or wet digestion. Traditional analytical methods include flame AAS or multi-element ICP‑MS, although non-destructive instrumental neutron activation analysis (INAA) can also be used. For INAA the washed hair specimens are placed in small, weighed trace-element-free polyethylene bags or tubes and oven-dried for 22 hours at 55°C. After cooling in a desiccator, the packaged specimens are sealed and weighed, prior to irradiation in a nuclear reactor. Certified reference materials (CRM)s should always be used to assess the accuracy and precision of the chosen analytical method for hair zinc. Unsatisfactory quality control for hair trace element analysis among laboratories is a widespread problem (Hambidge, 1982; Mikulewicz et al., 2013). A CRM for human hair is available (e.g., Community Bureau of Reference, Certified Reference Material no. 397) from the Institute for Reference Materials and Measurements, Retieseweg, B‑2440 Geel, Belgium. In-house controls prepared from a homogenous sample of finely cut digested hair (or powdered for INAA) should also be prepared and spiked with several different known quantities of zinc and the recoveries measured. The in-house controls should be analyzed in conjunction with a CRM periodically to monitor assay variations in the instrument and digestion procedures.24c.7 Nail zinc
Fewer studies have examined nail zinc as a biomarker of zinc exposure than hair zinc even though the validity of nail selenium as a biomarker of selenium exposure in adults has been confirmed by several reports (Hunter et al., 1990). Nails, like hair, also incorporate zinc into their matrix when they are exposed to the blood supply within the germinal layer of the nail matrix, reflecting the quantity of zinc available in the blood supply at the time of the nail synthesis (He, 2011). The normal rate of growth for nails ranges from 1.6mm per month for toenails to about 3.5mm per month for fingernails (He, 2011). In cases where nail growth is arrested, as may occur in onychophagia (compulsive nail biting), nail zinc should not be used (He, 2011). In healthy individuals not exposed to high levels of zinc in the atmosphere, nail zinc levels are similar to those in hair, with concentrations ranging from 80 to 200µg/g (1.22 to 3.06µmol/g). For example, in German school children aged 3–7years, the average toenail zinc concentration was about 130µg/g (1.99µmol/g) (Wilhelm et al., 1991), although nail zinc concentrations as high as 2000µg/g (30.6µmol/g)have been reported in galvanizers with a high exposure to zinc in the atmosphere (King et al., 2015). In a recent study of young children in Laos, nail zinc concentrations were higher at endline in those children receiving a daily preventive zinc supplement (7–10mg Zn/d) for 32–40 weeks compared to those being given only a therapeutic zinc dose (20g) for 10 days (geometric mean, 95%CI) (115.8, 111.6–119.9 vs. 110.4, 106–104.8µg/g.; p=0.055) (Wessells et al., 2014). Nail zinc concentrations can also be used as a longer-term retrospective measure of zinc exposure in case-control studies. For example, in a prospective study of US urban adults, toenail zinc was assessed in relation to the incidence of diabetes but no significant longitudinal association was found (Park et al., 2016). Nails are exposed to exogenous surface contaminants so all specimens must always be washed using a recommended procedure. Chemicals introduced by nail polish can be removed by washing (He, 2011). Biological factors also affect nail zinc concentrations and include age, possibly sex, rate of growth, and onychophagia (compulsive nail biting). The BOND Zinc Expert Panel classified nail zinc as an “emerging” biomarker with a theoretical association with zinc intake or status, although the sensitivity and specificity to any changes in zinc nutrition need further study (King et al., 2015). No universally accepted reference values exist for fingernail or toenail zinc concentrations exist and the reader is referred to Mikulewicz et al. (2013) for guidelines on their compilation.24c.7.1 Measurement of nail zinc
Nails from all fingers or toes (at least 50mg) should be cleaned before clipping, and then stored in labeled T‑E free polyethylene bags prior to washing. Bank et al. (1981) recommend using an aqueous nonionic detergent, followed by vacuum drying for traditional analytical techniques. For non-destructive analytical methods such as INAA and the newer technique involving laser-induced breakdown spectroscopy (LIBS), cleaning fingernail clippings with acetone (analytical grade) in an ultrasonic bath for 10 minutes followed by drying in air for 20–30 minutes is recommended (Riberdy et al., 2017). All dried specimens should be stored in a desiccator after weighing, prior to analysis. The wet and dry ashing methods and the analytical techniques outlined above for hair zinc concentrations can also be used for nail zinc. Alternatively, tetramethylammonium hydroxide (TMAH) can be used to solubilize nails at room temperature (Batista et al., 2008). Laser-induced breakdown spectroscopy (LIBS) can be used and field-portable hand-held instruments operated from a battery have been developed. Investigations for measuring fingernail zinc in situ are underway (Riberdy et al., 2017). Preliminary results suggest that the in situ measurement of fingernail zinc by LIBS has potential as a non-invasive, convenient screening tool for identifying zinc deficiency in populations but may lack the precision required to generate absolute concentrations to characterize individuals (Riberdy et al., 2017). Research is ongoing to enhance the precision of this in situ method, and confirm its sensitivity and specificity to changes in zinc nutrition. Unlike for hair, no Certified Reference Material exists for nail trace element analysis. Instead, in-house controls prepared from homogenous samples of powdered fingernails and toenails should be prepared, digested if necessary, and spiked with several different known quantities of zinc and the recoveries measured. Alternatively, an aliquot of the in-house control can be sent to an external quality laboratory and the results compared.24c.8 Metallothionein concentrations in circulating blood cell types
Metallothionein is a small, cysteine-rich, metal-binding protein that readily binds to zinc and heavy metals. Up to seven zinc molecules can bind to one metallothionein molecule, that may serve as a small zinc reserve for cells. The highest concentrations of metallothionein are found in the liver, kidney, pancreas, and intestine. Concentrations in the intestine and pancreas respond to changes in dietary zinc intake, suggesting that metallothionein assists in the maintenance of zinc homeostasis in these tissues (King, 2011). Metallothionein also has a role in the acute phase response associated with inflammation when hepatic synthesis of metallothionein is activated, causing the redistribution of zinc from the plasma to the liver (Raiten et al., 2015). Smaller quantities of metallothionein are also present in all tissue cells, and concentrations in serum, erythrocytes, and monocytes have been investigated as potential biomarkers of human zinc status. Serum metallothionein concentrations reflect changes in hepatic metallothionein, so any increase in hepatic levels in response to stress, inflammation etc., will result in concomitantly elevated levels in serum, thus limiting the use of serum metallothionein as a biomarker of zinc status. In contrast to serum, erythrocyte metallothionein is not responsive to stress and appears to be sensitive to severe and moderate restrictions in dietary zinc intake, based on results of depletion-repletion studies (Grider et al., 1990; Thomas et al., 1992). However, because most of the metallothionein in erythrocytes is concentrated in the reticulocyte fraction, changes in erythropoiesis, as may occur with poor iron status, influence total erythrocyte metallothionein levels. With the advent of commercially available immunoassays for metallothionein, more research on the response of metallothionein concentrations in erythrocytes and other blood cell types to changes in dietary zinc intake or status in community-based studies is now possible. However, reference material for metallothionein concentrations is also needed to allow comparison of metallothionein concentrations using different immunoassays across studies (Hennigar et al., 2016). At present, the sensitivity and specificity of metallothionein concentrations in erythrocytes and other blood cell types and their usefulness in community-based studies remains to be established. As a consequence, metallothionein concentration in circulating blood cell types was classified as an “emerging” biomarker of zinc exposure and status by the BOND Zinc Expert Panel (King et al., 2015).24c.9 Metallothionein mRNA expression in circulating blood cell types
Expression of the metallothionein gene is induced by zinc through the binding of zinc to metal-binding-regulatory transcription factor 1 (MTF-1). This transcription factor is known to be sensitive to cellular zinc concentrations, with metallothionein synthesis increasing as cellular zinc increases. Reverse transcriptase (RT) polymerase chain reaction (PCR) assays can be used to measure the response of metallothionein expression in various blood cell types to changes in dietary zinc. Hennigar et al. (2016), conducted a systematic review of sixteen experimentally controlled studies to determine the reliability and sensitivity of metallothionein expression to changes in dietary zinc in a variety of blood cell types. The studies were classified into three groups depending on the amount of zinc consumed per day (< 5, 15–22, and 50mg Zn/d). Only studies on healthy adults (> 18y) with no pre-existing health conditions, and that included baseline measurements or a placebo, were included. In all the studies, a depletion phase (mostly about 10 days) followed by repletion or a supplementation phase (ranging from 10 to 84 days) were included, although some also had a post-supplementation phase during which participants received a placebo tablet. Figure 24c.8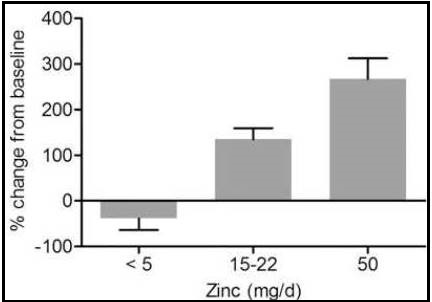
24c.10 Zinc transporter mRNA expression in circulating blood cell types
The discovery of shifts in the expression of the two families of zinc transporters: ZIP 1-14 (zinc “importers”) and ZnT 1-10 (“zinc exporters”) with changes in cellular zinc has stimulated investigations on the usefulness of zinc transporter mRNA expression in circulating blood cell types as biomarkers of zinc status (King et al., 2015). Hennigar et al. (2016), in their systematic review also investigated the response of the expression of several ZIP and ZnT zinc transporter proteins to zinc supplementation and depletion in various blood cell types isolated from healthy adults. Of the transporters, ZIP1 and ZnT1 were the most commonly measured proteins in the review. Inconsistent changes in the zinc transporter expression levels in response to zinc supplementation and depletion across studies were reported. Consequently, more studies are needed to assess the usefulness of zinc transporter expression in circulating blood cell types as a biomarker of zinc exposure or status, especially under free-living conditions when a more typical range of zinc intakes is consumed. (Hennigar et al. 2016) Selection of peripheral blood mononuclear cells as the tissue source for such investigations may be an advantage given the suggestion that immune calls may be the first to respond to a change in zinc status even before plasma zinc falls below the normal range (Prasad, 1998).24c.11 Oxidative stress and DNA integrity
Oxidative stress is caused by an imbalance between the increased production of multiple reactive oxygen species (ROS) (superoxide, hydrogen peroxide, and hydroxyl radicals) and the decreased protective action of antioxidants that are responsible for the neutralization and removal of ROS. Oxidative stress arising from this imbalance has the potential to damage proteins, deoxyribonucleic acid (DNA), and lipids, and may serve as a potential predictor in the development of different ROS-dependent diseases (e.g.,vascular diseases). Zinc plays an important role in antioxidant defence and the maintenance of cellular DNA integrity. As zinc itself is redox inert, it does not function as an antioxidant per se, instead functioning indirectly as an antioxidant and as a “pro-oxidant” over a limited range of zinc concentrations. Consequently, the term “ pro-antioxidant” is used to describe the indirect functions of zinc as an antioxidant. In contrast, outside this range, zinc is a pro-oxidant. Hence, an increase in cellular oxidative stress and DNA damage may be an early sign of both reductions in cellular zinc as well as zinc overload. For more details see Kloubert and Rink (2015). Several human studies have investigated whether intracellular DNA strand breaks, assayed using the comet assay, could serve as a functional biomarker of zinc status. In an experimentally-controlled depletion-repletion study in adult men with low intakes of dietary zinc for six weeks (i.e., 0.6mg Zn/d for one week followed by 4mg Zn/d for five weeks), the number of leukocytic DNA strand breaks increased, but declined when dietary zinc intakes were increased to 11mg Zn/d for four weeks (Song et al., 2009). Another study of adult men in which dietary zinc intakes containing 6mg Zn/d (with added phytate) for two weeks were increased to 10mg Zn/d for 4 weeks, also showed improvements in the repair of DNA strand breaks with increased intakes of dietary zinc. Serum protein concentrations associated with the DNA repair process also increased, despite no change in plasma zinc (Zyba et al., 2017). In a field setting in Ethiopia a decrease in DNA strand breaks was observed after supplementing women with 20mg zinc as zinc sulfate or placebo daily for 17 days, again despite no significant changes in plasma zinc. Taken together, these findings indicate that even modest changes in dietary zinc appear to modulate DNA damage, primarily by reducing cellular oxidative stress, and confirm the sensitivity of the comet assay; see Singh et al. (1988) for assay details. Of note, however, despite modest increases in dietary zinc, there were no measured changes in plasma zinc concentrations, exchangeable zinc pool, erythrocyte or leukocyte zinc concentrations and metallothionein in leukocytes. These findings indicate that zinc attenuates oxidant stress over the range of usual zinc intakes, and in that capacity zinc modulates DNA damage. Nevertheless, many other conditions alter the redox state, so markers of oxidative stress, including DNA strand breaks, are not specific biomarkers for zinc nutrition. Hence, oxidative stress and DNA integrity were classified as “emerging” biomarkers by the BOND Zinc Expert Panel (King et al., 2015).24c.12 Kinetic markers: pool sizes and turnover rates
Isotopic tracer studies in conjunction with a model-based compartmental analysis have identified and measured a relatively small whole-body exchangeable pool of zinc (EZP). This pool comprises the most metabolically active forms of zinc in the plasma, extracellular fluid, liver, pancreas, kidney, and intestine that make up about 10% of the whole-body zinc. The EZP provides zinc for zinc-dependent functions throughout the body and has a turnover rate of about 12.5 days. The size of EZP is estimated to contain 150–200mg zinc in adults, although varying markedly on a per kilogram body weight basis between adults and infants: 2.5mg Zn/kg in adults vs. 4.5mg Zn/kg in infants (King et al., 2001; Krebs et al., 2003). Some but not all studies have shown a relation between dietary zinc and the size of the EZP. For example, the size of the EZP was significantly reduced in adults by severe dietary zinc restrictions (i.e, < 1mg Zn/d for 4–5 weeks) (King et al., 2001) or by chronically low habitual zinc intakes (i.e., average 5.2mg Zn/d) (Sian et al., 1996), but not by modest short-term changes in zinc intake (i.e., 4.6mg Zn/d for 10 weeks) (Pinna et al., 2001). Long-term (6 months) moderate zinc supplementation in male adults was shown to increase the size of EZP, which was reported to correlate positively with total zinc intake (Feillet-Coudray et al., 2005). Of interest is the finding that during the study of severe restriction of dietary zinc (i.e., < 1mg Zn/d for 4–5 weeks) (King et al., 2001), the decline in EZP was nearly comparable to that of plasma zinc (i.e., 60% vs. 65%). This finding suggests that the EZP is part of the vulnerable pool susceptible to zinc depletion, although not more sensitive than plasma zinc concentrations. Whether the size of EZP is reduced by the metabolic redistribution of zinc due to inflammation and stress remains uncertain, although such a decrease is likely since plasma zinc is a component of the EZP (King, 2011). Other factors shown to influence the size of the EZP besides the level of dietary zinc include zinc absorption, age, and sex, with men having a larger pool size than women (Pinna et al., 2001; Krebs et al., 2003; Ruz et al., 2011). Use of the EZP size as a biomarker of zinc nutrition remains limited, in part because of uncertainties about age and sex-dependent cutoffs for zinc insufficiency, the limited sensitivity of EZP to small changes in dietary zinc intake, and the relationship between EZP size and zinc function. In addition, the measurement of EZP necessitates the use of stable isotopes and a mass spectrometer for analysis (King, 2011; King et al., 2015). Isotopic tracer studies have also been used to investigate changes in plasma zinc turnover rates as a biomarker of zinc status. When the total body zinc content is reduced, plasma zinc turnover rates are increased to meet tissue needs. Normally, total plasma zinc turns over about 150 times per day to provide zinc for numerous functions throughout the body. Increases in the plasma turnover rate from about 150–200 times per day have been reported in healthy men as a result of acute, severe zinc depletion (i.e., 0.23mg Zn/d) (King et al., 2001), but not when zinc depletion was more modest (4.6mg Zn/d for 10 weeks) (Pinna et al., 2001). In a study in premenopausal women (n=33), lower intakes of beef, a good source of absorbable zinc, were associated with a reduction in the plasma zinc turnover rate and a reduction in taste acuity (Yokoi et al., 2003). More research is required to establish the validity of plasma zinc turnover rate as a biomarker of zinc status and to standardize the conditions for making the measurements.The BOND Zinc Expert Group classified the kinetic markers based on pool sizes and plasma zinc turnover rates as “emerging” biomarkers as they require more research to establish their sensitivity and specificity to changes in zinc nutrition (King et al., 2015; Allan et al., 2000).
24c.13 Taste acuity
Diminished taste acuity (hypogeusia) is a non-specific characteristic of marginal zinc deficiency and has been investigated as a functional bioindicator of zinc status in both cross-sectional and experimentally controlled studies in children and adults (Hambidge et al., 1972a; Buzina et al., 1980; Gibson et al., 1989a; Wright et al., 1981). For example, in a study of boys 5–7y with low height percentiles and low hair zinc concentrations, impaired taste acuity was reported (Gibson et al., 1989a), but in a zinc depletion study of young men (0.25mg Zn/d for 4–9 weeks), there was a significant decline in their ability to discriminate differences in saltiness compared with baseline levels. This change was unrelated to changes in zinc concentrations in parotid saliva or plasma (Wright et al., 1981). An age-related decline in taste acuity is well established in the elderly, but whether it is associated with a decrease in zinc status is uncertain. Some cross-sectional studies have reported positive associations between taste acuity for salt and erythrocyte zinc in the elderly (Stewart-Knox et al., 2005). Moreover, taste acuity for salt (but not for sweet, sour, or bitter taste) reportedly increased in older adults from Grenoble but not from Rome in response to 30mg Zn/d compared to placebo during a six-month double-blind randomized controlled trial (Stewart-Knox et al., 2008). Loss of taste during irradiation or chemotherapy has been restored with zinc supplementation in some (Yamagata et al., 2003; Najafizade et al., 2013), but not all (Halyard et al., 2007; Khan et al., 2019) studies. Measurement of taste acuity Several methods for testing taste acuity are available. Usually, evaluation is based on assessment of both the detection and recognition thresholds for each of four taste qualities (e.g., sweet, salt, sour, bitter), and sometimes umami (monosodium glutamate). The detection threshold is defined as “the lowest concentration at which a taste can just be detected”; the recognition threshold is “the lowest concentration at which the quality of the taste stimulus can be recognized”. The two thresholds are each determined for one taste quality before proceeding to the next. Several investigators have used this technique on young children (Hambidge et al., 1972a; Buzina et al., 1980). An alternative technique that assesses only recognition thresholds and is better suited to children who are easily distracted and have short attention spans, has been developed (Desor and Maller, 1975). In some of these studies on children, recognition thresholds for only one taste quality (often salt) have been determined. Salt is selected because taste perception to moderately salty solutions changed significantly during a zinc-depletion study of young adult men (Wright et al., 1981). Recognition thresholds for salt have been measured in a study of Canadian school boys with low height percentiles and in Guatemalan school children. In these two investigations, school children with low hair zinc concentrations had higher recognition thresholds for salt than children with hair zinc concentrations indicative of “normal” zinc status (Gibson et al., 1989a; Cavan et al., 1993a). Sodium chloride concentrations used for testing recognition thresholds in these school children were 10, 15, 20, and 25mmol/L (Gibson et al., 1989a). Participants rinse a small amount (10mL) of each solution around in their mouths, expectorate it, and are then asked to identify the presented sample as salty or plain water. Salt solutions of increasing or decreasing concentrations are used, where appropriate, until the subjects correctly identify salt at one concentration and fail to do so at the next lower concentration. Only 2 out of 10 judgments are allowed to be incorrect before moving to the next higher or lower salt concentration. The midpoint between these two concentrations is used as the recognition threshold for salt for each participant. Some studies have used an electrogustometer to measure taste thresholds by applying a weak electric current to the tongue (Prosser et al., 2010). A threshold value is determined by alternately lowering and raising the current todetermine the smallest stimulus that can be discriminated correctly (Grant et al., 1987). For a review of the inherent strengths and limitations of electrogustometry, see Stillman et al. (2003). Automated-computer-controlled electrogustometry can now be used to estimate taste detection thresholds (Stillman et al., 2000), although so far, this method has not been applied in studies of zinc status. For all taste acuity methods, it is preferable to perform the tests midmorning, at least 2 hours after a meal, with the same person administering the test on each occasion. Many other factors affect taste function. Hence, taste acuity should be used in conjunction with other biomarkers to assess zinc status. The BOND Zinc Expert Panel classified taste acuity as an “emerging” zinc biomarker.24c.14 Zinc-dependent enzymes
Although zinc serves in a catalytic role for over three hundred zinc metalloenzymes, no single zinc-dependent enzyme has gained widespread acceptance as a biomarker of zinc status in humans. Their response to zinc deficiency, even in experimental studies of zinc depletion-repletion, has been very equivocal, and none have proved to be a consistent biomarker of zinc status. The physiological symptoms of zinc deficiency probably reflect, a series of biochemical changes (King, 2011). Several zinc metallo-enzymes have been investigated as possible biomarkers of zinc status in plasma, erythrocytes, erythrocyte membranes or in specific cell types. Examples include d-amino-levulinic acid dehydratase, angiotensin-1-converting enzyme, α-D-mannosidase, extracellular superoxide dismutase, nucleoside phosphorylase, carbonic anhydrases, ecto purine 5′nucleotidase, and alkaline phosphatase. Of these zinc metallo-enzymes, the activity of alkaline phosphatase (EC 3.1.3.1) in serum, erythrocytes, or erythrocyte membranes has been most frequently studied. In a systematic review of biomarkers of zinc status that included seven different enzymes (Lowe et al., 2009). Six studies investigated the response of plasma alkaline phosphatase. However, no significant effect of zinc intakes on overall plasma alkaline phosphatase was found after combining the data from zinc depletion and supplementation trials. Alkaline phosphatase in the circulation consists of a mixture of three different isozymes (intestinal, placental, and liver/kidney/bone) and several isoforms. It is possible that assessment of their individual responses to changes in zinc intakes may provide more sensitive and consistent data (King et al., 2015). For the other six enzymes included in the systematic review, the number of studies was too limited to assess their effectiveness as biomarkers of zinc status (Lowe et al., 2009). Hence, based on the available evidence the BOND Zinc Expert Panel classified the activity of zinc-dependent enzymes as “not useful” as a biomarker of zinc exposure or status (King et al., 2015).24c.15 Erythrocyte zinc
The concentration of zinc in erythrocytes is approximately ten times higher than in plasma, and normally 8–14µg/g wet weight or 10–11µg/1010cells. Zinc is present mainly as carbonic anhydrase (EC 4.2.1.1) (80–88%), with a small amount bound to Cu,Zn-SOD (EC 1.15.1.1) (~5%). Approximately 2%–3% is bound to low-molecular-weight-binding ligands. The life span of erythrocytes is 120d. The BOND Zinc Expert Panel classified erythrocyte zinc or erythrocyte membrane zinc as “not useful” based on the inconsistent response to changes in zinc intakes or plasma zinc concentrations (King et al., 2015). For example, in a 49d zinc depletion study, no changes in erythrocyte zinc were seen, despite evidence of impaired taste acuity and immune function, two potential bio-indicators of functional zinc depletion (Ruz et al., 1992). In addition, no response was reported in zinc supplementation studies of 30d and 90d duration, even when a dose of 50mg of zinc/day was used (Thomas et al., 1992; Davis et al., 2000). Taken together, the results emphasize the low sensitivity of erythrocyte zinc. There are no standardized units for the expression of zinc concentrations in erythrocytes, making comparisons among studies difficult. The units can be based on hemoglobin, volume of packed cells, and per cell. There are presently no accepted standards for conversion among these units. No interpretive criteria have been established for erythrocyte zinc.24c.16 Leukocyte zinc
Leukocytes contain up to twenty-five times more zinc than erythrocytes, and have a very much shorter lifespan than the 120-day lifespan of erythrocytes. Concentrations of zinc in leukocytes vary according to the cell type, with monocytes and lymphocytes having the highest concentrations, followed by neutrophils. Mixed white blood cells generally contain 75µg zinc/1010 cells. The BOND Zinc Expert Panel classified concentrations of zinc in leukocytes and leukocyte subpopulations as “not useful” as biomarkers of zinc nutrition in view of the inconsistent results observed in studies of both experimental zinc depletion – repletion (Ruz et al., 1992) and prolonged high zinc supplementation (e.g., 50mg Zn/d) (King et al., 2015). The separation of leukocytes and other specific cell types is difficult, and some of the inconsistencies reported for leukocyte zinc in zinc depletion-repletion studies may result from analyzing mixtures of cell types (e.g., neutrophils and lymphocytes), with different half-lives and zinc concentrations. Further, leukocytes and other specific cellular types are prone to contamination from exogenous sources of zinc and from platelets. Data are also difficult to interpret because no consensus exists for the method used to express zinc concentrations in leukocytes or specific cell types. Results can be expressed on a mg/kg dry weight basis to eliminate the effects of variable cell water content, but results expressed as ng/106 cells are generally preferred (Nishi, 1980; Milne et al., 1985). Additional factors limiting the use of leukocyte zinc or the zinc content of subpopulations is the relatively large volumes of blood (i.e., about 5mL) required for the analysis, and the lack of established interpretive criteria (King et al., 2015).24c.17 Salivary zinc
Concentrations of zinc in saliva have been investigated as a measure of zinc status because zinc appears to be a component of gustin, an essential protein involved in taste acuity, that may be impaired by marginal zinc deficiency (Henkin, 1984). Zinc concentrations in mixed saliva, parotid saliva, salivary sediment, and salivary supernatant have all been investigated, but their use as biomarkers of zinc status is equivocal (Greger and Sickles, 1979; Freeland-Graves et al., 1981; Baer and King, 1984). As well, although the collection of saliva samples is quick and relatively noninvasive, the rate of flow and stimulation of saliva is difficult to control, and diurnal variation in zinc levels may occur (Warren et al., 1981). In view of these problems, and the contradictory results observed, the use of salivary zinc as a biomarker of zinc status has been abandoned.24c.18 Multiple biomarkers
The efficient regulation of zinc homeostasis complicates the assessment of zinc deficiency and excess, and currently there is no single, sensitive, specific biomarker of zinc status. At the population level, three biomarkers have been recommended by WHO / UNICEF / IAEA /IZiNCG (de Benoist et al., 2007) and endorsed by the BOND Zinc Expert Panel (King et al., 2015) to assess zinc status and/or evaluate nutrition interventions to combat zinc deficiency. They are itemized in Section 24c.1.7. Details on the measurement and interpretation of these biomarkers are available from IZiNCG (Technical Briefs No.2 and No.3) and a table listing the relative strengths and weaknesses of the biomarkers is summarized in (King et al., 2015). For each biomarker, an indicator has been developed to estimate risk of zinc deficiency at the population level. These are: (a) the prevalence of usual zinc intakes below the estimated average requirement (EAR), (b) the percentage of the population with low serum zinc concentrations below the appropriate reference limit, and (c) the percentage of children less than 5y with length- or height-for-age less than −2SD below the age-specific median of the reference population (WHO, 2006). For each indicator, a “trigger level” for the prevalence considered indicative of elevated risk and of public health concern is given, at which level an intervention to improve population zinc status is warranted. Ideally, all three indicators should be included in a survey to strengthen the conclusion regarding the zinc status of the population and the need for an intervention, although in practice, this is not always possible. de Benoist et al., 2007 suggest selecting indicators according to the level of available resources (Box 24c.7).Box 24c.7. Resource availability guidelines
For individuals, unless zinc deficiency is severe, moderate or mild zinc deficiency can be present in the
absence of abnormal zinc biomarkers, including serum zinc, despite
the presence of disturbances such as growth retardation, loss of
appetite, and impaired immune function. Hence, for assessing the zinc status of individuals, the
recommended approach is based on a medical history, a qualitative
assessment of the diet, and a clinical assessment, with plasma or serum
zinc providing only supplementary data
(King et al., 2015), as noted earlier.
- Limited resources available. Review existing evidence: Stunting rates (height– or length–for–age Z-score < −2SD) of children under 5y; Dietary patterns and likelihood of providing adequate bioavailable zinc in the food supply; Results from clinical, community-based studies of functional response to zinc supplements; Results from community-based studies on dietary zinc intakes or serum zinc concentration
- Some resources available Augment existing information with data collected in a prospective survey. This would normally be linked with other health/nutrition surveys with broader goals: In at least a subsample of the survey population, or samples focused among subpopulations that are likely beneficiaries of nutrition or health interventions. Include serum zinc concentration and/or dietary zinc intake adequacy as biomarkers; where food-based interventions may be considered, at least 1 day of 24‑hour recall per individual in the sample should be completed
- Adequate resources available Where resources permit: Serum zinc concentration should be determined in a representative sample of all relevant subpopulation groups; 24‑hour dietary recalls, or other locally validated quantitative dietary assessment methods, should be repeated on nonconsecutive days on at least a subsample to estimate the distribution of usual zinc intakes