
Tanumihardjo S.
Principles of Nutritional
Assessment: vitamin A
3rd Edition. March, 2025
Abstract
Vitamin A is a generic term for all retinoids that qualitatively exhibit the biological activity of all-trans retinol and are only found in foods of animal origin. Certain carot-enoids with provitamin A activity, most notably β‑carotene, β‑cryptoxanthin, and α‑carotene, are found in both plant and animal products, although in low-income countries, yellow and orange-colored fruits and dark-green leafy vegetables are the major dietary sources. Vitamin A has a clearly defined role in vision, with ocular lesions characteristic of vitamin A deficiency. In early deficiency, however, signs include growth failure, loss of appetite, and impaired immune response with lowered resistance to infection. The best index of vitamin A status is liver vitamin A stores; measurements below 9.1µmol/g indicate vitamin A deficiency. However, such a measurement is impractical in population studies. Instead, retinol concentrations in serum or dried blood spots are frequently determined, even though they do not reflect body stores until they are severely depleted or excessively high. At a population level, WHO recommend a serum retinol cutoff of <0.70µmol/L to indicate whether vitamin A deficiency is likely to be a public health problem. Serum or dried blood spot concentrations of retinol-binding protein (RBP), a specific vitamin A transport protein, may also be used as a surrogate measure for serum retinol. RBP can be performed using fingerstick blood samples, and the sample collection and analysis (by enzyme immunoassay) are easier and cheaper than for serum retinol. However, no consensus exists on a cutoff value for RBP equivalent to a serum retinol concentration of <0.70µmol/L. Serum carotenoids may serve as a useful secondary index of vitamin A intake when the major sources of vitamin A are dietary carotenoids from plants. Breast milk retinol concentrations can be used to assess suboptimal vitamin A status of lactating mothers, and as an indirect indicator of the vitamin A status of breastfed infants. At a population level, WHO recommend a breast milk retinol cutoff of <1.05µmol/L to indicate whether vitamin A deficiency is likely to be a public health problem. Elevated serum retinyl ester concentrations (i.e., ⋗7.5% or 5% of total vitamin A for adults and children, respectively) in fasting blood samples can be used to assess vitamin A toxicity. Several factors influence concentrations of serum retinol, RBP, and carotenoids, reducing the sensitivity and specificity of the tests. Conditions of collection, storage, and analysis of serum and breast milk should be carefully controlled. HPLC is the preferred analytical method for retinol, carotenoids, and retinyl ester. The physiological functional tests for vitamin A status include the relative dose response or modified relative dose response, assessment of night blindness, the rapid dark adaptation test, and pupillary and visual threshold test. The relative dose response tests can be used to estimate liver stores of vitamin A and thereby identify individuals with marginal vitamin A deficiency. Maternal subjective night blindness assessment is elicited by personal interviews, with a prevalence of > 5% indicative of a significant public health problem for vitamin A deficiency. Before night blindness develops, disturbances in dark adaptation occur which can be detected by the rapid dark adaptation test (RDAT). However, this test is not very sensitive to early signs of vitamin A deficiency, and cannot be used for testing preschool children, so is rarely used today. Instead, the pupillary and visual threshold test, which can be conducted on individuals of all ages using a portable field dark adaptometer, is used. A population mean score of less than −1.11 log cd/m2 indicates vitamin A deficiency. The retinol isotope dilution (RID) test in which an individual is given an oral dose of isotopically labeled vitamin A, is the only method that indirectly provides a quantitative measure of the hepatic stores of vitamin A. Vitamin A deficiency is defined when liver vitamin A concentration is <0.10µmol/g liver. In the future, RID tests will be possible in subsets of population surveys. CITE AS: Tanumihardjo S., Principles of Nutritional Assessment: Vitamin A.https://nutritionalassessment.org/vitamina/
Email: Sherry Tanumihardjo (sherry@nutrisci.wisc.edu)
Licensed under CC-BY-4.0
( PDF ) ( epub )
Vitamin A
18a.1 Introduction
Vitamin A is a generic term for all retinoids that qualitatively exhibit the biological activity of all-trans retinol. The various biologically active forms of vitamin A are shown in Figure 18a.1. Certain carotenoids have provitamin A activity. Of these, α‑carotene, β‑carotene, and β‑cryptoxanthin are the most widely studied. β‑carotene is unique because it can theoretically yield two molecules of retinal, which are subseuently reduced to retinol.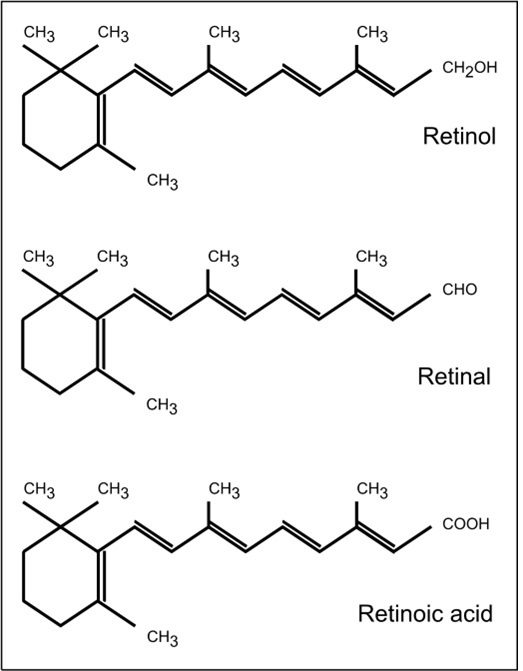
18a.1.1 Functions of vitamin A
Vitamin A has a clearly defined role in vision: when retinal tissue is deprived of vitamin A, rod and cone function is impaired. However, only the biochemical role of the 11-cis retinaldehyde form of vitamin A, in the visual process in rod cells, has been studied in detail. Vitamin A is required for the integrity of epithelial cells throughout the body. The regulatory action of retinoic acid at the level of the gene has an important role in growth, embryonic development, and maintenance of immune function. Both cell-mediated immunity and systemic and mucosal humoral immunity are affected. A review by Tanumihardjo et al. (2016) outlines the various functions and biomarkers of vitamin A status.18a.1.2 Vitamin A deficiency in humans
Early signs of vitamin A deficiency in humans include growth failure, loss of appetite, and impaired immune response with lowered resistance to infection. Xerophthalmia are the sequelae associated with the eye during extreme vitamin A deficiency. Night blindness develops when liver reserves of vitamin A are nearly exhausted. If not corrected, ocular lesions such as conjunctival xerosis, Bitot's spots, keratomalacia, and blindness may occur. In the past, conjunctival impression cytology (CIC) was used to detect early physiological changes characteristic of vitamin A deficiency. Such changes include both the progressive loss of goblet cells in the conjunctiva and the appearance of enlarged, partially keratinized, epithelial cells (Wittepenn et al., 1986; Natadisastra et al., 1988). Filter paper is used to collect the cells and then they are stained. Results have been inconsistent and dependent in part on the severity of the vitamin A deficiency state and on which measures are used. Ocular infections may confound the interpretation (Carlier et al., 1992). Due to relatively low sensitivity and specificity, WHO recommends combining this test with other indicators of vitamin A status (WHO, 1996). Currently the method is not being used in human studies. Vitamin A deficiency still occurs in the world, but major strides have been made in the eradication of blindness through public health interventions, such as high dose capsule distribution and food fortification with vitamin A. The definition for vitamin A deficiency includes both clinical manifestations-xerophthalmia, anemia, growth retardation, increased infectious morbidity and mortality-as well as the following functional consequences: impaired iron mobilization, disturbed cellular differentiation, and depressed immune response (Sommer & Davidson, 2002). Severe deficiencies of certain other nutrients may also simulate vitamin A deficiency. Examples include zinc (Christian and West, 1998) and protein-energy malnutrition (Russell et al., 1983); details are given in Section 18.2.1. Vitamin A deficiency may occur secondary to some disease states, including cystic fibrosis, severe intestinal and liver diseases, and some severe defects in lipid absorption (e.g., cholestasis). In developed countries, the prevalence of frank nutritional deficiency of vitamin A is low. In the U.S. National Health and Nutrition Examination Survey (NHANES III, 1988‑1994), for example, the prevalence of low serum retinol concentrations (<0.70µmol/L) was less than 2% in all age, sex, race or ethnic strata (Ballew et al., 2001). The World Health Organization provides guidance on the use of serum retinol concentrations to evaluate population vitamin A status (WHO, 2011).18a.1.3 Food sources and dietary intakes
Preformed vitamin A is found only in foods of animal origin: fish-liver oils, liver, butterfat, and egg yolk are the major dietary sources. Muscle meats are poor sources of preformed vitamin A. Plant sources, such as nuts, grains, and vegetable oils, have no preformed vitamin A. Provitamin A carotenoids are found in both plant and animal products. In low-income countries the main food sources are yellow and orange-colored fruits (West, 2000) and dark-green leafy vegetables. Red palm oil, and certain indigenous plants such as palm fruits (buriti) in Latin America, and the fruit termed "gac" in Vietnam, are unusually rich sources of provitamin A carotenoids (FAO/WHO, 2002). Provitamin A carotenoids, when derived from ripe yellow- and orange-colored fruits and cooked yellow tubers (e.g., sweet potatoes), appear to be more efficiently converted to retinol than when derived from dark green leafy vegetables (IOM, 2001; West et al., 2002). Processing methods and the food matrix also affect the bioavailability of provitamin A carotenoids (Torronen et al., 1996; Rock et al., 1998; van het Hof et al., 1988). In more affluent countries such as Canada, the United States, and the United Kingdom, the major sources of preformed vitamin A in the diet are liver, milk, and milk products, followed by fish in the United States and Canada (IOM, 2001) and fat spreads (e.g., fortified margarine) in the United Kingdom (Gregory et al., 1990). The major contributors of provitamin A carotenoids are generally vegetables (Gregory et al., 1990; Chug-Ahuja et al., 1993). Of the provitamin A carotenoids, β‑carotene followed by β‑cryptoxanthin are the most important. Other carotenoids important in the human diet include α‑carotene, lutein, lycopene, and zeaxanthin. Currently two conversion factors are used for calculating the amount of vitamin A activity in foods from provitamin A carotenoids, although the values applied differ across agencies. FAO/WHO (2002) still maintain the use of 1µg retinol equals 6µg of β‑carotene and 12µg of other provitamin A carotenoids (mainly α‑carotene and β‑cryptoxanthin). These same carotenoid / equivalency ratios have also been adopted by the European Food Safety Authority (EFSA, 2017). Furthermore, these two agencies express the substances with vitamin A activity as retinol equivalents (RE), whether they are preformed vitamin A (mainly retinol and retinyl esters) in foods of animal origin or provitamin A carotenoids. The U.S. Food and Nutrition Board, however, concluded that the bioavailability of provitamin A β‑carotene from plant sources is 12µg to 1µg retinol and 24µg to 1µg for other provitamin A carotenoids for healthy individuals. For a detailed justification of these conversion factors, see IOM (2001). The U.S has also adopted the term retinol activity equivalents (RAE) for use when calculating the total amount of vitamin A in mixed dishes or diets. If the IOM (2001) conversion factors are adopted, the vitamin A activity in a foodstuff, expressed as a retinol activity equivalency, can be calculated from the following equation: \[\small\mbox{RAE (µg) = retinol (µg) + (β‑carotene (µg)/12.0)}\] \[\small\mbox{+ (other provitamin A carotenoids (µg)/24.0)}\] Such inconsistencies in the specific carotenoids/retinol equivalency ratios applied exacerbate problems when comparing vitamin A values among food composition databases and, in turn, vitamin A intakes across countries. For example, vitamin A intakes calculated from some food composition data may be higher if the lower bioconversion factors for provitamin A carotenoids recommended by FAO/WHO and EFSA were used, rather than the higher bioconversion facturs adopted by the United States (IOM, 2001). Some older food composition tables continue to express vitamin A in terms of international units (IU). Use of these older units is no longer appropriate for assessing dietary adequacy of vitamin A and should be discontinued (FAO/WHO, 2002). For more discussion of the confusion that may arise when assessing dietary vitamin A intakes, see Melse-Boonstra et al. (2017).18a.1.4 Effects of high intakes
Suggestions that vitamin A and its carotenoid precursors are cancer-preventive agents led to increased consumption of large doses of vitamin A. This is a serious health hazard, particularly during pregnancy: hypervitaminosis A has been associated with birth defects (Rothman et al., 1995; Azais-Braesco and Pascal, 2000). Clinical manifestations of vitamin A toxicity include a pseudo brain tumor, skeletal pain, desquamating dermatitis, and hepatic inflammation (Frame et al., 1974; Russell, 2000). Concomitant consumption of ethanol appears to enhance the toxicity of vitamin A (Leo and Lieber, 1999). A U.S. Tolerable Upper Intake Level (UL) has not been set for β‑carotene or carotenoids (IOM, 2000), although β‑carotene supplements are not advised for the general population. For preformed vitamin A, the U.S. UL varies according to life‑stage group, ranging from 600µg/d for infants to 2,800µg/d for adolescents. For nonpregnant, pregnant, and lactating women, the UL is 3000µg/d (IOM, 2001). The U.S. UL is not applicable to vitamin A-deficient populations who should receive vitamin A prophylactically. Approximately 80 countries are using vitamin A supplementation (Wirth et al., 2017). The World Health Organization (2011) recommend routine high-dose vitamin A supplementation in developing countries for children between the ages of 6 to 59mo. For infants 6‑11mo, 100,000 IU should be given as a single dose every 4‑6mo. Children aged 12mo and older should receive 200,000 IU as a single dose every 4‑6mo. No other age groups are recommended for high dose supplementation by the World Health Organization.18a.2 Indices of vitamin A status
Most of the vitamin A in the body is stored in the form of retinyl ester in the liver. Therefore, a measure of liver vitamin A stores is the best index of vitamin A status. The definition of vitamin A deficiency is when liver stores of retinol are below 0.1µmol/g (Tanumihardjo, 2021 ). Vitamin A is not uniformly distributed in the liver (Olson et al., 1979) and can vary by 8-13% among the liver lobes in humans (Olsen et al., 2018). Furthermore, liver biopsies are impractical in population studies. Instead, serum retinol concentrations are often determined. However, the serum or plasma contains only about 1% of the total body reserve of vitamin A, and concentrations do not reflect body stores until they are severely depleted. Consequently, it is best to use other biochemical and physiological functional tests of vitamin A status in combination with serum retinol concentrations. The most used biomarkers of vitamin A status are shown in Figure 18a.2. Details of tests currently used are summarized in a review article (Tanumihardjo et al., 2016) and are discussed briefly in the following sections.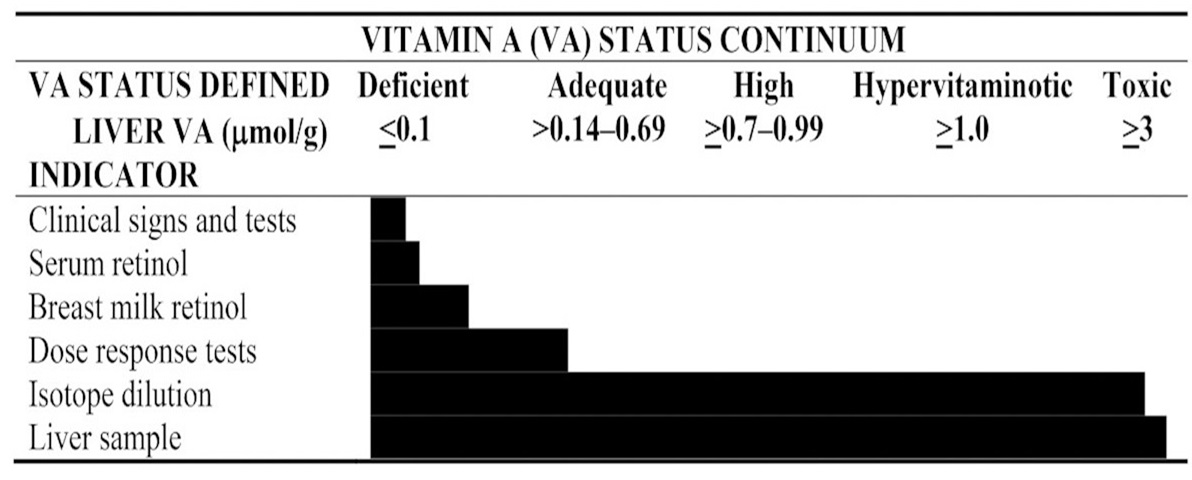
18a.2.1 Serum retinol concentrations
Vitamin A in the plasma circulates largely in a 1:1 complex of retinol and retinol-binding protein (RBP). The remainder is in the form of retinyl ester and very small amounts of retinoic acid and other metabolites (Olson, 1984). Retinyl esters are elevated post-prandially after a meal containing preformed or provitamin A. If retinyl esters are elevated in the fasted state, this is an indication of vitamin A toxicity (Tanumihardjo et al., 2016). In humans, this occurs at a liver vitamin A concentration of 3µmol/g liver (Olsen et al., 2018). Serum retinol concentrations are a common indicator for population studies; however, they only reflect vitamin A status when liver vitamin A stores are severely depleted or excessively high, in which case retinyl esters are also in circulation. When liver vitamin A concentrations are low or adequate, serum retinol concentrations are homeostatically controlled, and levels remain relatively constant and do not reflect total body reserves of vitamin A (Olson, 1984). Hence, it is not surprising that in populations from developed countries, such as the United States, where the liver vitamin A concentrations are generally adequate, positive relationships between serum retinol concentrations and usual intakes of vitamin A are rare (Hallfrisch et al., 1994; Nierenberg et al., 1997). Functional impairment has been seen in undernourished children with extremely low serum vitamin A concentrations. For example, results in India (Pirie and Anbunathan, 1981 ) and Indonesia (Sommer, 1982) showed that at least 75% of the children with xerophthalmia had serum vitamin A concentrations <0.35µmol/L. In contrast, in a sample of 252 clinically normal Indonesian children, only 8% had serum vitamin A at this low concentration. Table 18a.1.| Percent with serum Vit A | ||||
|---|---|---|---|---|
| n | <0.35 μmol/L | 0.35–0.69 μmol/L | ≥0.7 μmol/L | |
| Normal children | 252 | 8 | 37 | 55 |
| Night-blindness or Bitot's spots | 325 | 30 | 55 | 15 |
| Corneal xerophthalmia | 98 | 75 | 24 | 1 |
| Vit. A μmol/L | Age 3–11 y | Age 12–17 y | Age 18–74 y |
|---|---|---|---|
| <0.35 | Vitamin A status is very likely to improve
with increased consumption of vitamin A. Impairment of function is likely. | ||
| <0.70 | Vitamin A status is likely to improve with increased con- sumption of vitamin A |
Vitamin A status is likely to improve with increased con- sumption of vitamin A; some individuals might exhibit impairment of function. |
Vitamin A status is likely to improve with increased con- sumption of vitamin A; impairment of function is likely. |
| 0.70 - 1.05 |
Vitamin A status of some sub- jects may improve with in- creased consumption of vita- min A. Improvement is most likely in those with values 0.70 - 0.95µmol/L. | Vitamin A status may improve with increased consumption of vitamin A. Improvement is more likely in those with values 0.70 - 0.95µmol/L. | Vitamin A status may improve with increased consumption of vitamin A. Some individuals may exhibit impairment of function. |
18a.2.2 Serum retinol-binding protein
Retinol-binding protein (RBP) is a specific vitamin A transport protein. It is called holo‑RBP when it is bound to retinol; the portion without retinol is called apo‑RBP. If the liver becomes depleted in retinol, as occurs in the late stages of vitamin A deficiency, RBP accumulates in the liver as apo‑RBP, and levels of both serum retinol and RBP decline. Retinol-binding protein has a single high affinity binding site for a molecule of retinol. The resultant complex of RBP ⨦ retinol, together with one molecule of plasma transthyretin, form a trimolecular complex. Thus, the molar ratio of retinol to RBP in circulation is about one to one. Concentrations of serum RBP may thus be used as a surrogate measure for serum retinol. The assay of RBP is particularly useful in populations where resources and technical support are limited: sample collection and the analytical procedures are easier and cheaper than for serum retinol, and the analysis can be performed on serum from a fingerprick blood sample. Several studies have confirmed the positive correlation of serum retinol and serum RBP (Solomons et al., 1990; Almekinder et al., 2000; Hix et al., 2004). In a study in the Republic of the Marshall Islands of children who were deficient in vitamin A, Gamble et al. (2001) showed significant correlations between serum retinol and serum RBP (r=0.94) across all retinol concentrations. Severe vitamin A deficiency (serum retinol <0.35µmol/L) was predicted with 96% sensitivity and 91% specificity using serum RBP at 0.48µmol/L as the cutoff, and more moderate vitamin A deficiency (serum retinol <0.70µmol/L) with 87% sensitivity and 98% specificity using a serum RBP cutoff of 0.70µmol/L. Hence, the measurement of serum RBP concentrations appeared to be a practical alternative to using serum retinol in this population. Similar findings were noted for pregnant women in Malawi (Almekinder et al., 2000). Nevertheless, a variety of factors may influence the binding of RBP to retinol. These include the presence and magnitude of the acute-phase response, protein-energy malnutrition, liver disease, and chronic renal failure. To overcome these confounding effects, use of the ratio of serum RBP: transthyretin (TTR) has been proposed (Rosales and Ross, 1998; Rosales et al., 2002). Transthyretin is unaffected by vitamin A status but, like RBP and serum retinol, decreases in infection and trauma. Hence, theoretically, the ratio of RBP:TTR should decline during vitamin A deficiency but not during an acute-phase response, thus enabling these two conditions to be distinguished. Indeed, Rosales et al. (2002) suggest that a cutoff value of 0.36 for RBP:TTR is indicative of marginal vitamin A deficiency. However, use of this ratio has been questioned (Filteau et al., 2000). and more research on the use of the RBP:TTR ratio is warranted. Interpretive criteria for RBP There is no consensus on a cutoff value for RBP equivalent to a serum retinol concentration of <0.70µmol/L (de Pee and Dary, 2002). More research on the relationship of serum RBP and serum retinol concentrations in populations with a range of serum retinol concentrations is required before such a cutoff can be defined and is likely dependent on the kit or method used to evaluate RBP. In the interim, investigators are advised to first establish the relationship between serum retinol and serum RBP in a subsample of the population under study by HPLC before using serum RBP as a surrogate for serum retinol concentrations. This is especially important during pregnancy, when both the transport and the metabolism of RBP are altered (Sapin et al., 2000). Measurement of RBP Retinol-binding protein, unlike serum retinol, is not photosensitive and is less temperature sensitive and more stable during refrigeration — all attributes that facilitate its use in field surveys. The RBP assay can be performed using a specific and sensitive radioimmunoassay procedure in which the RBP is bound to radioactively labeled antibodies. This method has a lower limit of detection of 0.5nmol/L (Blaner, 1990; Rosales, 1998). Alternatively, a rapid quantitative enzyme immunoassay (EIA) can be used that has an average intra‑ and inter-assay variability of 6.7% and 8.0%, respectively (Hix et al., 2004). Tests indicate that the RBP EIA correlates well with serum retinol measured by HPLC. Positive correlations between serum RBP measured by radial immunodiffusion and EIA have been reported (Hix et al., 2004). An EIA method can also measure RBP in dried blood spots. The kit contains three calibrants over the deficient to normal range for RBP. In the future, it may become feasible to measure RBP directly in a drop of whole blood using a portable fluorometer in the field (Craft, 2001). A sandwich ELISA method has been developed where RBP, C‑reactive protein and α‑1‑acid glycoprotein can be analyzed in a single run (Erhardt et al., 2004). When properly standardized, this assay could replace serum retinol analysis by HPLC at a fraction of the cost.18a.2.3 Serum retinyl ester
In normal healthy people, retinyl esters constitute less than 5% of the total vitamin A content in fasting serum samples. However, when the capacity of the liver to store vitamin A is exceeded — for example, after the chronic ingestion of excessive amounts of vitamin A (hypervitaminosis A), or in liver disease — vitamin A is released into the circulation as retinyl esters, and then elevated concentrations of serum retinyl esters are observed. For example, in three patients with hypervitaminosis A, retinyl esters made up 67%, 65%, and 33% of the total vitamin A present in the plasma (Smith and Goodman, 1976). A cutoff point of retinyl esters >10% of total vitamin A was used to reflect potential hypervitaminosis in adults. Ballew et al. (2001) studied the validity of this cutoff by examining the distribution of concentrations of serum retinyl esters in samples from NHANES III. They noted that 37% of the sample of adults aged 18y had serum retinyl ester concentrations above the cutoff point, but they were unable to find any associations between serum retinyl ester concentrations and five biochemical indices of liver dysfunction. Nonetheless, elevated retinyl esters >7.5% of total was associated with a liver reserve of 3µmol/g (Olsen et al., 2018), and 5% of total was suggested for use in children where more sensitive biomarkers of liver reserves of vitamin A noted hypervitamionsis A (Mondloch et al., 2015; Williams et al., 2021). Fasting blood samples are essential for serum retinyl ester measurements because concentrations rise transiently after the ingestion of a vitamin A-rich meal or of vitamin A supplements. Measurement of retinyl ester concentrations in serum can be performed using HPLC. The low levels in fasting serum can be measured concurrently with serum retinol concentrations.18a.2.4 Serum carotenoids
Approximately 50 carotenoids show provitamin A activity and provide about 50% of the total vitamin A intake in the United States, as well as larger percentages in Asia, Africa, and parts of South America. In those countries where dietary carotenoids from plants are the major source of vitamin A and where dietary patterns are relatively constant, serum carotenoids may serve as a useful secondary index of vitamin A intake. For populations receiving most of their vitamin A from animal sources, serum carotenoid concentrations provide no information on vitamin A status Sheftel et al., 2022). Major components of serum carotenoids are lutein, zeaxanthin, β‑cryptoxanthin, lycopene, α‑carotene and β‑carotene. Serum carotenoids are of increasing interest because of their possible antioxidant properties and their relationship to the risk of certain cancers, cardiovascular disease, macular degeneration, and the onset of cataracts (Omenn et al., 1996). Unfortunately, several non-nutritional factors are known to influence serum carotenoid concentrations, including age, sex, alcohol intake, physiological state, body mass index, and season (Brady et al., 1996; Neuhouser et al. 2001). Smoking may also modify the relationship of dietary-carotene and serum-carotene levels (Järvinen et al., 1993). Serum carotenoids were measured following NHANES III. Ford (2000) and Ford et al. (2002) measured serum concentrations of α‑carotene, β‑cryptoxanthin, lutein, zeaxanthin, and lycopene in samples from NHANES III and presented data for the mean and selected percentiles by age, sex, and race or ethnicity. Serum carotenoid concentrations were not uniformly distributed among the population groups. Children, adolescents, and adults of African descent had the highest total carotenoid concentrations whereas overweight children, Caucasian adolescents, and adults had the lowest. Plasma β‑carotene, β‑cryptoxanthin, lycopene, and lutein results are available for the U.K. national surveys (Gregory et al., 1990; 1995; 2000; Finch et al., 1998). Mean, median, and lower and upper 2.5th or 5th percentiles by age and sex are presented. Carotenoids can be both separated and measured by HPLC combined with ultraviolet / visual detection (Sowell et al., 1994) or photodiode array (Mondloch et al., 2o15; Williams et al., 2021). Care must be taken to store frozen serum samples for carotenoid analysis at −70°C or −80°C to avoid decay. A standard reference material for β‑carotene can be obtained from NIST (Gaithersburg, MD). The within subject daily CV for serum β‑carotene for subjects following their normal dietary pattern is 7.2% (Gallagher et al., 1992).18a.2.5 Breast milk retinol
Breast milk retinol concentrations can indicate when the maternal vitamin A intake is suboptimal, because lactating women will secrete breast milk with a reduced content of retinol. This usually reflects inadequacies in both maternal dietary intake and body stores of vitamin A. Breast milk retinol concentrations can also be used as an indirect indicator of the vitamin A status of breastfed infants (Stoltzfus and Underwood, 1995). Most of the vitamin A in breast milk is in the form of retinyl palmitate in the milk fat. Concentrations are very high in colostrum and transitional breast milk (days 7‑21 postpartum). After about day 21, the concentration stabilizes, so that breast milk samples taken after the first month postpartum are the most useful. The concentration of retinol in breast milk varies over the course of a feed: the lowest concentration is in the first milk expressed from a full breast because the fat content is highest at the end of a feed. Hence, preferably all the milk from a full breast that has not been used to feed an infant for at least 2h should be collected. Stoltzfus et al. (1993) used full breast milk samples to investigate the effect of high‑dose vitamin A supplementation on the vitamin A status of mothers and their infants in Indonesia. At 1‑8mo postpartum, the breast milk retinol concentrations of the supplemented mothers were significantly higher than in the placebo group (Figure 18a.4).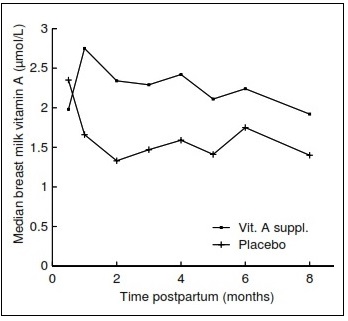
| Indicator (month post-partum) | Vitamin A group [n] |
Placebo group [n] | Standardized difference |
|---|---|---|---|
| Breast milk vit.A (μg/g fat) in casual samples (3 mo) | 2.05 ± 0.44 [36] | 1.70 ± 0.47 [37] | 0.76 |
| Breast milk vit.A (μmol/L) in casual samples (3 mo) | 0.12 ± 0.70 [36] | –0.18 ± 0.48 [37] | 0.50 |
| Maternal serum retinol (μmol/L) (3 mo) | 1.45 ± 0.47 [34] | 1.33 ± 0.42 [35] | 0.27 |
| Breast milk vit.A (μmol/L) in full samples (3 mo) | –0.33 ± 0.74 [33] | –0.45 ± 0.53 [35] | 0.19 |
| Breast milk vit.A (μg/g fat) in full samples (3 mo) | 1.87 ± 0.51 [33] | 1.82 ± 0.45 [35] | 0.10 |
18a.2.6 Relative dose response
The relative dose response (RDR) test can be used to estimate the liver stores of vitamin A and thereby identify individuals with marginal vitamin A deficiency. The test is based on the observation that during vitamin A deficiency, when liver stores are diminished, RBP accumulates in the liver as apo‑RBP. Following the administration of a test dose of vitamin A, some of the vitamin A binds to the excess apo‑RBP in the liver. It is then released as holo‑RBP (i.e., RBP bound to retinol) into the circulation (Loerch et al., 1979). Consequently, in vitamin A- depleted individuals, there is a rapid and sustained increase in serum retinol after a small oral dose of vitamin A, whereas in individuals with normal liver vitamin A stores, this rise in serum retinol is either very small or does not occur. The validity of the RDR test as an index of body stores of vitamin A has been studied by comparing vitamin A concentrations in liver biopsy samples with corresponding RDR test results for otherwise healthy surgical patients (Amédée-Manesme et al., 1984; 1987). Of the twelve surgical patients, the two with the lowest liver vitamin A concentrations had the highest RDR values. Following supplementation with vitamin A, RDR values fell to <5%. Patients with liver vitamin A concentrations ranging from 0.2 to 1.5µmol/g had RDR values from 0% to 12% (Amédée-Manesme et al., 1984). In a study of Brazilian children from low-income families, all the children with serum retinol concentrations <0.70µmol/L had elevated RDR values. Moreover, 86% of the children with serum retinol concentrations of 0.74‑1.02µmol/L, and 26% with serum retinol concentrations of 1.05‑1.40µmol/L also had elevated RDR values Flores et al., 1984) (Table 18a.4).| Serum retinol (µmol/L) | % | No. tested |
|---|---|---|
| ≤0.70 | 100 | 12 |
| 0.71 - 1.04 | 86 | 21 |
| 1.05 - 1.39 | 26 | 19 |
| >1.40 | 3 | 39 |
| Total tested | 91 |
18a.2.7 Modified relative dose response
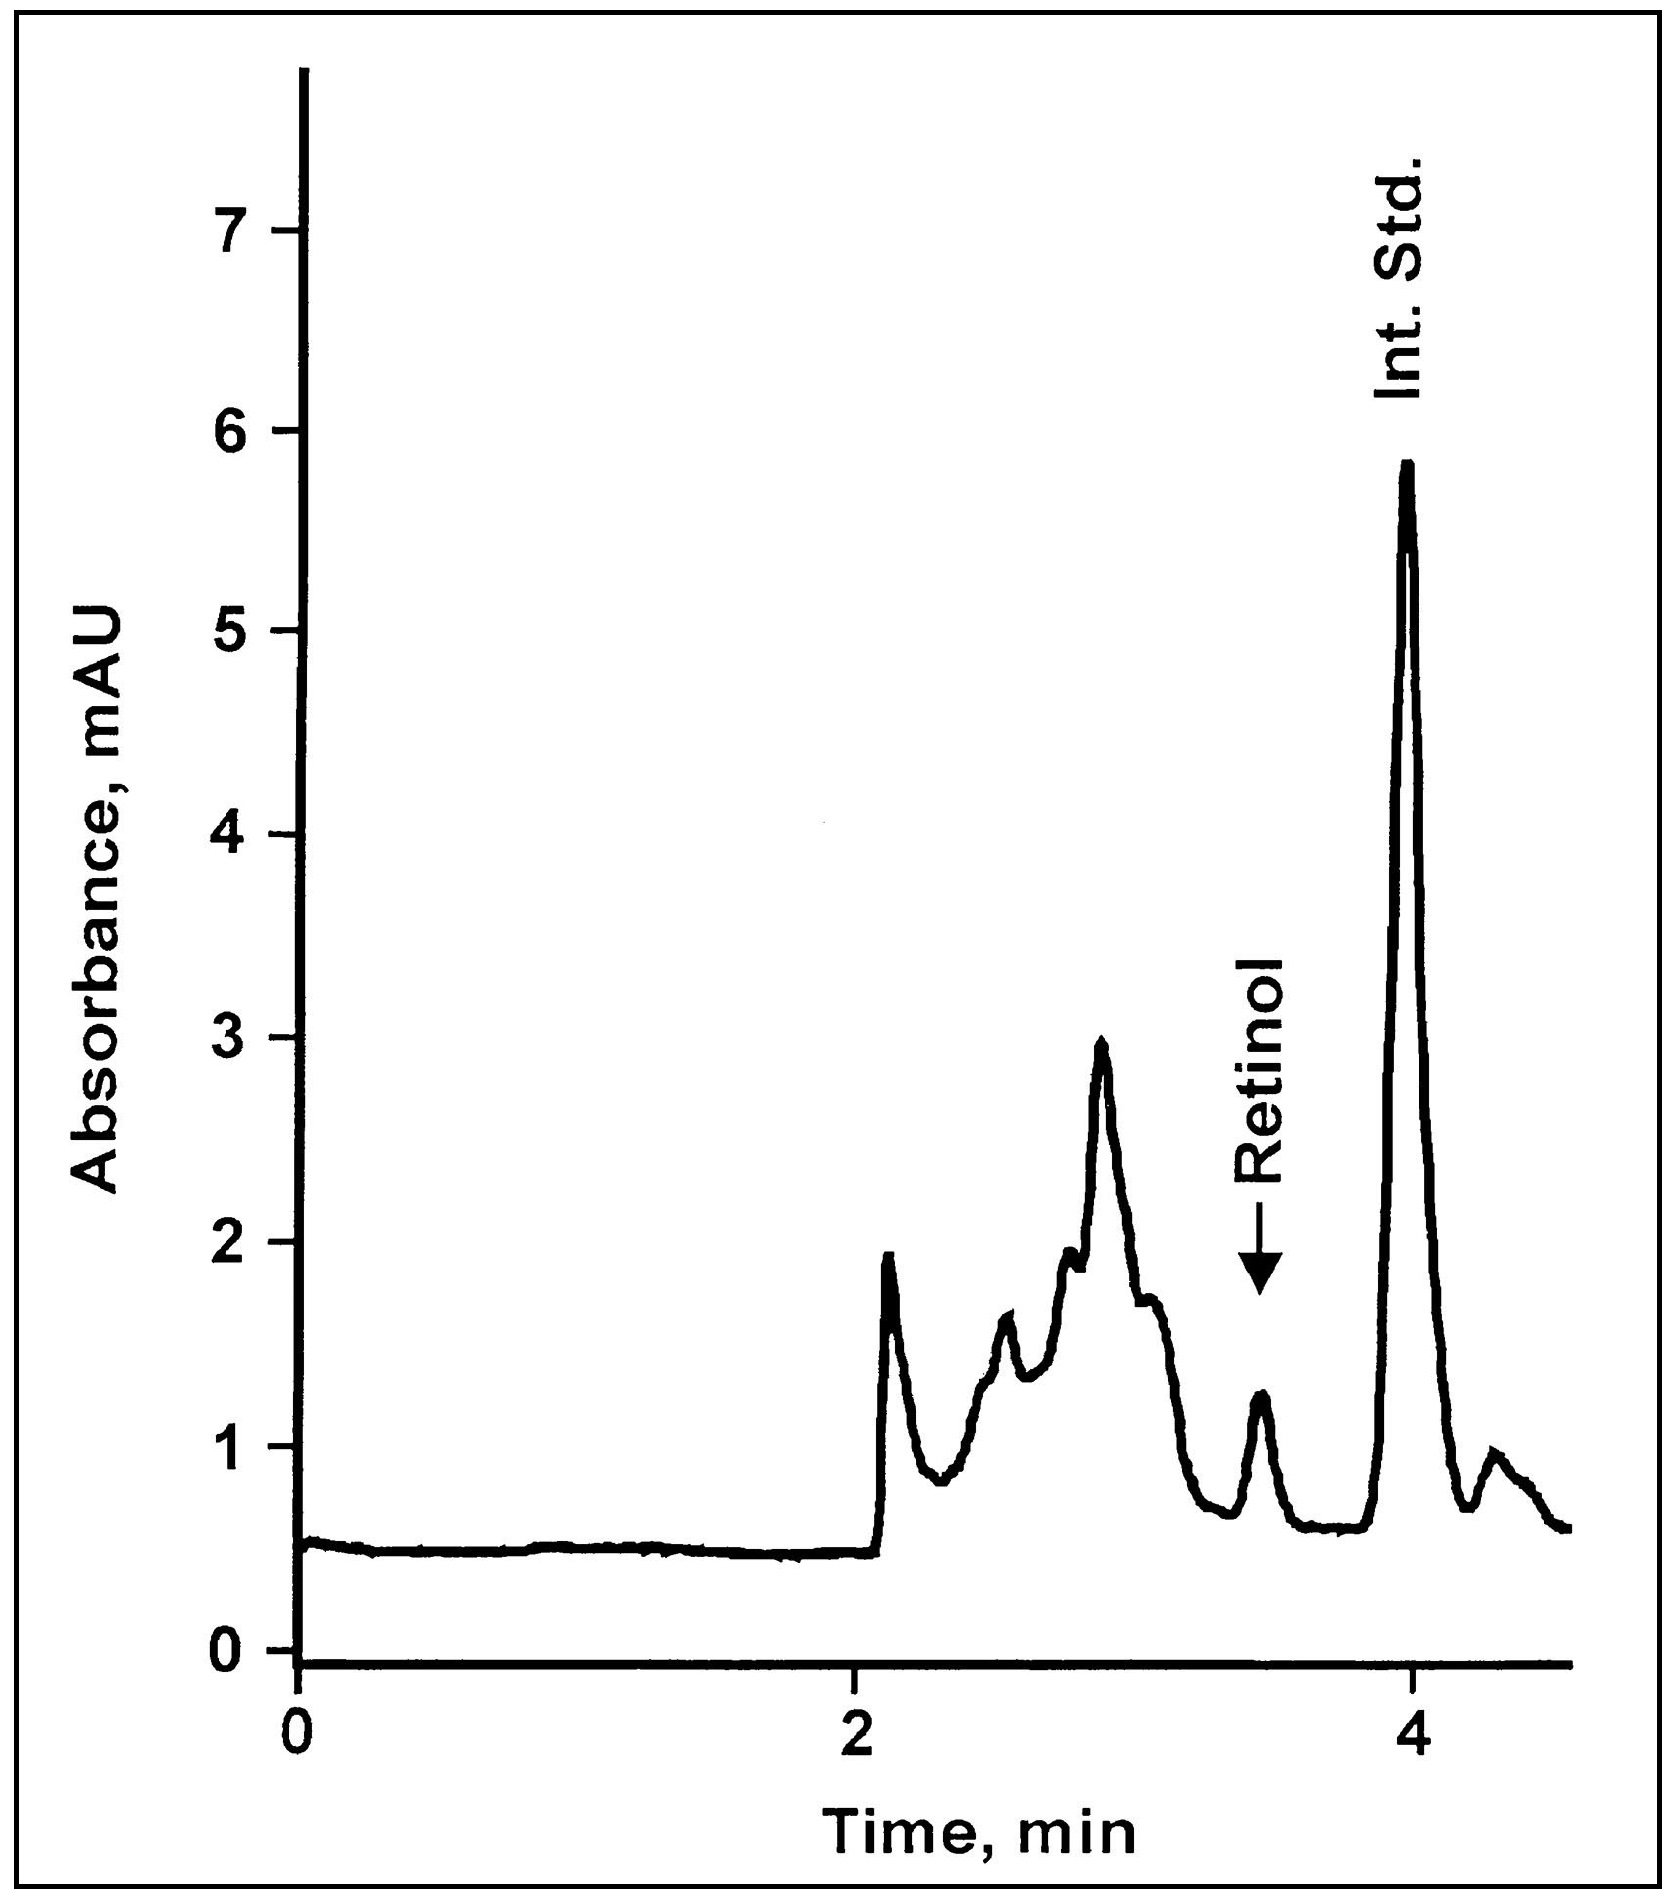
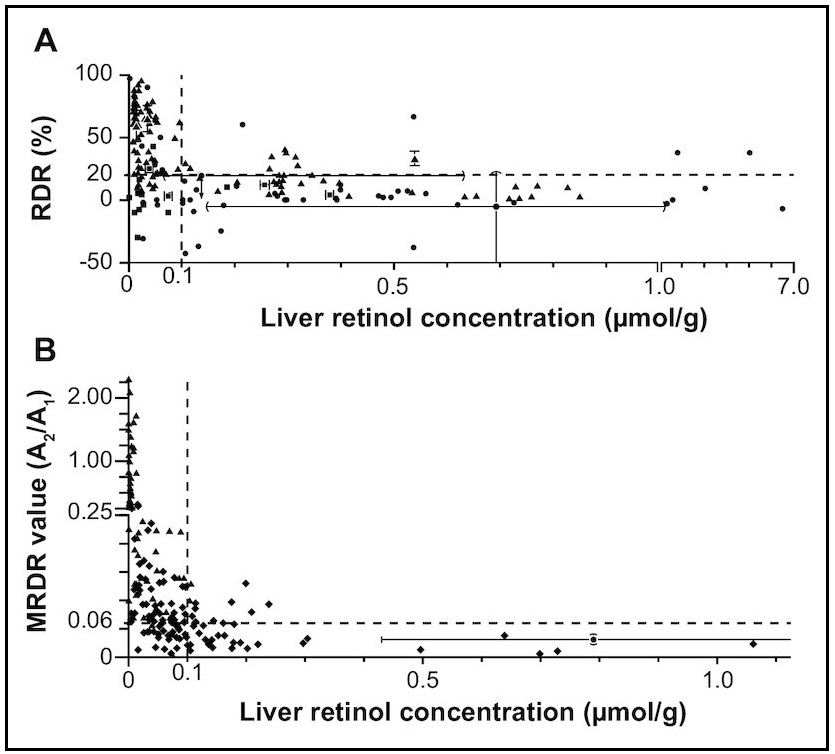
The modified relative dose response (MRDR) test requires only one blood sample, avoiding the necessity of taking a baseline sample. This modified test has been used to assess the vitamin A status in children and in pregnant and lactating women (Tanumihardjo et al., 1990; 1994; 1995; 1996). For the test, a small oral dose of vitamin A2 is administered, usually 3,4‑didehydroretinyl acetate (DRA). This is followed by a high-fat, low-vitamin A snack to facilitate the absorption of the DRA. The latter combines with the RBP in the same way as retinol but, unlike retinol, is not normally found in human plasma except when high levels of freshwater fish are consumed. The DRA is hydrolyzed in the gastrointestinal tract to 3,4‑didehydroretinol (DR), absorbed, and reesterified, mainly with palmitic acid in the intestinal mucosal cells (Tanumihardjo et al., 1995). The serum concentrations of DR and retinol (R) in the single blood sample are measured by HPLC. The molar ratio of [DR]:[R] in the blood sample is a measure of the response. Interpretive criteria for the MRDR Ratios ≥0.060 are considered indicative of marginal vitamin A status (subclinical deficiency), whereas those <0.030 are satisfactory (Tanumihardjo et al., 1996). The WHO (1996) criteria for a moderate public health problem are a prevalence of MRDR ratios >0.060 of between 20% and 30%. If the prevalence is >30%, the public health problem is severe. Because of the preferred use of the MRDR in subsets of population studies, these criteria are being reexamined. A limitation is that DRA is not yet commercially available and presently must be synthesized in the laboratory. Nonetheless, the test has been used in several population health surveys (Faye et al., 2021; Williams et al., 2021; Suri et al., 2021). A systematic review and meta-analysis revealed 80% sensitivity and 69% specificity for the MRDR test using total liver reserves of 0.10µmol retinol/g as the reference standard for definition of vitamin A deficiency (Figure 18a.5) (Sheftel and Tanumihardjo, 2021). Measurement of the MRDR The recommended doses of DRA for use in the field are 3.0µmol for infants, 5.3µmol for preschool children (2 to 6y), 7.0µmol for preadolescent children (6‑12y), and 8.8µmol for teenagers and adults (>12y) (Tanumihardjo et al., 1996). The acceptable time between administering the oral DRA dose and obtaining a single blood sample (about 0.5‑2ml) is 4‑7h. To enhance the stability of the DRA dose, it should be dissolved in corn oil and stored in amber vials inside a cooler on ice in the field, or at −20°C to −70°C for long‑term storage. The blood sample should also be stored on ice in a light-protected cooler after collection, prior to separation of the serum. Analyses of DR and retinol (R) concentrations in the serum should be performed by HPLC. The molar ratio of [DR]:[R] (sometimes reported as A2/A1) is then calculated.18a.2.8 Subjective assessment of night blindness
Night blindness, or the inability to see after dusk or at night, has been reported among young children and women of reproductive age in developing countries with moderate to severe vitamin A deficiency (Escoute et al., 1991; Christian et al., 1998). It is the most common ocular manifestation of vitamin A deficiency and is often described by specific terms in countries or cultures where the prevalence is high. For example, in some cultures it is known as "chicken eyes" or "chicken blindness" (Christian, 2002). Poor dark adaptation resulting in night blindness arises when there is reduced production in the rods of the visual pigment rhodopsin, or opsin protein bound to the retinal form of vitamin A. To assess the prevalence of night blindness, the local term for night blindness must first be identified through focus group discussion (Dawson et al., 1993), and its reliability field tested. Next, a night blindness history is elicited via interviews. Care should always be taken during this stage to exclude those individuals whose night blindness results from other causes, such as the rare hereditary eye disease retinitis pigmentosa.| Clinical status | n | Mean (µmol/L) |
|---|---|---|
| Night blindness reported; no conjunctival xerosis or Bitot’s Spots | 174 | 0.49 |
| Controls | 161 | 0.62 |
| No night blindness; conjunctival xerosis and Bitot’s Spots present | 51 | 0.47 |
| Controls | 45 | 0.60 |
| Night blindness reported; with conjunctival xerosis and Bitot’s Spots | 79 | 0.42 |
| Controls | 76 | 0.64 |
| Vitamin A status indicators | Night blind N n(%) | Not night blind
N n(%) | OR | 95% CI |
|---|---|---|---|---|
| Serum retinol <0.7 μmol/L | 85 44 (51.0) | 90 19 (21.1) | 4.0 | 2.2–7.4 |
| Serum retinol <1.05 μmol/L | 85 65 (76.5) | 90 50 (55.5) | 2.5 | 1.4–4.6 |
| CIC abnormal | 85 24 (28.2) | 90 11 (12.2) | 2.8 | 1.3–6.1 |
| Dark adaptation abnormal | 94 67 (71.2) | 98 42 (43.8) | 3.3 | 1.8–6.0 |
| Breast milk vit. A <1.05 μmol/L | 94 56 (59.6) | 97 41 (42.3) | 2.0 | 1.1–3.6 |
| prevalence | Minimum sample for 20% relative precision | Minimum sample for 50% relative precision | |
|---|---|---|---|
| Mild | <1% | — | — |
| Moderate | ≥1% to <5% | 4706 | 753 |
| Severe | ≥5% | 1825 | 292 |
18a.2.9 Rapid dark adaptation test
Before night blindness develops, disturbances in dark adaptation occur. These can be detected by specially designed noninvasive tests (Congdon et al., 1995). The conventional laboratory-based, formal dark adaptometry test is a tedious and time- consuming procedure. Instead, a rapid dark adaptation test (RDAT), suitable for field conditions, has been developed. This is based on the measurements of the timing of the Purkinje shift (Thornton, 1977), in which the peak wavelength sensitivity of the retina shifts from the red toward the blue end of the visual spectrum during the transition from photopic or cone‑mediated day vision to scotopic or rod‑mediated night vision. This shift causes the intensity of blue light to appear brighter than that of red light under scotopic lighting conditions. The RDAT requires a light‑proof room, a light source, a dark, nonreflective work surface, a standard X‑ray view box, and sets of red, blue, and white discs; details are given in Vinton and Russell (1981). Measurements for the RDAT are undertaken during the first few minutes of dark adaptation. This is a disadvantage because the measurements rely mainly on the cones or light vision cells in the retina instead of the rods or dark vision cones. As a result, the test is not very sensitive to the early signs of vitamin A deficiency (Favaro et al., 1986; Kemp et al., 1988). An additional disadvantage is that the RDAT is not appropriate for preschool children, who are too young to perform the test accurately. This is unfortunate because preschool children are the group most at risk for vitamin A deficiency. False positives may also occur and between examiner variability may produce inconsistencies in the results. Age influences dark adaptation and hence must be taken into account when determining the normal range of the rapid test adaptation times for healthy reference populations (Vinton and Russell, 1981).18a.2.10 Pupillary and visual threshold test
A scotopic (dim light vision) device has been developed to assess the responsiveness and sensitivity of the pupil to light as an indication of an individual's dark adaptation threshold. The test measures the threshold of light at which pupillary contraction occurs under dark-adapted conditions (Congdon et al., 1995). A portable field dark adaptometer was developed that includes a digital camera, retinal bleaching flash, and Ganzfeld light source housed within a pair of light-obscuring goggles (Labrique et al., 2015). Pupillary response measurements may be more affordable for countries wishing to use this device. Unlike the RDAT, the pupillary and visual threshold test can be conducted in the field on individuals of all ages, including preschool children, who cannot be tested by the RDAT. The test requires minimal cooperation from the subjects and takes about 20 min per subject. A darkened facility is required for this test. A portable tent has been developed and tests devised to ensure that the darkness in the testing area is adequate (Sanchez et al., 1997). The apparatus consists of two handheld illuminators, each having a yellow-green, light-emitting diode light source (dominant wavelength = 572nm) with 12 intensity settings. Each illuminator is designed to fit entirely over one eye and to illuminate the entire retina. One of the illuminators is designed to measure light of "low intensity" (illumination range: 8.75 to ‑3.00 log cd/m2) and the other "high intensity" (illumination range ‑4.16 to 0.44 log cd/m2). Before testing, participants are subjected to a camera-flash "partial bleach" of the full retina, which involves placing the subjects in a dark room and exposing them to a camera flash reflected through a foil-lined cone, after which they are allowed 10 min of dark adaptation. The visual threshold is measured first by placing the low‑intensity illuminator over the subject's left eye. The light intensity is then incremented over 11 intensity settings (roughly a 4‑log unit range) at 10s intervals until a pupillary response (i.e., quick contraction of the pupil on presenting the stimulus) is seen in the uncovered right eye on two successive trials. The uncovered right eye is observed with an obliquely mounted red LED light source (dominant wavelength = 626nm), which preserves dark adaptation in both the subjects and the observer. Next, the pupillary threshold is measured, as described above, using the high intensity illuminator; further details are given in Congdon et al. (1995; 2000) and in Christian et al. (2001). All tests should be performed using standardized procedures and well-trained examiners, as discussed in Christian et al. (2001). The stimulus for the visual or the pupillary threshold is defined as the lowest level at which the subject can correctly distinguish stimulus from non-stimulus on three successive trials. High pupillary and visual scores reflect a pupillary response achieved at a greater light intensity, and indicate poorer dark adaptability (Congdon et al., 1995). Additional studies are needed to establish whether testing for both pupillary and visual thresholds is necessary, because the latter requires less training and standardization of personnel. In some studies on young children aged 1 to 2y, only pupillary testing has been performed because complete visual testing on such young children is not always possible (Congdon et al., 1995). The pupillary and visual threshold tests have been validated as an index of vitamin A status using controlled vitamin A supplementation trials on children and pregnant women (Congdon et al., 1995; 2000; Congdon and West, 2002). Significant improvements in dark adaptation as assessed by visual and/or pupillary testing were reported in those subjects supplemented with vitamin A but not with a placebo. Moreover, dark adaptation scores, measured by visual and/or pupillary testing, correlate well with serum retinol, as shown in Figure 18a.6, and with RDR (Congdon et al., 1995; 2000; Sanchez et al., 1997).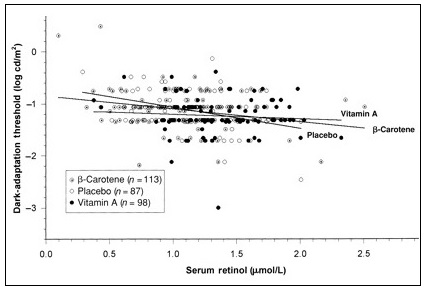
18a.2.12 Stable isotope methods and total body stores of vitamin A
Retinol isotope dilution (RID) tests are the only method that indirectly provide a quantitative measure of the hepatic stores of vitamin A. It involves the administration of an oral dose of isotopically labeled vitamin A. The dose is allowed to mix with the vitamin A pool in the body. A post-dose blood sample is taken, and the ratio of labeled to non-labeled vitamin A in serum is measured by mass spectrometry. The amount of total body stores of vitamin A is related to the extent of dilution of the labeled tracer and is calculated using prediction equations (Gannon and Tanumihardjo, 2015). The isotope dilution method was validated in adult surgical patients in the United States and Bangladesh by measuring liver vitamin A biopsy samples (Furr et al., 1989; Haskell et al., 1997). For example, in ten U.S. surgical patients, the correlation coefficient between calculated and measured liver vitamin A concentrations was 0.88. The length of time required for the isotopic dose to equilibrate with the vitamin A pool in the body varies according to the age and total body vitamin A stores of the study group. Equilibration periods after the test dose ranging from 11 to 26d have generally been used (Furr et al., 1989; Haskell et al., 1998; Ribaya-Mercado et al., 1999), although Tang et al. (2002) suggest that 3d may suffice. A shorter equilibration time facilitates the use of this isotope-dilution method in field settings, but may not offer an accurate quantitative estimate. The MRDR test should be considered if enough time is not available in the field to obtain the post-dose sample. The RID test has been used mostly in research settings, but the application for use in subsets of population surveys is on the horizon (Tanumihardjo, 2020). The International Atomic Energy Authority has assisted many low-income countries on its use (Sheftel et al., 2018). A combined analysis from five African countries revealed stark differences in vitamin A status based on total liver vitamin A reserves estimated by RID. Ethiopia was experiencing vitamin A deficiency, while South Africa had a high rate of hypervitaminosis A (Suri et al., 2023). Interpretive criteria The RID test using appropriate assumptions, gives a prediction of the total liver vitamin A reserves (Gannon and Tanumihardjo, 2015). Therefore, a value that represents accurate vitamin A status is determined because actual hepatic reserves are estimated. While best used at the group level, vitamin A status can be viewed across the continuum, such as that represented in Figure 18a.2 Hepatic liver reserves to define vitamin A deficiency and toxicity The criteria to define vitamin A deficiency were evaluated in light of the Dietary Reference Intakes (DRIs) for North Americans (Tanumihardjo, 2021 ). The criteria used to formulate DRIs were clinical eyes signs, circulating plasma retinol concentrations, bile excretion containing vitamin A metabolites, and long-term vitamin A storage. In consideration of DRI criteria, induced biliary excretion and long-term vitamin A storage do not occur until liver vitamin A concentrations are ≤0.10µmol/g (Tanumihardjo, 2021 ). Therefore, in line with recommendations of an expert group working on Biomarkers of Nutrition for Development (Tanumihardjo et al., 2016), vitamin A deficiency should be defined as <0.10 µmol/g liver. Direct measure of hepatic vitamin A concentrations are only feasible in special circumstances, either during surgery (Furr et al., 1989; Haskell et al., 1997) or on cadavers (Olsen et al., 2018). In children (n=366) dying from multiple causes, vitamin A deficiency was found in 34.2% and hypervitaminosis A was determined in 8.7% (Gupta et al., 2024). This underlines the fact that vitamin A deficiency is still a public health concern in young children.18a.2.13 Multiple indices
Vitamin A deficiency disorders are not defined with any certainty using a single measure of vitamin A status. WHO (2011). has recommended a combination of biochemical, functional, and clinical indicators for children aged 6-71mo; the indicators are given in Table 18a.8.| Indicator (cutoff) | Mild prevalence below cutoff | Moderate prevalence below cutoff | Severe prevalence below cutoff |
|---|---|---|---|
| Night blindness present | >0 to <1% | ≥1% to 5% | ≥5% |
| Serum retinol ≤ 0.70 μmol/L | ≥2% to <10% | ≥10% to <20% | ≥20% |
| Breast milk retinol ≤ 1.05 μmol/L or ≤ 0.028 μmol/g (≤ 8μg/g) milk fat | <10% | ≥10% to <25% | ≥25% |
| RDR ≥20% | <20% | ≥20% to <30% | ≥30% |
| MRDR ratio ≥0.06 | <20% | ≥20% to <30% | ≥30% |