
Combs GF Jr., Principles of
Nutritional Assessment:
Selenium
3rd Edition August 2024
Abstract
In only a few decades, the trace element selenium (Se) was added to the Nutrition agenda as an essential nutrient with potential to reduce cancer risk. Found in the 1950's to prevent vitamin E deficiency disorders in animals, initial investigations in animal nutrition spawned studies of metabolic mechanisms starting in the 1960's. It is now known that Se functions as an essential constituent of some 25 proteins that contain a previously unrecognized Se-containing amino acid, selenocysteine. These selenoproteins are thought to discharge the nutritional functions of Se. The relationship of one, glutathione peroxidase, to the level of Se intake was used in 2000 to establish an RDA for Se. Se is typically obtained from protein-rich foods, particularly those produced on Se-rich soils. Low Se status occurs in areas of low soil Se, and among individuals consuming low-protein diets. Many consequences of Se deprivation are sub-clinical in nature, requiring other precipitating factors (vitamin E deficiency, low iodine intake, viruses, carcinogens) to reveal the effects of sub-optimal expression of selenoenzymes and/or insufficient amounts of active Se-metabolites. Studies that started in the 1960's showed that Se can prevent carcinogenesis in animal and cell models, and that anti-tumorigenic activities required Se doses greater than those required to support selenoenzyme expression. Only a few clinical intervention trials have been conducted to test the hypothesis that Se supplementation can reduce cancer risk in humans; most, but not all have shown positive results. Hence, whether Se may be a risk modifier for cancer remains unclear.
CITE AS: Combs GF Jr, Principles of Nutritional Assessment: Selenium
https://nutritionalassessment.org/ selenium/
Email: gfc2@cornell.edu
Licensed under CC-BY-4.0
( PDF )
25b.1 Overview
Selenium (Se) is an essential nutrient with several multiple biological activities. It was first recognized for its toxic potential in the 1930's when it Se was identified as an active principal in a plant-induced neuropathy of grazing horses and cattle in the northern Great Plains of the United States (Painter, 1941). In the 1950s its nutritional role was discovered with experiments with laboratory and livestock species that found the element to prevent pathologies in vitamin E-deficient animals (Schwarz & Foltz, 1957; Schwarz et al.,1957; Patterson et al., 1957). Then, in the 1980s its role in human health was indicated with the finding that very low blood Se levels were associated with an endemic heart disease in women and children in parts of China (Ge et al., 1983), and Se-supplementation was found to be preventive by the Keshan Disease Research Group (1979). In parallel studies starting in the 1960s, Se was shown to have anti-tumorigenic capabilities in a variety of animal models (Combs and Lu, 2006; Yan and DeMars, 2012; Yan and Combs, 2014). Clinical trials later showed cancer risk reduction for subjects of low-to-moderate Se status (Yu et al., 1991; Blot et al., 1993; Taylor et al., 1994; Blot et al., 1995; Clark et al., 1996; Yu et al., 1997), ,although one showed no effect (Lippman et al., 2009).That the various roles of Se have different dose-response relationships has been demonstrated in experimental animals. Biochemical and physiological lesions of Se deficiency are prevented by relatively low dietary levels, e.g., 0.1mg/kg (Combs and Combs, 1986). Reductions in experimental tumorigenesis occur when Se is fed at 10–20 times the nutritional level, i.e., ≥ 1.5mg/kg (Ip and Ganther, 1990; Ip, 1998). Adverse effects are not seen unless still greater dietary levels are used, i.e., > 5mg/kg (Combs and Combs, 1986). Because Se intakes of free-living people can seldom be ascertained accurately, Se status in humans must be inferred from measures related to the intake and disposition of Se.
25b.2 Selenium Chemistry
The chemistry of Se has similarities to that of sulfur (Combs and Combs, 1986; Combs, 2016). Hence, Se can be incorporated in plants and animal tissues in lieu of sulfur. However, Se-compounds have higher redox potentials. Thus, while sulfides are metabolized to sulfates, selenate is metabolized to selenide. The biochemistry of Se involves mainly its three anionic forms: Se2- (selenide and hydrogen selenide [H2Se]), SeO2+3 (selenite and selenous acid (H2SeO3), and SeO2+
4 (selenite and selenic acid [H2SeO4]). Selenide is pivotal in Se metabolism, as HSe– is the obligate precursor for the biosynthesis of selenocysteine (SeCys) , the functional form of the element. Selenite is easily reduced. At low pH it is readily reduced by such agents such as ascorbic acid and SO2. It can also readily react with nonprotein thiols (e.g., reduced glutathione [GSH]) or with protein-sulfhydryl groups subsequently to be reduced to selenide via sequential formation of selenotrisulfides (e.g., oxidized glutathione [GSSeSG]) and selenodisulfides (e.g., glutathione selenol [GSSeH]). Selenate is much more resistant to reduction; it is activated to adenosine-5-phosphoselenate as a first step in its physiological reduction.
The major forms of Se in cells are the selenoamino acids selenocysteine and selenomethionine (SeMet). In each, Se is covalently bound to carbon. selenocysteine is co-translationally synthesized in animal tissues; whereas, selenomethionine is produced in plants and microorganisms using elemental Se in lieu sulfur. Animal tissues can incorporate selenomethionine into proteins nonspecifically in place of methionine (Met).
25b.3 Health Effects
25b.3.1 Animals
Selenium was recognized as an essential nutrient when it was found to be the active component of yeast that prevented necrotic liver degeneration in vitamin E-deficient rats and exudative diathesis in vitamin E-deficient chicks (Schwarz and Foltz, 1957; Schwarz et al., 1957; Patterson et al., 1957). Se deficiency is now known to play roles, with vitamin E, in preventing several nutritional diseases of livestock (Combs and Combs, 1986; Surai and Fisinin, 2016): skeletal myopathy of lambs, calves, horses, chickens and ducks; gizzard myopathy in turkey poults; cardiomyopathy in pigs; placental retention in dairy cows; infertility in boars. Accordingly, Se, typically in the form of sodium selenite (Na2SeO3), is commonly included as a nutritional supplement in formulated animal feeds.25b.3.2 Humans
Severe endemic Se deficiency has been linked with two diseases of humans: a juvenile cardiomyopathy (Keshan disease) and an osteoarthropathy (Kashin-Beck disease) (Combs and Combs, 1986). These disorders were described in rural, mountainous areas of central and northeastern China and Russia (eastern Siberia) where food systems were exceedingly low in Se (soils < 125µgSe/kg; grains < 40µgSe/kg) and humans had blood Se levels < 25ng/mL (compared to 85–200ng/mL in the United States).Keshan disease is a multifocal myocarditis primarily affecting children 2–10y and, to a lesser extent, women of child-bearing age. Diagnosis is based on signs of acute or chronic cardiac insufficiency, cardiac enlargement, arrhythmia, and electrocardiographic abnormalities (Ge et al., 1983). Affected individuals may show cardiogenic shock or congestive heart failure. In the 1970s, Chinese scientists found Se effective in preventing the disease (Keshan Disease Research Group, 1979). This led to the widespread use of Se supplements (oral doses of sodium selenite at 0.5–1mg Se/wk, or table salt fortified with selenite at 10–15mg Se per kilogram body weight) (Keshan Disease Research Group, 1979; Chen et al., 1980). Such interventions have virtually eliminated Keshan disease from previously affected areas. It appears likely that Keshan disease may be caused by cardiophilic RNA viruses the virulence of which can be potentiated by severe Se deficiency through increased viral mutation (Beck and Levander, 1998; Beck, 2007). This suggests that Se deficiency may also increase risks for other diseases caused by RNA viruses (e.g., measles, influenza, hepatitis, and HIV/AIDS).
Kashin-Beck Disease is an osteoarthropathy affecting the epiphyseal and articular cartilage, and epiphyseal growth plates of growing bones. However, the etiology is unclear. It presents as enlarged joints (especially of fingers, toes and knees); shortened fingers, toes and extremities; and, in severe cases, dwarfism. A meta-analysis of 15 clinical trials (Zou et al., 2009) suggested that Se supplementation had some value in preventing the disease. However, additional factors, including iodine deficiency and exposure to fungal toxins, have been suggested as etiological factors.
Microbiome. Dietary Se may also affect the hindgut microbiome, which is involved in immunologic signaling, energy abstraction from non-digested carbohydrates, and carcinogenic risk. Se reaches the hindgut in the form of non-digested Se from the diet and endogenous Se from enterohepatic circulation and sloughed mucosal cells. Selenium has been shown to promote taxonomic diversity of the microbiome of the rat (Kasaikina et al., 2011), which is capable of producing methylated Se-metabolites independent of the host (Krittaphol et al., 2011). Because methanogenic Archaea and gram+ bacteria express selenoproteins (Kryukov and Gladyshev, 2004; Foster, 2005). it is possible that these species may be growth-limited by Se supply.
25b.3.3 Anti-carcinogenesis
That Se may be anti-carcinogenic was first suggested in the late 1960s based on inverse relationships of cancer mortality rates and forage crop Se contents in the US (Shamberger and Frost, 1969; Shamberger and Willis, 1971).Animal models. The results of virtually all animal and cell models used, show that both inorganic and organic Se compounds can prevent or reduce carcinogenesis (Ip, 1998). Some of these effects may involve actions of selenoenzymes preventing DNA damage by reducing hydroperoxides. Other anticarcinogenic effects, particularly those associated with supranutritional Se intakes, may involve Se metabolites increasing programmed cell death by way of redox cycling, attacking protein thiols and/or labilizing proteins critical for tumor cell growth and their spread (Jackson and Combs, 2011; Yan and DeMars, 2012; Combs and Yan, 2016). The results of studies with animal tumor models are clear: Se can inhibit both primary and secondary carcinogenesis.
Studies by Ip and colleagues (Ip et al., 1991; Ip, 1998) indicated methylselenol (CH3SeH, produced by the methylation of H2Se; Fig 1) as active in Se-antitumorigenesis. CH3SeH can modulate the expression of key genes in the p53 pathway and lymphocyte cell surface ligands that trigger immune activation Zeng et al., 2013). and reduces plasma proteases and angiogenic factors required for tumor spreading (Li et al., 2008; Yan et al., 2012; 2014). The involvement of CH3SeH and perhaps other methylated Se-metabolites in Se-antitumorigenesis suggests underlying mechanisms that may become significant at supranutritional Se intakes (Jackson and Combs, 2008): redox cycling of H2Se and/or CH3SeH to generate reactive oxygen species (ROS); modifications of protein-thiols by H2Se and/or CH3SeH to affect protein function/turnover; Met mimicry by selenomethionine in proteins to sensitize critical regulatory proteins to ROS.
Humans. Whether Se supplementation can be useful in reducing cancer risk in human populations is less clear. Only a few clinical trials have been conducted to test the hypothesis that Se-supplementation can reduce cancer risk (Yu et al., 1991; Blot et al., 1993; Taylor et al., 1994; Blot et al., 1995; Clark et al., 1996; Yu et al., 1997; Lippman et al., 2009). While one trial with males of relatively high Se status found no effects on prostate cancer risk (Lippman et al., 2009); most found cancer risk reductions for subjects of low-to-moderate baseline Se status. One well designed trial found supplemental Se to reduce prostate cancer risks in subjects with baseline plasma Se < 106ng/mL, but not in those of greater baseline Se status (Combs et al., 2001; Duffield-Lillico et al., 2003). Meta-analyses of prospective studies and Se-intervention trials (Lee et al., 2011; Dennert et al., 2011) concluded that Se supplementation had a preventive effect on cancer incidence in populations with baseline serum Se levels < 126ng/mL and in high-risk populations for cancer. Subsequent systematic reviews (Vinceti et al., 2014; Cai et al., 2016) indicated that people of higher Se status or with greater Se intakes had lower risks of several types of cancer; but no protective effects of Se supplementation were detected (Cai et al., 2016). Overall, it appears that high Se status can reduce the risk of certain cancers in many people, especially those with low or nutritionally adequate, but not high, Se status (Combs and Yan, 2016).
25b.3.4 Selenosis
That Se can be toxic was recognized before its nutritional function. Almost nine decades ago it was found to be the an active principal in a neuropathy of grazing horses and cattle, grazing on Se-accumulator plants growing on seleniferous soils of the northern Great Plains of the United States (Painter, 1941). Subsequent investigations have characterized selenosis in both its acute and chronic forms (Combs and Combs, 1986).Acute Selenosis has occurred in humans due to accidental ingestion of gram quantities of Se in high-Se solutions including gun bluing, sheep drench and anti-dandruff shampoo (Combs and Combs, 1986; Institute of Medicine, 2000). Each case involved rapid development of severe gastrointestinal and neurological symptoms followed by acute respiratory failure, myocardial infarction and renal failure. Some cases showed garlic odor of the breath, an early sign in Se-intoxicated animals (Franke and Moxon, 1938; Jiang et al., 1983) due to the excretion of dimethylselenide ([CH3]2Se) across the lung (Buchan, 1947; Skorniakova et al., 1969). In rodents, injected selenite causes a dose-dependent increase in excreted (CH3)2Se (Tiwary et al., 2005) even at sub-toxic doses when it can represent nearly 30% of the dose (Yonemoto et al., 1985; Tandon, et al., 1986; Magos et al., 1987; Vandhanavikit et al., 1987).
Chronic Selenosis. Endemic selenosis occurred in the early 1960s in Enshi County, Hubei Province, China where residents consumed foods containing very high levels of Se (several hundred mg/kg) due to the use of the ash from local high-Se coal ash to amend agricultural soils (Yang et al., 1983, 1989b, 1989c). During the years of peak prevalence (1961-1964), the five most heavily affected villages experienced morbidity rates approaching 50% and some individuals having blood Se levels as high as 3,200ng/mL. The most common signs were hair and nail loss; lesions of the skin, nervous system and teeth were also reported. Dietary Se intakes, estimated a few years later, averaged about 5mg/day, with individuals with Se intakes less 1500µg/day not showing adverse effects.
Diabetes Risk. Two clinical trials found plasma Se concentrations exceeding about140ng/mL to be associated with increased risk of type 2 diabetes (T2D) (Bleys et al., 2007; Stranges et al., 2007). Those findings were based on self-reports of T2D and/or medication use consistent with T2D, unconfirmed with measures of circulating glucose, insulin or glycated hemoglobin (HbA1c). They have not been confirmed in other randomized Se-intervention trials, including one in which subjects showed plasma Se concentrations exceeding 200ng/mL (Thomson et al., 1982). Nevertheless, a study of gestating rats found the high-level Se exposure (3mg Se/kg diet) of dams to induce insulin resistance and glucose intolerance late in gestation and in offspring after several weeks postpartum (Zeng et al., 2012). A similar experiment with pigs found fed a diet containing 3mg Se/kg to support greater circulating insulin levels, with normal glucose levels, compared to those fed the nutritional level (Liu et al., 2012).
25b.4 Selenium Requirements
The Institute of Medicine of the National Academy of Sciences Recommended Dietary Allowance (RDA) was based on maximal expression of Glutathione Peroxidase 3 observed in two studies Institute of Medicine, 2000). The first study involved Chinese adults with a basal intake of 11µg Se/day supplemented with graded levels of selenite (Yang et al., 1987). It indicated that Glutathione Peroxidase 3 activity increased until it plateaued at a total Se intake of 41µg/day. Adjusting for differences in the body weights of the subjects and most Americans, this yielded an estimated requirement of 52µg Se/day. The second study involved adult New Zealanders with baseline intake of 28µg Se/day and supplemented with graded levels of Se as selenomethionine (Duffield et al., 1999). Significant increases in Glutathione Peroxidase 3 activity were seen with 10µg supplemental Se/day, suggesting a requirement of 38µg Se/day. The IOM used the average of the two estimates, 45µg/day, as the Estimated Average Requirement (EAR). Assuming a 10% coefficient of variation, the RDA for was set at 55µg/day for both men and women. RDAs for children were extrapolated from this value based on body weight. Those for infants, however, were based on projected Se intakes from breast milk (birth–6mos: 15µg/day), and from breast milk plus complementary foods (6mos–1y: 20µg/day). Additional Se was recommended during pregnancy and lactation, bringing those RDAs to 60µg/day and 70µg/day, respectively. The World Health Organization (1996) based its recommendations on amounts of Se needed to support two-thirds of maximal Glutathione Peroxidase 3 activity. Based on the data of a single study (Yang et al., 1987), that intake was imputed to be 26µg Se/day. Adjusting for body weight and assumed interindividual variation, the WHO recommended Se intakes for men and women were set at 40 and 30µg Se/day, respectively. Neither of these groups considered the clear differences in the bioeffacies of selenite and the major form of Se in foods, selenomethionine. Xia et al. (2005) showed that selenomethionine was more effective than selenite in supporting Glutathione Peroxidase 3 expression in low-Se Chinese subjects with graded levels of Se over a 4‑month period (Xia et al., 2005).The US Food and Drug Administration set a “no observed adverse effect level” (NOAEL) for Se at a whole blood Se concentration of 1000ng/mL, which they calculated to correspond to a dietary intake of 853g/day in an adult male (Poirier, 1994). The Institute of Medicine Institute of Medicine, 2000). set a tolerable upper Se intake level (UL) for adults at 400ug/d, i.e., about half the NOAEL; other national bodies adopted similar recommendations, i.e., 350–450µg/d for adults (Hurst et al., 2013).
25b.5 Food Sources
Plant Foods. The Se contents of foods vary widely due to the differences in the soluble Se contents of soils, in the capacities for various plant species to access soil Se, and, for livestock products, in the amounts of biologically available Se in feeds. The Se contents of plant foods tend to be influenced by the local soil Se environment. For example, cruciferous vegetables, which are naturally rich in sulfur, can accumulate nutritionally significant amounts of Se (1–10mg/kg) if grown on high-Se soils or if fertilized with selenite or selenate salts. Studies in many countries have shown the effects of geographic variation in the Se contents of foods (Combs et al., 2001). Wheat grain may contain > 2–5mg Se/kg if produced in parts of the northern plains of North America; but as little as 0.1mg Se/kg if produced in Kansas or New Zealand; and only 0.005mg Se/kg if produced in Shaanxi Province, China. On a global basis, foods with the lowest Se contents are found in the provinces of Heilongjiang, northern Shaanxi, and Sichuan in China.Animal Foods. Because of the intimate relationship between plants and animals in the food chain, the Se contents of foods of animal origins tend to be influenced by the local soil Se environment. Se is widely used as a supplement to livestock feeds, usually as sodium selenite/selenate. This practice has reduced geographic variation in the Se contents of animal food products. It does not, however, markedly increase tissue Se contents, as the incorporation of inorganic Se is limited to the synthesis of selenocysteine in the selenoproteins. Because both selenocysteine and selenomethionine are found mainly as constituents of proteins, the Se contents of foods of animal origin tend to be correlated with their protein content. Therefore, muscle meats from most species tend to contain 0.3–0.5mg Se/kg higher (4–15 times) amounts.
Human Diets. In most human diets, the dominant food sources of Se are cereals, meats and fish. In American diets fewer than two dozen foods provide most of the total dietary Se, with five foods contributing half: beef, bread, pork, chicken and eggs (Schubert et al., 1987). Dairy products contribute small amounts of Se to the total intakes in most countries, except in cases where their consumption is relatively high or where the rest of the diet provides little Se, or both (e.g., New Zealand). Vegetables and fruits are uniformly low in Se and provide only small amounts in most diets.
Because Se in foods is almost exclusively associated with protein, individuals with chronically low protein intakes are at risk for Se deficiency. Accordingly, Se-responsive muscular pain and weakness was been described in patients receiving long-term total parenteral nutrition without Se-supplementation (van Rij et al., 1979; Johnson et al., 1981; Stanley et al., 1982; Vinton et al., 1987; Terada et al., 1996), and protein-malnourished children with kwashiorkor or marasmus were found to have low plasma Se levels (Burk et al., 1967; Squali Houssaini et al., 1997; Ashour et al., 1999).
Selenium Intakes. Data from 68 countries indicated that suboptimal Se status (plasma/serum Se < 70–80ng/mL) is prevalent in almost half of those countries (Combs et al., 2001). Estimates of the average Se intakes in 18 countries varied from as low as 3µg/d in a Keshan disease-endemic part of China to as high as 224µg/d in Canada and Venezuela. The estimated intakes of several countries (Greece, Libya, New Guinea, Sweden, Turkey and the United Kingdom) fall below the U.S./Canadian RDA (Navarro-Alarcon and Cabrera-Vique, 2008). These differences are reflected in the average plasma/serum Se levels of residents of various countries, which span an order of magnitude (Combs et al., 2001).
25b.6 Enteric Absorption
In general, food Se is well utilized. For the Se-amino acids, this involves digestion of their respective proteins, and absorption of the digestive products by active transport. For inorganic forms of Se, which do not require digestion, this involves absorption by simple (selenite) or carrier-mediated (selenate) diffusion (Wolffram et al., 1985; Turner et al., 1990; Van Dael et al., 2002). Wastney et al (2011) found that the enteric absorption of single doses (200µg) by humans was 98% for selenomethionine-Se and 84% for selenite-Se. Similar results were obtained by Thomson and Robinson (1986).25b.7 Metabolism
Figure 25b.1.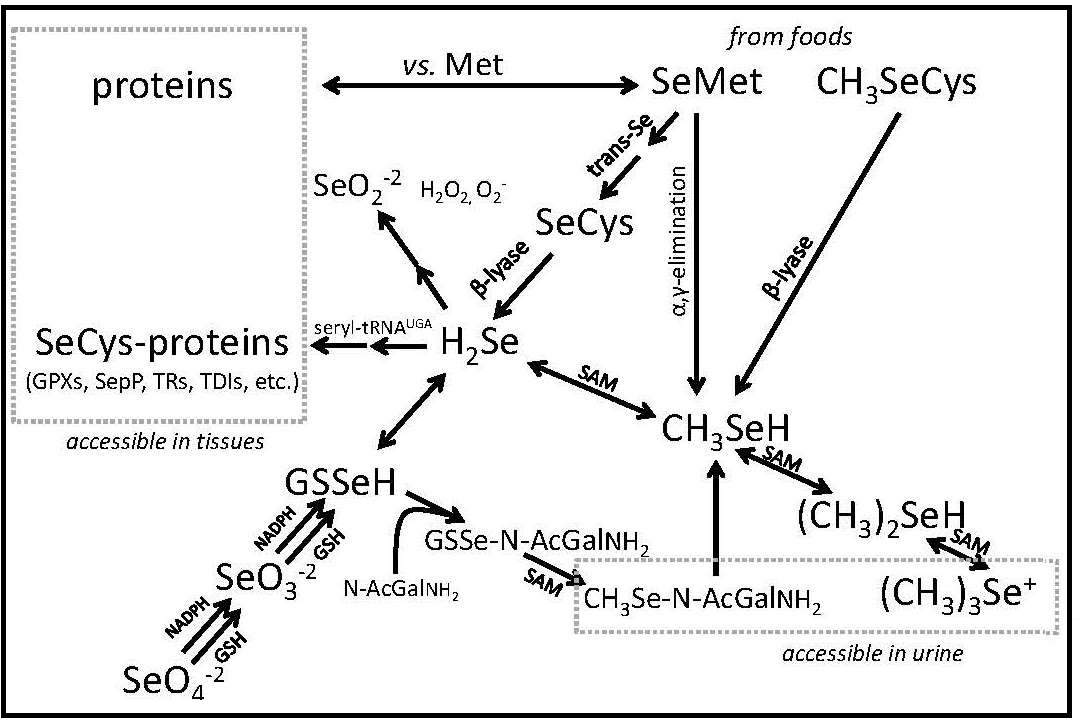
2 = selenium dioxide; SeO-2
3 = selenite; SeO-2
4 = selenate; CH3SeH = methyselenol; (CH3)2SeH = dimethylselenide; (CH3)3Se+ = trimethylselenonium ion Modified from Combs (2015), Nutrients, 7, 2209-2236,
3 (selenite and selenous acid (H2SeO3), and SeO2+
4 (selenite and selenic acid [H2SeO4]).
Se is excreted by conversion to methylated metabolites Combs, 2016). The primary route of Se excretion in individuals with low-to-moderate Se intakes is across the kidney. The dominant urinary metabolite is a selenosugar, 1β-methylseleno-N-acetyl-galactosamine (Kobayashi et al., 2002). Individuals with relatively high Se intakes can also excrete trimethylselenonium or other selenosugars in the urine, as well as methylselenol in the breath. The latter is responsible for the “garlic breath” associated with selenosis in livestock. Metabolic tracer studies have shown that, over a 12-day period, Se-adequate adults excrete a total of 17% of Se from an oral selenite dose, but only 11% of Se from an oral selenomethionine dose, the longer turnover being due to the nonspecific incorporation of selenomethionine into body proteins (Patterson et al., 1989). Under normal circumstances, there appears to be only a small enterohepatic circulation of absorbed Se; therefore, fecal Se constitutes mostly unabsorbed dietary Se.
25b.8 Biochemical Functions
The nutritional activities of Se are discharged by a group of selenoproteins, i.e., proteins containing selenocysteine. Selenoproteins are relatively rare in nature, occuring in bacteria, archaea, and eukaryota in varying numbers. None have been identified in fungi and plants. In eukaryotes, the greatest number of selenoproteins occurs in aquatic organisms (many fishes and algae have > 30 selenoproteins); 25 selenoproteins have been identified in humans (Gladyshev, 2016). Most, if not all, are involved in the regulation of redox signalling.The best understood and most abundant members of the human selenoproteome include:
- Glutathione Peroxidases (GPXs), which reduce hydroperoxides using reducing equivalents from reduced glutathione (Flohé L and Brigelius-Flohé R, 2006).
- Selenoprotein P (SEPP), produced and excreted by the liver, functioning as the primary transporter of Se to peripheral tissues, and comprising 40–60% of total plasma Se (Burk and Hill, 2009).
- Iodothyronine Deiodinases (DIOs), which remove iodine from the thyroid hormones (T4, T3) in the metabolism of the active hormone, T3 (Köhrle, 2013).
- Thioredoxin Reductases (TRRs), NADPH-dependent flavoenzymes that function in intracellular redox regulation by reducing thioredoxin (Tamura and Stadtman, 1996).
Genomic searching (Kryukov et al., 2003; Shchedrina et al., 2010) has revealed additional selenoproteins:
- SepH: a nuclear protein of unknown function.
- SepI: a protein homologous to human choline/ethanolamine phosphotransferase with seven putative transmembrane domains.
- SepK, SePS : proteins of unknown function localized to endoplasmic reticulum (ER) and plasma membranes of mammalian cells.
- SepM, SepN, SepO, SepT: proteins of unknown function localized in the endoplasmic reticulum .
- SepV: a paralog of SepW apparently expressed only in the seminiferous tubules of the testes.
25b.9 Assessing Selenium Status
Se status refers to the amount of metabolically active or potentially metabolically active Se in the body. It includes the Se pool that is metabolically functional and, thus, the most nutritionally relevant, as well as other Se pools that can be mobilized to functional forms. It is a product of an individual's intake, retention and metabolism of Se-containing compounds. Accordingly, Se status has four components: Se intake, tissue Se, Se excretion and Se function (Figure 25b.2).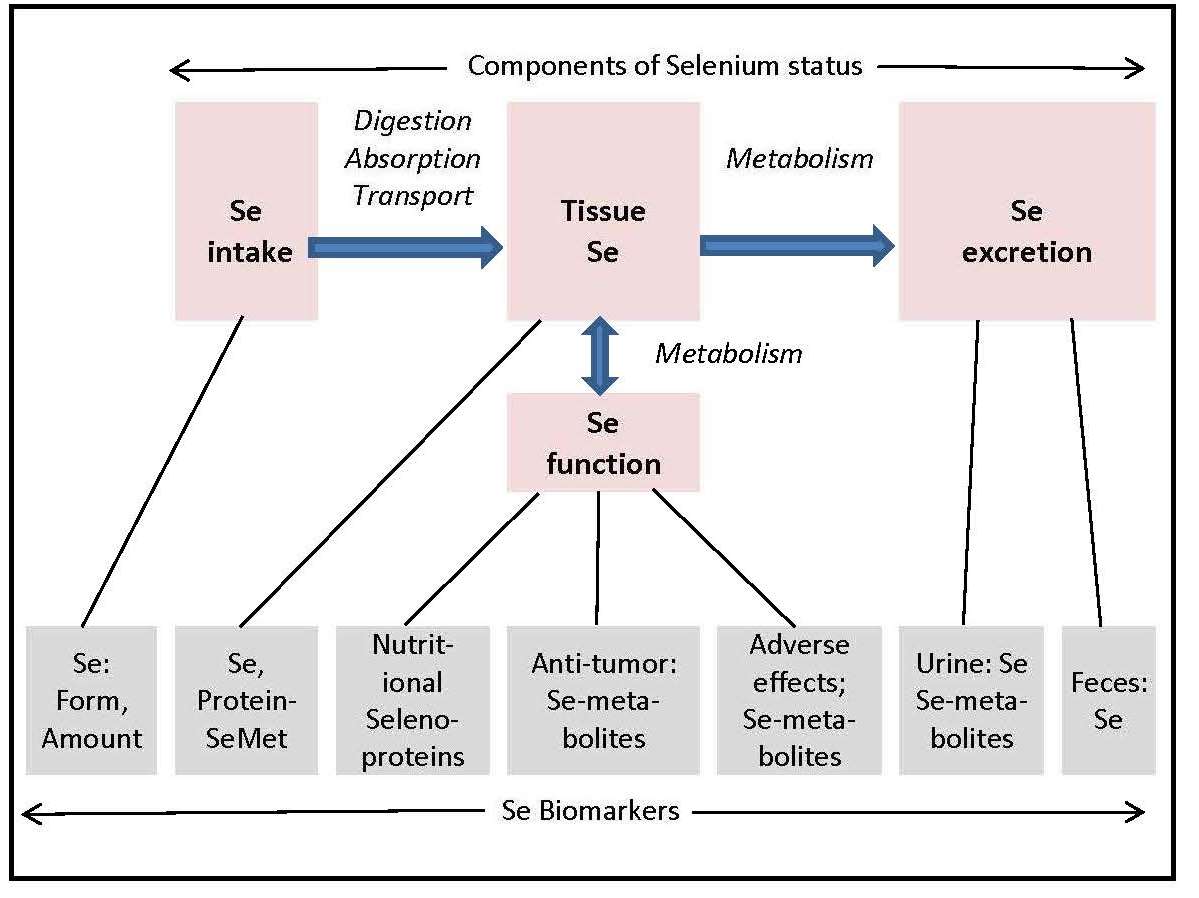
25b.9.1 Biomarkers of Selenium Intake
Se intakes of individuals or populations can be assessed as the sum of the products of the Se contents of particular foods and the amounts of those foods consumed. In practice, this is done using standard food composition tables and food frequency questionnaires, which may not yield accurate estimates of actual Se intake because of the geographic variation in food Se contents not captured in those tables. Therefore, determination of food Se by actual analysis of representative samples is necessary to produce valid Se intake estimates. Speciation of Se has been accomplished only for a few foods, e.g., lentil (Thavarajah et al., 2007). However, such information would not add value in understanding Se status; estimates of total Se intake are sufficient to determine whether individuals and populations meet the recommended Se intakes.Imputing Se intake from measured Se biomarkers is most straightforward in subjects of deficient-to-low Se status whose plasma Se concentrations respond to supplemental Se in proportion to the magnitude of supplementation (Xia et al., 2005). For non-deficient subjects, however, the relationship of Se intake and plasma Se level depends on the form of Se consumed. Inorganic Se typically produces only minimal increases (< 20%) in subjects with plasma Se concentrations greater than about 70ng/mL (Duffield et al., 1999; Broome et al., 2004; Burk et al., 2006), while selenomethionine or selenomethionine-containing foods produce increases in plasma Se over a wide range, including subjects of relatively high Se status (Thomson and Robinson,1986; Duffield et al., 1999; Broome et al., 2004; Xia et al., 2005; Burk et al., 2006; Thavarajah et al., 2007; Ravn-Haren et al., 2008). The former effect reflects the fact that the central organ of Se metabolism, the liver, can convert inorganic Se to forms incorporated only into selenoproteins (Fig. 1), including two in the plasma, the extracellular Glutathione Peroxidase 3 and the Se-transporter Selenoprotein P that show plateaued expression at Se intakes recommended as being nutritionally adequate. The latter, continuing effect is due to the unregulated, non-specific incorporation of selenomethionine into albumin and other proteins over a virtually unlimited range of intakes (Thomson et al., 1982; 1986; Levander et al., 1983; Alfthan et al., 2000; Combs et al., 2012). For Se-nondeficient individuals consuming Se mostly as selenomethionine, Se intake can be predicted from the Se concentration of plasma.
25b.9.2 Biomarkers of Selenium Retention
Most absorbed Se is taken up by liver to re-enter the circulation as a component of Selenoprotein P (Burk and Hill, 2009). A significant amount (15–20%) is released in the urine over several days. Under normal conditions, there appears to be only a small enterohepatic circulation of absorbed Se; therefore, fecal Se is comprised mostly of the unabsorbed portion of ingested Se. In animals fed nutritionally adequate levels of selenite, fecal Se comprises about a fifth of Se excretion (Pedrosa et al., 2012); fecal Se increases at higher Se intakes.Inferring Retention. Retention of Se in the body can be determined by the difference between the amount of Se ingested and the sum of urinary and fecal Se losses. For humans, this requires total collections of urine and stools, ideally over a few days. Alternatively, convenient samples of urine can be used if indexed to creatinine concentration to reduce errors associated with variation in urine output; a non-absorbable dietary marker that can be measured in the stool samples, can be used to calculate the amount of diet corresponding to the fecal sample analyzed for Se.
Assessment of Se retention is useful in livestock nutrition where it can be used as a measure of the bioavailability of feed forms of Se, or as a proxy for the amount of Se in edible tissues (Combs and Combs, 1986) Tissues retain Se largely in protein-bound forms, selenocysteine being specifically incorporated into selenoproteins and selenomethionine being nonspecifically incorporated into all proteins (Fig 1). Accordingly, animals fed dietary sources of selenomethionine will accumulate relatively large amounts of Se in both the specific and non-specific pools; whereas, those fed inorganic Se-compounds, e.g., selenite, will accumulate lesser amounts due to that form only entering the specific (selenocysteine) pool.
Estimating retained Se is useful in human studies as indicators of the degree to which an individual has met his/her Se requirement and may have Se reserves. This can be inferred from analyses of the two specific selenoproteins (Selenoprotein P, Glutathione Peroxidase 3) as well as the non-specific component of plasma Se. Those selenoproteins show maximal expression at plasma Se concentrations of 50–70ng/mL (Clausen and Nielsen, 1988).
Urinary Selenium. Excess absorbed Se can be eliminated in the urine by way of metabolism to methylated products including trimethylselenonium ion ([CH3]3Se+) and a selenosugar 1β-methylseleno-N-acetyl-D-galactosamine. The dominant chemical form of urinary Se varies among species. In rodents, TMSe+ can comprise 90% of urinary Se; in humans, the predominant form is the selenosugar (Ogra et al., 2002; Kobayashi et al., 2002; (Gammelgaard et al., 2003). In both rodents and humans, urinary Se excretion increases with increasing Se intake (Thomson et al., 1982; Combs et al., 2012; Pedrosa et al., 2012). Urinary Se excretion is related to both Se status, the form(s) of Se consumed (Robinson et al., 1997), and the availability of the methyl donor S-adenosylmethionine ( Jackson et al., 2013). Urinary Se excretion is negatively associated with plasma homocysteine concentrations, but positively associated with plasma concentrations of folate and vitamin B12 (Combs et al., 2012). Urinary Se excretion of men and women differ, probably relating to sexually dimorphic selenoprotein biosynthesis as has been described in rodents (Stoedter et al., 2010). In a cohort of healthy, non-deficient Americans, the dose-dependent urinary Se excretion of women was 74% greater than that of men, despite the fact that both showed similar plasma Se responses to comparable intakes of Se (Thomson et al., 1982). This indicates that women do not retain selenomethionine-Se as well as men.
Urinary Se excretion also has a genetic determinant. The increase in urinary Se of non-deficient humans with increasing Se intake was 59% greater for individuals with the GPX1 679 T/T genotype compared to those with the GPX1 679 C/C genotype (Combs et al., 2011); while at baseline, the former individuals had slightly lower plasma Se levels. Because GPX1 accounts for some 60% of tissue Se (Combs et al., 2000), differences in its turnover are likely to affect Se retention and be manifest as differences in urinary Se excretion.
25b.9.3 Biomarkers of Tissue Selenium
Selenium can be retained in many organs. Greatest concentrations are found in the kidney, liver and pancreas, followed by cardiac and skeletal muscle; this pattern is remarkably similar across species, particularly under non-deficient conditions (Combs and Combs, 1986) . Because of its non-specific incorporations into proteins, food sources of selenomethionine support greater tissue Se accumulation than comparable intakes of Se in inorganic forms. For this reason, animal studies using tissue Se accumulation as the measure of bioavailability typically show Se in foods/feedstuffs to be more highly available than selenite or selenate (Combs and Combs, 1986) .Whole Blood. Earlier studies employed whole blood for the assessment of Se status. Those showed good correlations with functional biomarkers in cohorts of relatively low Se status, as well as responsiveness to supplementation with food sources of Se (largely selenomethionine). Blood samples can be dried and later analyzed by X-ray fluorescence analysis (Czuban et al., 2014). Nevertheless, whole blood Se measures can be difficult to interpret in as much as they comprise both cellular and non-cellular constituents both of which have specific and non-specific components.
Plasma/Serum. The most useful tissue for assessing Se status, particularly in humans, is plasma (or serum, which is virtually equivalent with respect to Se-containing components and, therefore, total Se contents). Se is stable in plasma as long as microbial growth is prevented; it can be determined with good sensitivity and precision by automated atomic absorption spectrophotometry reducing interferences by using either graphite-furnace-AAS, or tandem inductively coupled plasma/mass spectrometry (ICP/MS). Plasma Se consists mostly of Se that has been incorporated both specifically as selenocysteine and non-specifically as selenomethionine into various proteins. Selenocysteine occurs in only two plasma selenoproteins, Selenoprotein P and Glutathione Peroxidase 3, which contain 10 and 4 selenocysteine residues, respectively. The synthesis of each, occurring in the liver and kidney, respectively, depends on an ample metabolic supply of selenide for the co-translational biosynthesis of selenocysteine (Carlson et al, 2006).
Plasma also contains a non-specific Se pool comprised of selenomethionine incorporated into proteins in lieu of Met with which it competes for tRNAMet binding. The potential for the unregulated, non-specific incorporation into proteins is a function of their various Met contents. In plasma, the most quantitatively important of these is albumin, which contains 6 Met residues per mole. Assuming that selenomethionine can compete for incorporation at each of those positions, selenomethionine protein would provide a plasma Met space equivalent to nearly 4mM. The non-specific pool can be estimated from the difference between the specific and total Se pools. By this approach, more than half of plasma Se of a non-deficient cohort was present in specific components (Glutathione Peroxidase 3 and Selenoprotein P comprising roughly equal amounts), with almost as much Se present in non-specific components (Combs et al., 2012). Further, the increase in plasma Se produced by selenomethionine-supplementation consisted entirely of expansion of the non-specific component, which reached 73% of plasma Se in subjects consuming some 300µg Se/day. Still, that amount comprised less than 0.05% of the potential selenomethionine space, indicating that the latter is unsaturable under practical conditions.
In contrast to selenocysteine and selenite, which enter the specific selenoprotein pool by a highly regulated process, the incorporation of selenomethionine into the nonspecific Se pool is unregulated, its size reflecting the intake of selenomethionine over a wide range. Accordingly, sources of selenomethionine are also more effective than inorganic Se in increasing tissue Se levels (Thomson et al., 1982; Levander et al., 1983; Thomson et al., 1993; Clausen and Nielsen, 1998; Duffield et al., 1999; Alfthan et al., 2000).
While Se intake is its primary determinant, plasma Se level can be also affected by other factors affecting any of the Se-containing proteins, e.g., gender, age, smoking status (Lloyd et al., 1983), protein malnutrition (Mathias and Jackson, 1982), pregnancy and lactation (Behne and Wolters, 1979; Levander et al., 1987), and inflammation (Maehora et al., 2002; Huang et al., 2012). Plasma Selenoprotein P levels have been found to be lower in obese individuals (BMI >30) (Combs et al., 2012). and in African Americans compared to white Americans (Hargreaves et al., 2014).
The informative value of plasma Se as a biomarker,
therefore, depends on Se status
(Figure 25b.3).
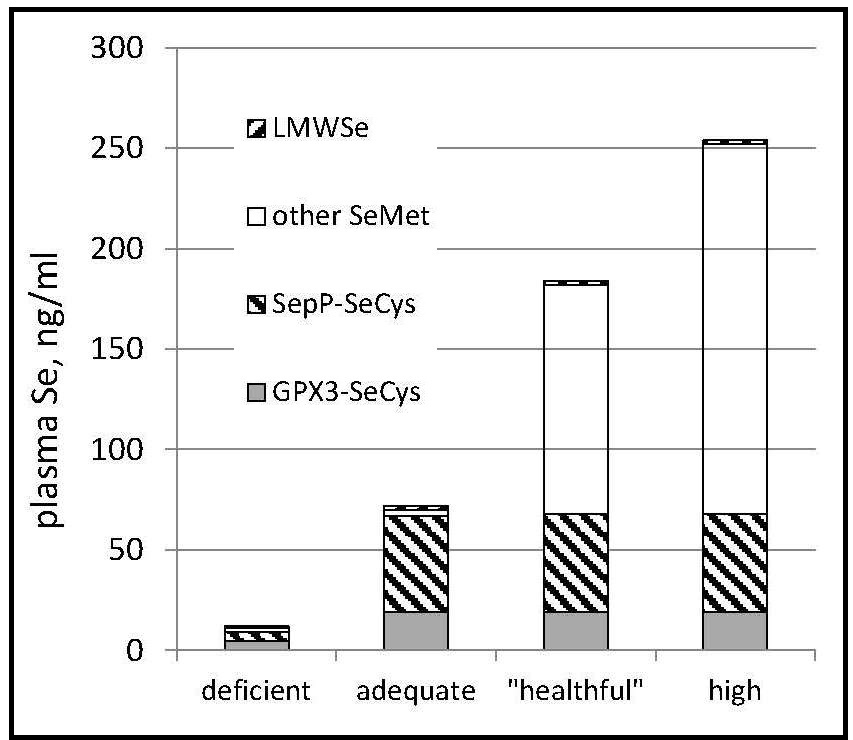
For Se-nondeficient individuals consuming Se mostly as selenomethionine, Se intake can be predicted from the Se concentration of plasma. Such a prediction was made for a cohort of Americans with relatively high baseline plasma Se levels (142ng/mL) (Combs et al., 2012). using the amounts of Se administered as daily supplements of selenomethionine plus Se coming from the subjects' diets as estimated from a self-administered food frequency questionnaire and the USDA National Nutrient Database for Standard Reference, Release 27 (USDA, 2014) Results showed estimated Se intake expressed as µg/kg0.75/d to be significantly correlated with measured Se-plasma, expressed as ng/mL. From that regression it is possible to predict Se intake:
\[\small \mbox{Se intake}_{µg/kg^{0.75}}/d = 0.44 + 0.03 × \mbox{Se plasma}_{ ng/mL} \]
Because virtually all circulating Se is bound to proteins, protein-deficient subjects will have low plasma/serum levels. This has been observed in children with kwashiorkor or marasmus (Mathias and Jackson, 1982), who may also have increased needs for Se and other antioxidant nutrients, due to the pro-oxidative effects of malnutrition and inflammation. Neonates typically have lower blood Se levels than their mothers (Lombeck et al., 1977; McKenzie et al., 1978; van Caillie-Bertrand et al., 1986), and low plasma Se levels have been associated with increased risk of respiratory morbidity among low-birth-weight newborns. Low blood Se levels have been observed in infants with phenylketonuria, but these effects have been due to the use of parenteral feeding solutions that had not been supplemented with Se.
Cells. Three cell types are accessible for use in assessing tissue Se status in humans: erythrocytes, lymphocytes and buccal cells. The Se contents of each respond to selenomethionine supplementation. Erythrocyte Se requires digestion after which it can be determined by GF-AAS. Because erythrocytes are collected with blood, they seldom offer advantages over plasma as a specimen for assessing Se status based on Se content. Buccal cells offer the possibility of a minimally invasive biomarker of somatic cell Se status. These cells can easily be collected in amounts sufficient for analyzing Se and can be acid-solubilized rather than digested prior to GF-AAS analysis. Nevertheless, few groups to have used buccal cells for this purpose (Thomson et al., 1982; O'Callaghan et al., 2008; Combs et al., 2012).. In a non-deficient cohort, buccal Se concentration was positively associated with age and nutritional supplement use, and to respond to selenomethionine supplementation.
Hair and Nail Selenium. Because hair and nails contain sulfur-rich proteins, each can accumulate Se. In addition, hair and nail specimens are stable and can be collected non-invasively, and can be stored at very low cost. For these reasons, these specimens have been used to assess Se status in epidemiological studies. Such studies have shown the amounts of Se in hair to be greater in individuals with high Se intakes (Steven Morris et al., 1983), and increase with Se-supplementation (Hunter et al., 1990). Very high hair and nail Se levels were observed among residents of seleniferous locales (Yang et al., 1983), in cases of Se-poisoning (Lombeck et al., 1987), and in users of Se-containing antidandruff shampoos (Davies, 1982; LeBlanc et al., 1999).
The analysis of Se in hair and nails calls for careful cleaning, with special concern for hair as to whether subjects may have used Se-containing, anti-dandruff shampoos. Selenium can be determined in these matrices by neutron activation analysis, and electrothermal (graphite furnace) atomic absorption spectrophotometry (GF-AAS) after acid-digestion. With standardized procedures, e.g., Bank et al., (1981) for collecting these samples, both hair and nail Se levels correlate well with blood/plasma Se concentration (Yang et al., 1989b, 1989c; Swanson et al., 1990; Longnecker et al., 1996).
It bears pointing out that the use of these specimens to assess Se status relies on the implicit but never validated assumption that their Se contents reflect some metabolically relevant component of body Se. In fact, hair/nail Se is not in dynamic equilibrium with any component of circulating Se; it is actually an excretory form of the element. As such, samples of each contain Se secreted at some time past, presumably reflecting Se status at that time and making them most useful in studies of populations with stable dietary practices. These contributions are very small in comparison to urinary Se output and can be ignored in estimating Se retention.
25b.9.4 Biomarkers of Selenium Function
In principle, measurement of any of the selenoproteins would yield information immediately relevant to the physiological function of Se as an essential nutrient. The most widely used as biomarkers in animal studies are the GPXs. These, the thioredoxin reductasess, and the iodothyronine deiodinasess show maximal expression in most species with dietary Se concentrations of 0.1–0.2mg/kg (Yang et al., 1989; Sunde, 1990; Sunde and Raines, 2011). Only one selenoprotein, SepW, is known not to be maximally expressed under such conditions, but to be upregulated by doses of Se in the anti-tumorigenic range (Hawkes et al., 2009).Selenoenzymes. The list of practical biomarkers of Se function is much shorter, being limited to those occuring in accessible tissues: The extracellular isoform of GPX (Glutathione Peroxidase 3), which comprises 10–25% of plasma Se (lower levels being associated with greater plasma Se concentrations); Selenoprotein P, which comprises 20–70% of plasma Se (lower percentages being associated with greater plasma Se concentrations); and the intracellular isoform (GPX1), which can be assayed in erythrocytes, lymphocytes, buccal cells and tissue biopsy specimens.
Activities of the GPXs can be measured spectrophotometrically using a glutathione reductase-coupled assay (Lawrence and Burk, 1976). Because heme iron can cause interfering glutathione oxidation in that assay, it is necessary to treat erythrocyte samples with Drabkin's reagent when assessing GPX1. The GPXs are homotetramers; each 23kD subunit contains a selenocysteine residue at its active center. Unlike GPX1, Glutathione Peroxidase 3 is a glycoprotein produced mostly by the kidney. Selenoprotein P is present in plasma as multiple variants with an average molecular weight of 60kD (Broderick et al., 1987; Steinbrenner et al., 2007; Méplan et al., 2009; Chittum et al., 1996). Although its genetic coding would suggest as many as 10 selenocysteine residues per mole (Hill et al., 1993), studies in the rat have shown only 7–8 residues per mole (Saito et a, 2014). Selenoprotein P can be measured by immunoassay (Hollenbach et al., 2008; Tanaka et al., 2016).
The dependency of the expression of these selenoproteins on Se intake has been demonstrated in humans for Glutathione Peroxidase 3 (Yang et al., 1987; Xia, et al., 1989; Xia et al., 2005) and Selenoprotein P (Hill et al., 1996; Xia et al., 2005; Xia et al., 2010) in studies conducted in parts of China with endemic Se deficiency. In both cases, pooled analyses of subjects from different communities with differing plasma Se concentrations showed Glutathione Peroxidase 3 activity and plasma Selenoprotein P1 concentration each to be directly related to plasma Se concentration over ranges of about 8–80ng Se/mL. This work has provided the basis for setting dietary Se requirements, which have been based on either two-thirds or maximal Glutathione Peroxidase 3 expression, yielding dietary recommendations for adults from 26–70µg Se/d (Hurst et al., 2013).
Maximal Glutathione Peroxidase 3 expression may occur at a lower level of Se status than maximal Selenoprotein P expression. Xia et al (2020) found that Se-deficient subjects supplemented with selenomethionine for 20wks reached maximal Glutathione Peroxidase 3 activities with plasma Se levels about 66ng/mL, but that their plasma Selenoprotein P concentrations were not maximized until their plasma Se levels were at least a third higher. However, Selenoprotein P may have taken longer to reach new steady-state levels, as after 40wks of intervention the threshold of maximal expression of Selenoprotein P approached that of Glutathione Peroxidase 3 both being in the range of 35–45µg Se/d corresponding to plasma Se concentrations of 50–70ng/mL (Nève, 1995). These thresholds are typically exceeded in western populations; Nève (1995). noted that subjects with plasma Se concentations > 70ng/mL do not show Glutathione Peroxidase 3 responses to Se-supplementation. Accordingly, negative Glutathione Peroxidase 3 and Selenoprotein P responses to Se supplementation are typical in trials conducted in cohorts with greater Se intakes such as in the US (Burk et al., 2006; Combs et al., 2012) and UK (Hurst, et al., 2010).
Obesity can affect Selenoprotein P expression. In a cohort of non-deficient subjects, plasma Selenoprotein P levels were slightly depressed among subjects with body mass index (BMI) greater than 30. Méplan et al (2007) also found relatively low-Se (mean plasma Se 90ng/mL) subjects with BMI> 30 to have lower baseline plasma Se concentrations than non-obese subjects; obese females also showed lower Glutathione Peroxidase 3 activities. These findings may reflect influences of pro-inflammatory cytokines, which have been found to inhibit Selenoprotein P1 expression (Dreher et al., 1997), or dysregulation of gluconeogenesis, as Selenoprotein P appears to be regulated as a gluconeogenic enzyme (Speckmann et al., 2008; 2009).
Genetic Variability and gender contribute to variance in biomarkers of Se function. Individuals with GPX1 679T/T genotype (which has been associated with increased cancer risks) (Ratnasinghe et al., 2000; Hu and Diamond, 2003) had lower plasma Se levels than those with GPX1 679C/C alleles; those with the Selenoprotein P1 24731 A/A genotype had 27% greater plasma Selenoprotein P levels than those with the Selenoprotein P1 24731 G/A or G/G genotypes; and those with the SEP15 811 T/C genotype had greater buccal cell Se levels than those with the SEP15 811 C/C genotype (Combs et al., 2011). Hurst et al (2010). found two variants of Selenoprotein P to affect circulating concentrations of selenoproteins. One variant at position 234 of the protein may affect Selenoprotein P turnover; the other variant at r25191 in the 3'-untranslated region may affect Se incorporation into Selenoprotein P. They found women with the Selenoprotein P1 234GA genotype showed lower Selenoprotein P levels than men of the same genotype; while women with the Selenoprotein P1 234GG genotype showed lower Selenoprotein; P levels than men of that genotype. Subjects with the Selenoprotein P1 234AA genotype showed lower plasma TR1 concentrations compared to those of the other genotypes. Variants in r25191 did not affect Selenoprotein P1 levels; however, individuals with the r25191GG genotype showed greater plasma TR1 concentrations than women of that genotype, while males of the r25191GA genotype were the only subjects to show TR1 responses to Se supplementation.
Non-specific parameters. Several non-specific parameters have been used to assess metabolic impacts of Se deficiency. The plasma triiodothyronine / thyroxine (T3:T4) ratio ratio, normally about 20:1, is elevated by Se-deficiency (Vanderpas et al., 1990; 1993) reflecting limited expression of the iodothyronine deiodinasess. While useful as an indicator of thyroid hormone status, the T3:T4 ratio lacks specificity for Se status, as not only can the conversion of thyroxine to triiodothyronine be impaired by Se deprivation, but also the synthesis of thyroxine can be impaired by deprivation of Se and/or iodine. That the pattern of low molecular weight Se-metabolites in the hindgut lumen corresponds with that of feces, would appear to suggest that a fecal sample may ve useful as an indicator of the Se in the colon.
25b.9.5 Biomarkers Relevant to Anti-tumorigenesis.
Studies with animal models have demonstrated anti-tumorigenic effects of Se involving several aspects of cell proliferation, migration and apoptosis (Combs and Yan, 2016). These effects are manifest with dietary Se levels of at least 1.5mg/kg, while most selenoproteins are maximally expressed at far lower dietary levels (0.1–0.2mg/kg). For that reason, the anti-tumorigenic effects of supranutritional doses of Se would appear to involve functions of Se-metabolites and not of selenoproteins (Combs and Gray, 1998). Still, that certain selenoproteins may play roles in Se-antitumorigenesis is suggested by the finding of Hawkes et al. (2009) that the mRNA for SEPW1 is up-regulated by supranutritional Se treatment, and that silencing SEPW1 is associated with reduced stability of the tumor suppressor protein p53, suggesting that SEPW1 may serve in its stabilization (Hawkes et al., 2012).Evidence from human trials is consistent with the view of anti-tumorigenic Se-metabolites, such as methylselenol (CH3SeH), showing reduction in cancer risk among subjects of nutritionally adequate (i.e., maximal Glutathione Peroxidase 3 expression), but not high Se status. For example, the Nutritional Prevention of Cancer Trial (Combs et al., 2001; Duffield-Lillico et al., 2003) found supplemental Se to reduce cancer risk in non-deficient Americans only if their baseline plasma Se levels were less than about 120ng/mL. This is consistent with the results of the larger Selenium and Vitamin E Cancer Prevention Trial (SELECT) (Lippman et al., 2009), which found no risk reduction in a cohort with baseline plasma Se concentrations exceeding that level. Although CH3SeH and, perhaps, other methylated Se-metabolites would be candidate biomarkers relevant to Se-antitumorigenesis, none have been reported in biological specimens. At the moment, therefore, the most useful biomarker relevant to Se-antitumorigenesis is plasma Se, the target level being about 120ng/mL above which current evidence indicates no further risk reduction.
25b.9.6 Biomarkers Relevant to Adverse Effects.
Biomarkers Relevant to Adverse Effects. The potential for very high Se status to produce adverse physiological effects has been established from animal studies and accidental exposures of humans. These reports have produced an array of clinical indicators but few biomarkers with predictive value. For this reason, the default choice has been to use as risk indicators the highest Se tissue levels observed with no adverse effects. Most studies show no adverse effects in human subjects with plasma Se levels < 1000ng/mL.25b.10 Questions Remain
Understanding of Se, the most recently recognized essential nutrient, continues to grow. It has become clear that consequences of Se deprivation are typically sub-clinical in nature, requiring other precipitating factors (deficiencies of vitamin E, iodine and/or protein; exposure to viruses, or carcinogens) to reveal physiological effects of sub-optimal expression of selenoenzymes. It is also apparent that supranutritional intakes of Se, at which selenoenzymes are fully expressed, can be beneficial. These facts raise three pressing questions:- Can Se prevent cancer in humans? The clinical significance of Se in cancer prevention remains a subject of debate. The nine randomized clinical trials conducted to date have yielded inconsistent results. Systematic reviews have found that Se may be effective in preventing cancer in individuals of low to adequate, but not high, Se status; and a U-shaped dose-response relationship has been proposed (Chiang et al., 2009). These conclusions are weakened by the fact that several trials have not followed robust protocols, and none has been conducted in recent years or in cohorts with individuals of both marginal and adequate Se status.
- What is the window of safety for Se? While it is clear that very high levels of exposure are required to produce selenosis, resolving the question of whether supranutritional intakes of Se can increase T2D risk remains unclear. Clarifying that will call for well controlled trials with subjects randomized by T2D risk factors (high BMI, elevated fasting glucose) and followed with unequivocal diagnostic indicators (fasting glucose, HbA1c, oral glucose tolerance). Until then, there would appear to be no justification for any healthy adult, regardless of his/her baseline Se status, to consume more than 100µg Se/day.
- Who Can Benefit from Se? This is the ultimate question. It is clear that supplementation of adults with basal Se intakes < 50µg/d will increase selenoenzyme expression, and that the magnitude of those increases will depend on the extent to which baseline plasma Se levels were below about 90ng/mL. That individuals with plasma Se levels less than about 120ng/mL may also benefit from increased Se intakes is suggested from results of the NPC Trial in which supplemental Se reduced cancer risk among adults with plasma Se levels in the range of 80–120ng/mL. This suggests that individuals with plasma Se levels in that range may benefit from cancer protection unrelated to selenoenzyme expression. If so, many adults may benefit from increased Se intakes: some to maximize selenoprotein expression, others to reduce cancer risks.