
Pentieva K, Principles
of Nutritional Assessment:
Riboflavin
3rd Edition, August 2024
Abstract
Riboflavin is a component of flavin mononucleotide (FMN) and flavin adenine dinucleotide (FAD) which act as coenzymes of different flavoproteins involved in oxidation-reduction reactions that are central to energy production, intermediary metabolism, drug metabolism and the maintenance of antioxidant status. Riboflavin coenzymes are also required for the metabolism of folate, vitamin B12, vitamin B6, and niacin as well as for mobilization of iron from intracellular stores. Classical signs of riboflavin deficiency (ariboflavinosis) generally occur in association with other nutrient deficiencies, notably vitamin B6. Riboflavin deficiency has been described predominantly in undernourished populations in low income countries, but accumulating evidence has shown that a suboptimal riboflavin status is more common than previously recognized among populations in developed countries. Measurement of the activity of glutathione reductase, with and without the prosthetic group FAD, is the best method for assessing tissue riboflavin status, particularly in cases of impaired riboflavin status. The test measures tissue saturation and long-term riboflavin status, although some confounding factors may influence its performance. Urinary riboflavin excretion levels in casual or 24h urine specimens reflect dietary intake but vary widely because concentrations are affected by many non-nutritional factors. Concentrations of riboflavin, FMN and FAD in plasma or erythrocytesG as well as measurement of the activity of pyridoxamine phosphate oxidase and its activity coefficient appear promising options for assessment of riboflavin status and warrant further exploration. CITE AS: Pentieva K, Principles of Nutritional Assessment: Riboflavin https://nutritionalassessment.org/ riboflavin/Email: k.pentieva@ulster.ac.uk
Licensed under CC-BY-4.0
( PDF )
20b.1 Riboflavin
Riboflavin (7,8-dimethyl-10-ribityl-isoalloxazine) was first synthesized in 1935. Its structure consists of an isoalloxazine ring attached to a ribityl side chain Figure 20b.1. A detailed review of riboflavin and health is provided elsewhere (Powers, 2003; Thakur et al., 2017; Suwannasom et al., 2020).20b.1.1 Functions of riboflavin
Riboflavin is a component of flavin mononucleotide (FMN) and flavin adenine dinucleotide (FAD) which act as coenzymes of different flavoproteins involved in oxidation-reduction reactions that are central to energy production, intermediary metabolism, drug metabolism as well as the maintenance of antioxidant status (Figure 20b.1).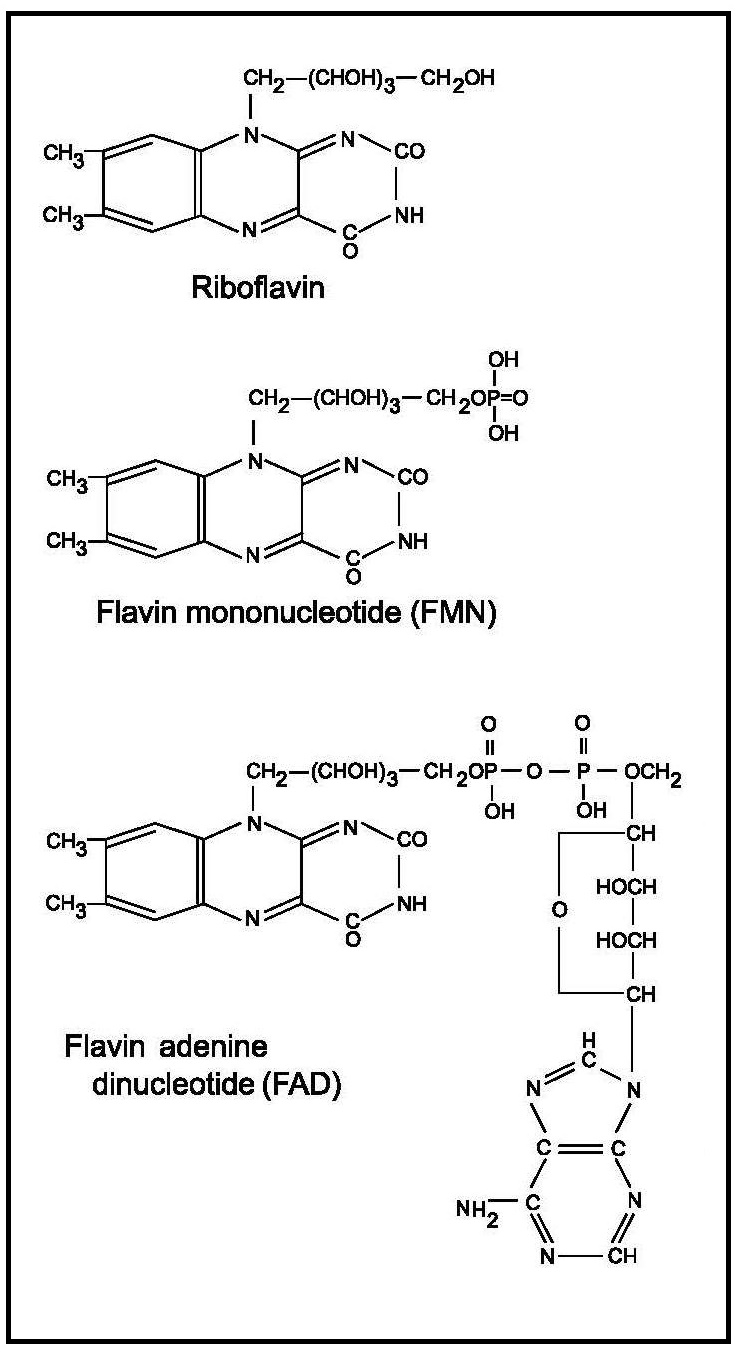
Both FMN and FAD are also cofactors for several enzymes, including glutathione reductase, xanthine oxidase, L‑amino oxidase, and nicotinamide adenine dinucleotide (NAD) dehydrogenase. Results from animal studies also suggest that flavins are cofactors in the cyclical β‑oxidation of fatty acids (Olpin and Bates, 1982a; Olpin and Bates, 1982b). Around 84% of human flavoproteins are FAD‑dependent and only 16% use FMN as a cofactor (Leinhart et al., 2013).
Riboflavin coenzymes are also involved in the metabolism of four other vitamins — folate, vitamin B12, vitamin B6, and niacin. Flavin adenine dinucleotide is a cofactor for 5,10‑methylenetetrahydrofolate reductase (MTHFR; EC 1.7.99.5), a key enzyme in folate metabolism involved in the conversion of 5,10‑methylenetetrahydrofolate to 5-methyltetrahydrofolate, which is required for the remethylation of homocysteine to methionine. Both FMN and FAD act as cofactors for the enzyme methionine synthase reductase (EC 1.16.1.8) which is responsible for the regeneration of methylcobalamin, the biologically active form of vitamin B12 that is also involved in the remethylation of homocysteine to methionine. In addition, FMN acts as a cofactor for pyridoxine (pyridoxamine) phosphate oxidase (PPO; EC 1.4.3.5), an important enzyme in vitamin B6 metabolism that converts the 5‑phosphates of both pyridoxine and pyridoxamine to the coenzyme pyridoxal‑5´‑phosphate. Finally, the FAD‑dependent kynurenine hydroxylase is involved in the conversion of tryptophan to niacin. As a result, severe riboflavin deficiency can cause functional deficiency with disturbances in the metabolic pathways of these vitamins.
Absorption of riboflavin occurs mainly in the proximal small intestine by a saturable carrier-mediated mechanism; the maximal amount of riboflavin that can be absorbed from a single dose is about 27mg (Zempleni et al., 1996). Intestinal microflora is able to synthesize riboflavin, some of which is absorbed in the colon by a carrier-mediated process (Said et al., 2000; Said, 2013 ). The vitamin is transported in plasma as free riboflavin complexed with albumin and other proteins, mainly immunoglobulins, which also bind flavin coenzymes (Innis et al., 1985).
20b.1.2 Deficiency of riboflavin in humans
The classical signs of riboflavin deficiency, termed ariboflavinosis, are angular stomatitis, cheilosis, glossitis and anemia. Corneal vascularization, dermatological changes, and neurological alterations may also occur but are not specific for ariboflavinosis (Northrop-Clewes and Thurnham, 2012). Some environmental factors may also influence the clinical signs and symptoms of riboflavin deficiency.Ariboflavinosis is rarely encountered in isolation, usually occurring in association with other vitamin deficiency states. In a study of Irish elderly, 49% had suboptimal riboflavin status, 39% had suboptimal vitamin B6 status, and 21% had concurrent riboflavin and vitamin B6 deficiencies. After supplementation with riboflavin alone, both the riboflavin deficiency and the low plasma pyridoxal‑5´‑phosphate levels were corrected (Madigan et al., 1998).
Some evidence suggests that riboflavin deficiency is linked with impaired mobilization of iron from intracellular stores (i.e. hepatic ferritin), increased rate of iron loss from the gastrointestinal tract, as well as decreased absorption of iron (Powers, 2003). This could explain the low hemoglobin concentrations and hypochromic anemia which often are observed in riboflavin deficiency (Aljaadi et al., 2019). Studies conducted in population groups with a compromised riboflavin status such as school children (Buzina et al., 1979; Charoenlarp et al., 1980), men (Fairweather-Tait et al., 1992), pregnant (Decker et al., 1977; Suprapto et al., 2002; Ma et al., 2008), lactating (Powers et al., 1985) and women of reproductive age (Powers et al., 2011), have shown that riboflavin supplementation leads to improvement of the hematological status.
Riboflavin deficiency has been described in undernourished populations in several low income countries, notably among women and children in The Gambia (Bates et al., 1981, 1994) , some elderly persons in Guatemala (Boisvert et al., 1993a), children in Côte d'Ivoire (Rohner et al., 2007), and in some adolescent refugees from Bhutan living in southeastern Nepal (Blanck et al., 2002). Infants of mothers with a low riboflavin status during gestation are also likely to be born riboflavin-deficient (Bates et al., 1982). An accumulating body of evidence based on small as well as population-based surveys from developed countries has shown that a suboptimal riboflavin status is more common than previously recognized and those predominantly affected are adolescents and young women (Bates et al., 2016; Ward et al., 2020; Aljaadi et al., 2019; Jungert et al., 2020).
Several conditions, including alcoholism, diabetes mellitus, liver disease, thyroid and adrenal insufficiency, and gastrointestinal and biliary obstruction, may precipitate or exacerbate riboflavin deficiency (Rivlin, 2007). Alcohol causes deficiency by interfering with both the digestion and the intestinal absorption of riboflavin S (Pinto et al., 1987; Subramanian et al., 2013 ). Antiepileptic and psychotropic drugs such as chlorpromazine, imipramine, and amitriptyline (Apeland et al., 2003; Pinto et al., 1982), as well as some antimalarial drugs such as quinacrine (Dutta et al., 1985) all inhibit the conversion of riboflavin to its active coenzyme derivatives. Drugs, such as tetracycline, theophylline, and caffeine, as well as metals, such as zinc, copper, and iron, may chelate or form complexes with riboflavin and, hence, affect its bioavailability (Sauberlich, 1985).
More vulnerable to riboflavin deficiency are individuals with 677C→T polymorphism in the gene encoding MTHFR enzyme because the variant enzyme has an impaired activity as a result of reduced affinity to the cofactor FAD (Yamada et al., 2001); this typically leads to elevated homocysteine concentrations (Frosst et al., 1995). Marked lowering of homocysteine has been achieved in people with the impaired variant (TT genotype) with a low dose of riboflavin (McNulty et al., 2006). Moreover, genome-wide association studies (Ehret et al., 2011) and clinical studies (Qian et al., 2007; Yang et al., 2014) provide evidence linking the MTHFR 677C→T polymorphism with blood pressure and increased risk of hypertension and hypertension in pregnancy by up to 87%. Importantly, emerging evidence from randomized trials highlights that riboflavin supplementation can lower blood pressure specifically in adults with TT genotype (Horigan et al., 2010; Wilson et al., 2013). This novel role of riboflavin could have important public health implications, considering that the frequency of the variant TT genotype is 10–12% worldwide but it could reach up to 32% in some countries (e.g., Mexico; Wilcken et al., 2003).
Riboflavin deficiency has been implicated as a risk factor for cancer in animal studies (Powers, 2003), but the epidemiological evidence based on several meta-analyses is less consistent (Yoon et al., 2016; Yu et al., 2017; Ben et al., 2019; Zeng et al., 2020).
Studies have shown that in malaria endemic regions, individuals with riboflavin deficiency are relatively resistant to this infection and have a lower level of parasitemia, but the course of the disease may be more severe than in people with adequate riboflavin status (Das et al., 1988).
20b.1.3 Food sources and dietary intakes
Riboflavin in foods is present predominantly in the form of FAD and only small quantities are available as FMN. Some flavins bound covalently to protein are also found in certain foods but are largely unavailable as nutritional sources of riboflavin; only limited amounts apparently undergo digestion and absorption (Chia et al., 1978).The major food sources of riboflavin are dairy products, especially milk, and meat and fish; most plants contain only small amounts of riboflavin. As a result, individuals consuming mainly plant-based diets may be at risk for riboflavin deficiency. Riboflavin enrichment of flour is mandated in the US and some other countries with the aim of restoring the losses of the vitamin during milling and refining processes. Most of the ready-to-eat breakfast cereals are fortified with riboflavin in developed countries. Although it is heat-stable, losses of riboflavin do occur if it is exposed to the light and, as it is water soluble, by leaching into the cooking water (Powers, 2003). Bioavailability of riboflavin from food is reported to be around 95% (IOM, 2000). There are limited data on the relative bioavailability of riboflavin from different food sources but a study using stable isotopes and kinetic modeling did not find a significant difference in riboflavin absorption from milk and spinach (Dainty et al., 2007).
Nationally representative surveys from the US, Australia, Ireland, and the UK showed that milk and dairy products, meat and ready-to-eat breakfast cereals are the main dietary contributors to riboflavin intake (IOM, 2000; Australian Bureau of Statistics, 2014; National Adult Nutrition Survey, 2011; Bates et al., 2016).
20b.1.4 Effects of high intakes of riboflavin
In humans, there is no evidence for riboflavin toxicity as a result of excessive intakes (EFSA, 2017). The absorption of orally administered riboflavin from both vitamin supplements and from natural foodstuffs is limited, and high intakes are rapidly excreted in the urine. Even when 400mg/d of riboflavin was given orally with meals for at least 3 months, no short-term side effects were reported (Schoenen et al., 1994). In view of the limited data on adverse effects from high intakes of riboflavin, no Tolerable Upper Intake Level for riboflavin was set by the U.S. Food and Nutrition Board (IOM, 2000).20b.2 Biomarkers of riboflavin status
As the signs and symptoms of riboflavin deficiency are not very specific, diagnosis of a deficiency state is difficult when based exclusively on clinical assessment. Consequently, biochemical tests are essential for confirming clinical cases of riboflavin deficiency and for establishing subclinical deficiencies. Several tests are available, and these are discussed in the following sections. A combination of biomarkers is generally preferred: erythrocyte glutathione reductase activity and urinary riboflavin excretion are the most used.20b.2.1 Erythrocyte glutathione reductase activity
The measurement of the activity coefficient of erythrocyte glutathione reductase (EGR) (EC 1.6.4.1), an erythrocyte enzyme that depends on a cofactor derived from riboflavin, is the preferred method for assessing riboflavin status. It provides a measure of tissue saturation and long-term riboflavin status.Glutathione reductase is a nicotinamide adenine dinucleotide phosphate (NADPH), a FAD-dependent enzyme, and the major flavoprotein in erythrocytes. It catalyzes the oxidative cleavage of the disulfide bond of oxidized glutathione (GSSG) to form reduced glutathione (GSH):
\[\small\mbox{GSSG + NADPH + H}^{+}\mbox{→ 2GSH + NADP}^{+}\] The activity of EGR is measured spectrophotometrically by monitoring the oxidation of NADPH to NADP+ at 340nm, with and without the presence of added FAD coenzyme. As an alternative, the production of GSH can be monitored colorimetrically. The test involves the following steps:
- The basal activity of EGR is measured. This represents the endogenous enzyme activity and depends on the amount of FAD coenzyme in erythrocytes.
- The activity of EGR with excess FAD coenzyme added in vitro is then determined. This represents the maximum potential EGR activity and is referred to as “stimulated” activity.
-
The activity coefficient (EGR AC) is then
derived by the ratio of the “stimulated” over
the basal EGR activity which indicates the
degree of unsaturation of the enzyme with the
coenzyme:
\[\small\mbox{EGR AC =}\frac{\mbox{activity (with added FAD)}}{\mbox{ basal activity (without added FAD)}}\]
The degree of in vitro stimulation of EGR activity depends on the FAD saturation of the apoenzyme, which, in turn, depends on the availability of riboflavin. If the vitamin status is normal, then the values of the basal and stimulated activity are similar, and the EGR activity coefficient is very close to 1.0. In persons with riboflavin deficiency, the basal EGR activity falls and the in vitro stimulation by FAD rises; thus, higher values of EGR activity coefficient are indicative of a lower riboflavin status. The result also can be presented as “percentage of stimulation” (PS) which is calculated from the EGR AC as follows: \[\small\mbox{PS = (EGR AC × 100) − 100}\]
Meta-analysis of human supplementation trials confirmed that the EGR AC is a useful, stable, and sensitive measure of riboflavin status, reflecting the degree of tissue saturation ranging from severe deficiency to normal status (Hoey et al., 2009). It is not very sensitive, however, for detecting changes of riboflavin status in replete individuals (Powers, 1999). In experimentally controlled human studies, concomitant increases in EGR AC in response to decreases in intakes of riboflavin have been reported (Figure 20b.2).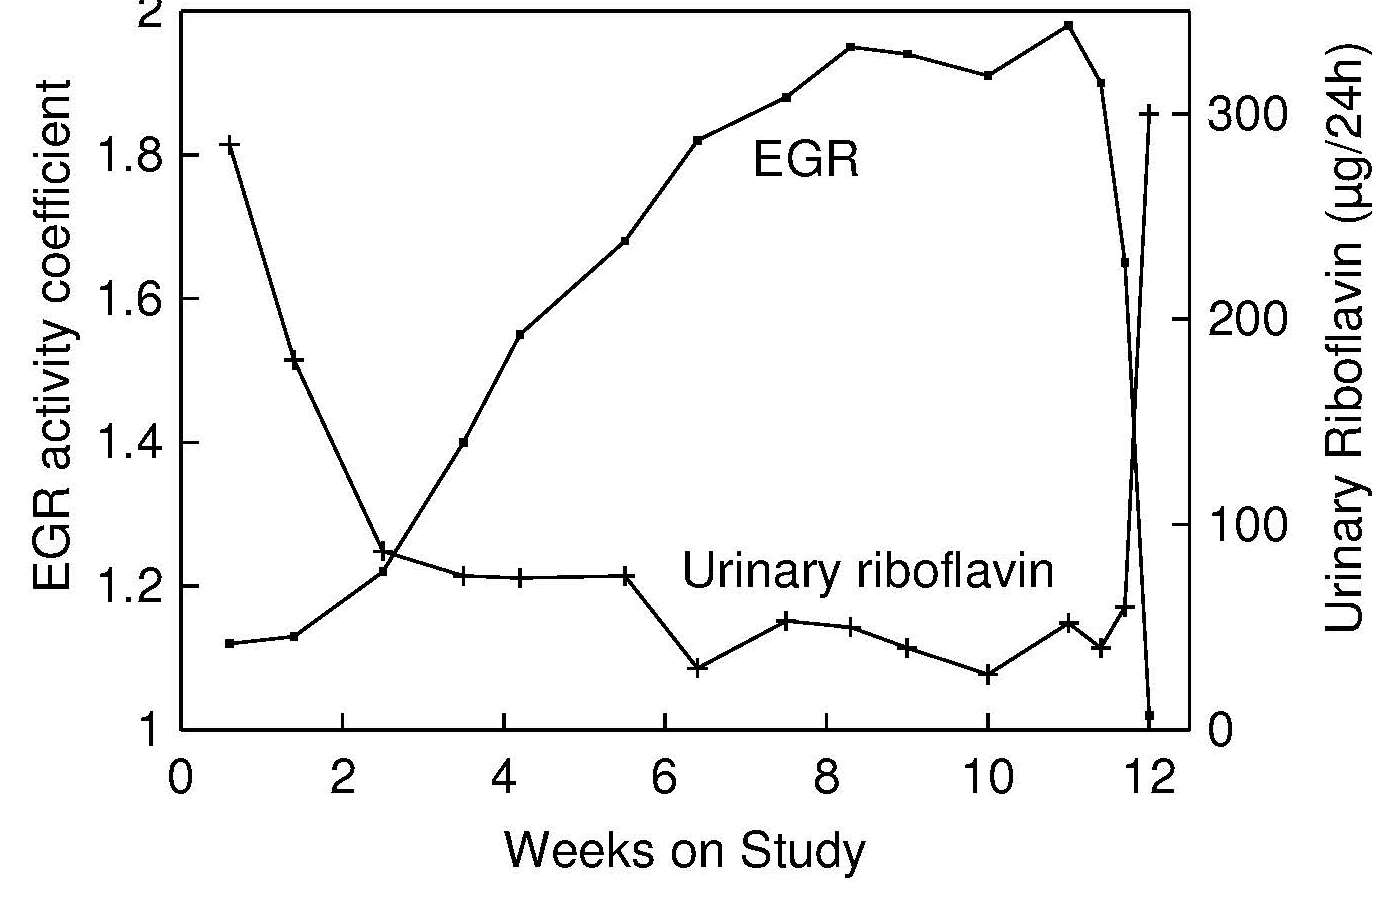
Measurement of EGR AC has been used to monitor riboflavin status only in a few population-based studies such as the UK National Dietary and Nutrition Surveys Rolling Programme which includes all age and sex population groups (Bates et al., 2016), Irish National Adult Nutrition Survey (Kehoe et al., 2018) and the older national surveys from Germany (Heseker et al., 1992) and the Netherlands (Löwik et al., 1994). However, the assay has been used more frequently in cohort studies of UK older adults (Bailey et al., 1997), Irish adults (Jungert et al., 2020) and older people (Madigan et al., 1998; Moore et al., 2019), Canadian women of reproductive age (Aljaadi et al., 2019) and older adults (Whitfield et al., 2019), Spanish adults (Mataix et al., 2003; García-Minguillán et al., 2014) as well as French adults (Hercberg et al., 1994). Riboflavin status of different population groups assessed by EGR AC has been reported in studies conducted in developing countries including some in Africa (Bates et al., 1981; 1994; Ajayi, 1984; 1985; Ajayi and James, 1984), Central America (Boisvert et al., 1993a), and Asia (Thurnham et al., 1982; Blanck et al., 2002; Whitfield et al., 2015; Aljaadi et al., 2019).
Comparison of the prevalence of deficient riboflavin status among these studies is often difficult because the method of EGR AC assessment has not been standardized and as shown in a systematic evaluation of the existing methods, variations in the laboratory protocols applied in various studies could produce significantly different results (Hill et al., 2009). Moreover, the cutoff values used to denote suboptimal status and deficiency vary considerably from one study to another. However, EGR AC results from different populations generated by an identical protocol in one laboratory and by using the same cutoff showed very comparable data for the prevalence of riboflavin deficiency in Canadian and Irish older adults (26% vs 25.5%; Whitfield et al., 2019; Jungert et al., 2020) and in Canadian women of reproductive age and younger Irish adults (40% vs 52%; Aljaadi et al., 2019; Jungert et al., 2020) whereas 80% and 71% of the investigated Malaysian and Cambodian women of reproductive age, respectively were reported to be riboflavin deficient (Aljaadi et al., 2019; Whitfield et al., 2015).
In some of these surveys, significant inverse relationships between the EGR AC and riboflavin intakes have been observed (Gregory et al., 1990; Hercberg et al., 1994; Bailey et al., 1997; Bates et al., 1999; Hoey et al., 2007); results from the UK survey of British adults are given in Table 20b.1.| Erythrocyte glutathione reductase activity coefficient |
||
|---|---|---|
| Dietary intake | Men | Women |
| Total riboflavin (incl. supplements) | −0.13 ( p < 0.01) | −0.24 ( p < 0.01) |
| Riboflavin from food sources | −0.23 ( p < 0.01) | −0.31 ( p < 0.01) |
There have been several attempts to establish a relationship in humans between a specific physiological function and EGR AC values, but the results have been inconclusive. Some reports of effects on work performance, neurovascular coordination, and iron handling with EGR AC values ≥ 1.7 have been reported (Prasad et al., 1990; Fairweather-Tait et al., 1992; Bates et al., 1994).
| Elderly subjects | n | r | Significance |
|---|---|---|---|
| Males | 37 | 0.411 | < 0.02 |
| Females | 62 | 0.359 | < 0.01 |
Some epidemiological studies also have linked EGR AC values with various health effects. In a study of adolescent Bhutanese refugees living in Nepal, for example, in whom the prevalence of angular stomatitis was 27%, those with angular stomatitis had significantly higher EGR AC values than those without (i.e., 2.2 ± 0.4 vs. 2.0 ± 0.3; p = 0.02). The adjusted odds ratio for angular stomatitis and low riboflavin status was 5.1 (95% CI: 1.55, 16.5) (Blanck et al., 2002).
In addition, a large cross-sectional study of Irish older adults showed that riboflavin deficiency (EGR AC > 1.46) was independently associated with an increased risk of depression after adjustment for covariates (OR 1.56, 95% CI: 1.10, 2.00, p=0.012) (Moore et al., 2019).
Factors affecting EGR AC values
FAD concentrations used in the assay to stimulate EGR can affect the EGR AC values obtained. Concentrations of FAD > 5µmol result in lower normal ranges of EGR ACs, in comparison with FAD concentrations ranging from 1–3µmol (Garry and Owen, 1976; Rutishauser et al., 1979; Hill et al., 2009).The length of the pre-incubation of reagents with EGR enzyme appears also to be critical. A short pre-incubation period could underestimate EGR AC values because less time is available for FAD to bind to the enzyme in the hemolysate (Thurnham and Rathakette, 1982). Hill et al. (2009) found that 30min would be the optimal length of the pre-incubation.
Age of erythrocytes may also influence the EGR activity (Powers and Thurnham, 1981) as concentrations are declining with the aging of the cells.
Age of the subjects may affect the EGR activity. In some early studies a trend toward higher EGR ACs with increasing age, irrespective of sex, has been observed (Garry et al., 1982; Wright et al., 1995). However, more recent investigations including the UK population-based survey, have reported consistently higher EGR AC values in younger compared with older adults (Bates et al., 2016; García-Minguillán et al., 2014; Jungert et al., 2020). It is unknown whether this difference in riboflavin status with age can be explained only by variations in dietary riboflavin intake.
Genetic disturbances, including glucose‑6-phosphate dehydrogenase deficiency and heterozygous β‑thalassemia, are associated with disorders in erythrocyte flavin metabolism (Prentice et al., 1981; Anderson et al., 1987; 1993), which can result in misleading EGR AC test results. For example, in cases of glucose‑6-phosphate dehydrogenase deficiency, there is increased avidity of the EGR for FAD, resulting in EGR AC values within the normal range, even in the presence of clinical signs of riboflavin deficiency (Thurnham, 1972). Glucose‑6-phosphate dehydrogenase deficiency is one of the most common enzyme defects in humans and it is highly prevalent among populations in malaria-endemic areas of sub-Saharan Africa and the Middle East where approximately up to 7.5% of people are affected (Nkhoma et al., 2009). It is estimated that glucose‑6-phosphate dehydrogenase deficiency occurs in around 10% of Americans of African descent (Frischer et al., 1973). In contrast, in heterozygous β‑thalassemia, there is an inherited slow red-cell metabolism of riboflavin to FMN and FAD and a high stimulation of the erythrocyte glutathionine reductase by extraneous FAD (Anderson et al., 1993).
Pyridoxine deficiency also interferes with the EGR AC test, resulting in a decreased erythrocyte glutathione reductase activity but no change in the activity coefficient, probably arising from a decrease in apoenzyme. No comparable effects have been observed for other vitamin deficiencies such as thiamin and vitamin C.
Disease states, including iron-deficiency anemia (Ramachandran and Iyer, 1974), severe uremia, cirrhosis of the liver, and hypothyroidism lead to increased erythrocyte glutathione reductase activity.
Conditions of negative nitrogen balance lead to a fall in EGR AC values. In pregnant women in The Gambia, for example, EGR AC values fell in association with a decline in body weight during the rainy season, despite evidence that malnutrition had actually increased (Bates et al., 1981). Similar findings have been reported in preschool children with upper respiratory tract infections and measles (Bamji et al., 1987).
Interpretive criteria
There is still uncertainty regarding the most appropriate threshold value indicative of normal riboflavin status. An EGR AC value of < 1.3 is generally considered to represent saturation of the tissues with riboflavin. This value was derived from the riboflavin depletion-repletion study in young men (Figure 20b.2) as well as from the supplementation study in elderly people with riboflavin deficiency (Boisvert et al., 1993b) where urinary excretion of riboflavin started to increase sharply (a point reflecting body saturation) at EGR AC below 1.3. A systematic review including 18 supplementation studies concluded that a cut-off of 1.3 should be considered as the “upper limit of a normal range” (Hoey et al., 2009). Sadowski 1992), however, used an upper limit of 1.34 in a study of apparently healthy elderly. This value was based on the mean plus 2 SD of the EGR AC value derived from a large sample of Boston elderly aged ≥ 60y. Cutoff EGR AC values of 1.3–1.4 for suboptimal and > 1.4 for deficiency states are often used (Wilson et al., 2013; Whitfield et al., 2015; Aljaadi et al., 2019; Jungert et al., 2020); these cutoffs appear to be independent of sex. Generally, EGR AC values in the range from 1.5 to 2.5 were found in population groups consuming very low intakes of riboflavin, wih evidence of clinical riboflavin deficiency (Bates et al., 1981; Thurnham et al., 1982; Lo, 1985). In a study of adolescent Bhutanese refugees, Blanck et al. (2002) used an EGR AC cutoff of > 1.7, and based on this value, 86% had low riboflavin status. Considering that various methods for EGR AC assessment generate slightly different results (Hill et al., 2009), it is reasonable to expect that the cutoff value would be dependent on the analytical method used; thus, reference ranges developed in the local laboratories should be considered.| EGR activity coefficient | ||
|---|---|---|
| 19–64y | ≥ 65y | |
| Men Median | 1.31 | 1.26 |
| 97.5th percentile | 1.99 | 1.61 |
| Women Median | 1.33 | 1.28 |
| 97.5th percentile | 1.94 | 1.71 |
Measurement of erythrocyte glutathionine reductase activity
Only small samples of blood are required for the EGR assay, and fasting samples are not necessary (Komindr and Nichoalds, 1980). Either EDTA or heparin can be used as an anticoagulant. Erythrocytes must be washed and lysed, and the assay must be performed immediately after blood samples are drawn because FAD is a labile compound (Shenkin and Roberts, 2016). Alternatively, the hemolyzed samples can be kept frozen for over a year at −70°C without loss of EGR activity.Generally, glutathione reductase activity is measured using an enzyme-coupled kinetic assay, although some colorimetric methods are also available (Sauberlich, 1984). An automated method involving the use of a centrifugal analyzer has been developed (Mak and Swaminathan, 1988; La Rue et al., 1997). An alternative procedure, using well plates and a plate reader, has also been described (Sauberlich, 1999). Very small volumes of whole blood instead of erythrocytes can be used for the measurement of glutathionine reductase activity, but the method, although simpler, is less sensitive. Care must be taken to ensure that the protocols for the assay are carefully specified and followed so that results can be compared among studies. As noted previously, the EGR assay is invalid for persons with glucose‑6- phosphate dehydrogenase deficiency.
20b.2.2 Urinary riboflavin excretion
Flavins are excreted in urine mainly in the form of riboflavin (60–70% of all urinary flavins) or other metabolites, such as 7‑hydroxymethylriboflavin (7‑α-hydroxyriboflavin) and lumiflavin (Chastain and McCormick, 1987). Very little riboflavin can be stored in the body, so urinary excretion reflects dietary intake after tissues become saturated. A strong positive linear correlation of urinary riboflavin with riboflavin intake above 1.4mg/day has been reported (r2 = 0.9667, p < 0.01) (Guo et al., 2016). Urinary riboflavin excretion is considered a biomarker of short-term status. Experimental balance studies indicate that urinary riboflavin excretionary rates increase slowly with increasing intakes until the point of tissue saturation, after which any further increase of riboflavin intake leads to a sharp elevation of the excretion rate, as shown in Figure 20b.3.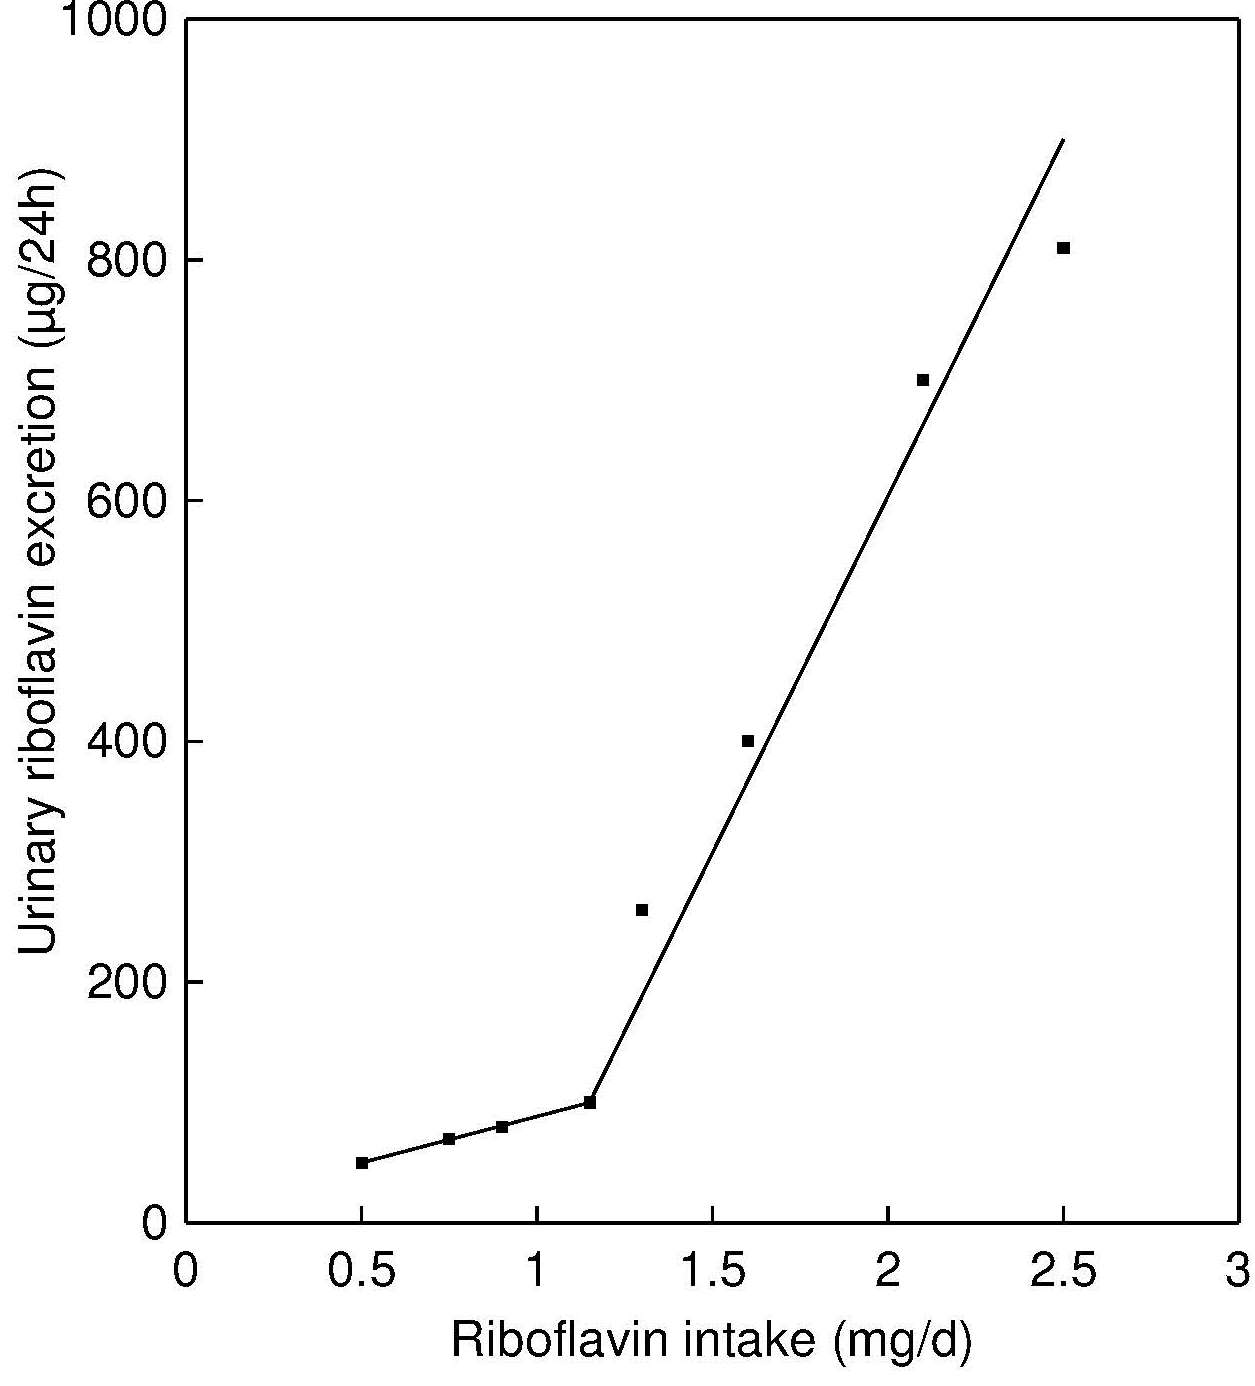
Urinary riboflavin was measured in several early population studies in North America: the Nutrition Canada survey, the US Ten State Nutrition Survey, and in NHANES I. In these surveys, casual urine samples were collected rather than the preferable 24h urine samples. As a result, riboflavin concentrations were expressed per gram of creatinine. For children, the rate of riboflavin excretion, when expressed per gram of creatinine is greater than for adults. The population-based VERA Study, conducted as part of the German National Consumption Study I, assessed urinary riboflavin in 24hour urine samples of 2,006 adults (Heseker et al., 1992)
Occasionally, a riboflavin load test is used to assess the degree to which the body is saturated with riboflavin. An oral dose of 5mg riboflavin is given, and again the timed excretion of riboflavin in the urine is measured, usually over a 4h period (Lossy et al., 1951; ICNND, 1963; Brun et al., 1990); the results should be compared with the level in the urine before the test load.
Factors affecting riboflavin excretion
Physical activity and sleep can decrease riboflavin excretion (Soares et al., 1993).
Negative nitrogen balance and infection induce a breakdown of tissue protein and, hence, increase urinary excretion of riboflavin (Tucker et al., 1960). Consequently, measurement of urinary riboflavin is not very useful in circumstances where intakes of protein are low or where chronic infection is common.
Drugs including some antibiotics and psychotropic drugs such as phenothiazines can increase the excretion of riboflavin (Goldsmith, 1975).
Oral contraceptive agents and pregnancy influence riboflavin excretion. Concentrations decrease when oral contraceptive agents are used, and during the third trimester of pregnancy, as tissue retention of the vitamin is increased in response to increased need. However, during the second trimester, excretion increases.
Within-subject variability can be large for 24h urinary riboflavin excretion. Coefficients of variation range from 13% to 25%, which are not reduced when results are expressed in terms of creatinine (van Dokkum et al., 1990).
Interpretive criteria
Interpretive criteria for urinary riboflavin excretion for adults and children are shown in Table 20b.4.| Subjects | Less than acceptable (at risk) |
Acceptable (low risk) |
|
|---|---|---|---|
| Deficient (high risk) | Suboptimal (med. risk) |
||
| Children | (µg/g creatinine) | ||
| 1–3y | < 150 | 150–499 | ≥ 500 |
| 4–6y | < 100 | 100–299 | ≥ 300 |
| 7–9y | < 85 | 85–269 | ≥ 270 |
| 10–15y | < 70 | 70–199 | ≥ 200 |
| Adults | < 27 | 27–79 | ≥ 80 |
| Preg. 1st tri. | < 27 | 27–65 | 66–129 |
| Preg. 2nd tri. | < 23 | 23–54 | 55–109 |
| Preg. 3rd tri. | < 21 | 21–49 | 50–99 |
| Adults | Other interpretive guidelines | ||
| µg/24h | < 40 | 40–119 | ≥ 120 |
| µg/6h | < 10 | 10–29 | ≥ 30 |
| µg in 4h after ribofl. load | < 1000 | 1000–1399 | ≥ 1400 |
Measurement of urinary riboflavin
In the past, fluorometric and microbiological assays have generally been used to determine riboflavin concentrations in urine. The fluorometric method measures the fluorescence of the flavins directly or converts the flavins to lumiflavin and then determines the fluorescence. The microbiological methods use Ochromonas danica or the protozoan Tetrahymena pyriformis.Measurement of urinary riboflavin using HPLC with fluorometry (Gatautis and Naito, 1981) or competitive protein-binding assays (Tillotson and Bashor, 1980) is also possible. The protein-binding assays are rapid, sensitive, and require no treatment of the urine sample prior to analysis. Discrepancies among the analytical methods have been documented. Results for the HPLC method with fluorometry tend to be lower than those with the older fluorometric method alone because, in the HPLC method, riboflavin is separated from other flavins (Smith, 1980).
20b.2.3 Riboflavin, FMN and FAD in blood
Plasma or serum concentration of riboflavin and its derivatives, FMN and FAD have been used in a few studies for assessment of riboflavin status. The results of these investigations showed that supplementation with low doses of riboflavin increased plasma free riboflavin (Bessey et al., 1956; Hustad et al., 2002; Guo et al., 2016) and FMN (Bessey et al., 1956; Hustad et al., 2002) whereas no detectable or very modest changes were reported for plasma FAD concentrations (Bessey et al., 1956; Zempleni et al., 1996; Hustad et al., 2002).The concentration of riboflavin forms in erythrocytes could be considered as marker of long-term riboflavin intake. Erythrocyte concentration of riboflavin (mainly FMN and FAD) was found to be significantly lower in individuals with clinical signs of riboflavin deficiency compared with healthy people (Bamji, 1969). Supplementation with a low dose of riboflavin for 12wks increased erythrocyte FMN by 87% whereas more modest but still significant response was reported for erythrocyte FAD (Hustad et al., 2002). A good relationship was shown between EGR AC and erythrocyte riboflavin (Bates et al., 1999) and erythrocyte FMN and FAD (Hustad et al., 2002) indicating that these measurements have potential and warrant further exploration.
Fluorometric and microbiological assays have been used to determine riboflavin in plasma / serum and erythrocytes. Hustad et al. (1999) have developed a sensitive and robust method, based on capillary electrophoresis and laser-induced fluorescence detection, for quantifying the low physiological concentrations of FMN and FAD, as well as riboflavin, in human plasma; later the method has been developed further for assessment of riboflavin derivatives in erythrocytes (Hustad et al., 2002).
20b.2.4 pyridoxamine phosphate oxidase (PPO) activity and activity coefficient
The measurement of erythrocyte PPO enzyme activity and its activity coefficient (PPO AC; assessed by the ratio of PPO activity before and after in vitro activation with the prosthetic group FMN) have been suggested as alternatives to EGR AC for assessment of riboflavin status. This option could be very useful for diagnosis of riboflavin deficiency in populations with a high prevalence of glucose-6-phosphate dehydrogenase deficiency since the EGR AC assay produces erroneous results in individuals with this genetic defect (Thurnham, 1972; Prentice et al., 1981).A fluorometric assay for measurement of PPO activity in red blood cell lysates has been developed (Bates and Powers, 1985) and subsequently optimized and adapted for assessment of PPO AC (Mushtaq et al., 2009). The results generated by this methodology demonstrated that both PPO and PPO AC are responsive to riboflavin supplementation and PPO showed a strong dose-response effect. In addition, in people free from glucose-6-phosphate dehydrogenase deficiency, PPO and PPO AC strongly correlated with the well-established biomarker of riboflavin status, EGR AC (Mushtaq et al., 2009). Therefore, both PPO and PPOAC are promising biomarkers, however, criteria to assess riboflavin adequacy based on these biomarkers have not been developed yet.