3rd Edition August, 2025
Abstract
A dietary assessment method is considered reproducible if it gives very similar results when used repeatedly in the same situation. The reproducibility, or precision, of any dietary method is a function of the measurement errors (discussed in Chapter 5), uncertainty resulting from true variation in daily nutrient intakes (Section 3.1.2), and variability introduced by a variety of other confounding factors (e.g., age and sex, day of the week, season, chronic illness, body weight status). If measurement errors and confounding factors are minimized, uncertainty in the estimation of usual nutrient intakes remains. Consequently, although the results from two separate occasions may disagree, the method may not have poor reproducibility; rather, food intakes may have changed. Therefore, only an estimate of reproducibility can be made. For a group of individuals, true variability arises because dietary intakes differ among individuals (between- or inter-person variation) and within one individual over time (within- or intra-person variation). For instance, variation associated with factors such as day of week and season may be shaped by cultural and environmental factors. Unlike measurement errors, no attempt should be made to try to minimize between- and within-person variation because they characterize the true usual intake of a group of individuals. Instead, the dietary assessment protocol should allow these two sources of variability to be separated and estimated statistically. In this way, the magnitude of the effect of within-person versus between-person variation can be considered during the interpretation of the dietary data. This is important because this variation biases estimates of the prevalence of inadequate or excessive intakes in a population (Section 3.3.2) and can distort correlations and other measures of association, thus obscuring diet-disease relationships (Section 5.3). Though related to repeatability under the umbrella of reliability, reproducibility is distinct from repeatability because of non-negligible changes in dietary intake over time. Repeatability of dietary assessment methods cannot be determined because replicate observations in dietary assessment are impossible. Reproducibility is also different from dependability, which assesses the extent to which measured differences reflect actual differences in intake. Reproducibility should be considered along with other properties, including validity (Chapter 7), to assess whether a method is suited to the research objective and context. For example, a method may have high reproducibility but lack validity for assessing the dietary components of interest in the target population. This chapter describes the assessment of reproducibility in the most used dietary assessment methods. Some notes on the statistical techniques used to assess reproducibility are also included, though researchers are encouraged to consult with statisticians to guide the optimal application and interpretation of such techniques. CITE AS: Kirkpatrick S, Reproducibility in Dietary Assessment https://nutritionalassessment.org/reproducibility/Boys 6-11y (n=940) | Boys 12-17y (n=830) | Girls 6-11y (n=928) | Girls 12-17y (n=775) | |||||||||
---|---|---|---|---|---|---|---|---|---|---|---|---|
Nutrients | VR | D | r | VR | D | r | VR | D | r | VR | D | r |
Energy, kcal | 2.8 | 5 | 0.72 | 1.8 | 3 | 0.79 | 2.8 | 5 | 0.72 | 1.7 | 3 | 0.80 |
Protein, g | 3.8 | 7 | 0.67 | 2.6 | 5 | 0.73 | 4.1 | 7 | 0.65 | 3.0 | 5 | 0.71 |
Carbohydrate, g | 2.3 | 4 | 0.75 | 1.8 | 3 | 0.79 | 2.6 | 5 | 0.73 | 1.7 | 3 | 0.80 |
Total sugars, g | 2.2 | 4 | 0.76 | 1.8 | 3 | 0.79 | 2.7 | 5 | 0.72 | 2.2 | 4 | 0.76 |
Total fat g | 4.1 | 7 | 0.65 | 2.3 | 4 | 0.75 | 3.8 | 7 | 0.66 | 2.5 | 4 | 0.74 |
Saturated fat, g | 4.0 | 7 | 0.65 | 2.0 | 4 | 0.77 | 4.3 | 8 | 0.64 | 2.6 | 5 | 0.73 |
Monounsaturated fat, g | 4.3 | 8 | 0.64 | 2.7 | 5 | 0.73 | 4.4 | 8 | 0.64 | 2.6 | 5 | 0.73 |
Polyunsaturated fat, g | 4.5 | 8 | 0.63 | 3.5 | 6 | 0.68 | 3.6 | 6 | 0.67 | 3.5 | 6 | 0.68 |
Cholesterol, mg | 4.2 | 7 | 0.64 | 3.1 | 5 | 0.70 | 8.1 | 14 | 0.52 | 3.7 | 7 | 0.67 |
Fiber, g | 2.4 | 4 | 0.74 | 2.3 | 4 | 0.75 | 3.6 | 6 | 0.68 | 1.8 | 3 | 0.79 |
vitamin A, mg | 3.4 | 6 | 0.68 | 1.9 | 3 | 0.78 | 3.6 | 6 | 0.67 | 2.7 | 5 | 0.73 |
vitamin E, mg | 3.6 | 6 | 0.68 | 3.4 | 6 | 0.68 | 4.1 | 7 | 0.65 | 3.4 | 6 | 0.69 |
vitamin C, mg | 3.4 | 6 | 0.68 | 2.5 | 4 | 0.74 | 3.3 | 6 | 0.69 | 2.8 | 5 | 0.72 |
vitamin D, mg | 2.2 | 4 | 0.76 | 1.8 | 3 | 0.79 | 2.2 | 4 | 0.76 | 2.0 | 4 | 0.77 |
Thiamin, mg | 4.7 | 8 | 0.62 | 1.8 | 3 | 0.79 | 4.0 | 7 | 0.66 | 2.3 | 4 | 0.75 |
Riboflavin, mg | 2.7 | 5 | 0.73 | 1.7 | 3 | 0.80 | 2.6 | 5 | 0.73 | 1.9 | 3 | 0.78 |
Niacin, mg | 6.7 | 12 | 0.56 | 2.7 | 5 | 0.73 | 4.3 | 8 | 0.64 | 3.8 | 7 | 0.66 |
vitamin B-6, mg | 4.8 | 9 | 0.62 | 2.6 | 5 | 0.73 | 3.9 | 7 | 0.66 | 2.8 | 5 | 0.72 |
vitamin B-12, mg | 3.5 | 6 | 0.68 | 2.3 | 4 | 0.76 | 2.9 | 5 | 0.71 | 3.0 | 5 | 0.71 |
Folate, mg | 4.2 | 8 | 0.64 | 2.0 | 4 | 0.77 | 4.1 | 7 | 0.65 | 2.1 | 4 | 0.77 |
Calcium, mg | 3.3 | 6 | 0.69 | 1.8 | 3 | 0.79 | 3.0 | 5 | 0.71 | 2.1 | 4 | 0.77 |
Iron, mg | 5.5 | 10 | 0.59 | 1.7 | 3 | 0.80 | 4.3 | 8 | 0.64 | 2.0 | 4 | 0.78 |
Zinc, mg | 4.5 | 8 | 0.63 | 3.0 | 5 | 0.71 | 4.1 | 7 | 0.65 | 3.7 | 7 | 0.67 |
Potassium, mg | 2.6 | 5 | 0.73 | 2.2 | 4 | 0.76 | 2.2 | 4 | 0.76 | 1.9 | 3 | 0.78 |
Sodium, mg | 2.9 | 5 | 0.71 | 2.2 | 4 | 0.76 | 3.0 | 5 | 0.70 | 2.2 | 4 | 0 |
Two 24h recalls | Three 24h recalls | Four 24h recalls | Five 24h recalls | |||||||||
---|---|---|---|---|---|---|---|---|---|---|---|---|
Descriptions | RC | -95%CI | +95%CI | RC | -95%CI | +95%CI | RC | -95%CI | +95%CI | RC | -95%CI | +95%CI |
Energy | 0.17 | -0.21 | 0.46 | 0.28 | -0.03 | 0.49 | 0.54 | 0.33 | 0.67 | 0.54 | 0.35 | 0.67 |
Nutrients | ||||||||||||
Carbohydrate | 0.15 | -0.24 | 0.45 | 0.26 | -0.05 | 0.48 | 0.60 | 0.40 | 0.71 | 0.56 | 0.37 | 0.68 |
Protein | 0.04 | -0.37 | 0.37 | 0.35 | 0.06 | 0.55 | 0.55 | 0.34 | 0.68 | 0.59 | 0.40 | 0.70 |
Fat | 0.08 | -0.33 | 0.40 | 0.13 | -0.22 | 0.39 | 0.43 | 0.19 | 0.59 | 0.49 | 0.28 | 0.63 |
Calcium | 0.38 | 0.04 | 0.60 | 0.28 | -0.03 | 0.49 | 0.56 | 0.36 | 0.69 | 0.53 | 0.34 | 0.66 |
Iron | -0.03 | -0.46 | 0.33 | 0.36 | 0.08 | 0.56 | 0.53 | 0.31 | 0.66 | 0.53 | 0.33 | 0.66 |
Zinc | 0.18 | -0.20 | 0.46 | 0.33 | 0.04 | 0.53 | 0.47 | 0.24 | 0.62 | 0.55 | 0.36 | 0.68 |
Vitamin B12 | -0.22 | -0.70 | 0.20 | 0.22 | -0.11 | 0.45 | 0.40 | 0.15 | 0.57 | 0.35 | 0.10 | 0.53 |
Vitamin B6 | 0.17 | -0.20 | 0.45 | 0.44 | 0.17 | 0.61 | 0.59 | 0.39 | 0.71 | 0.58 | 0.39 | 0.69 |
Vitamin C | 0.22 | -0.15 | 0.49 | 0.35 | 0.07 | 0.55 | 0.43 | 0.19 | 0.59 | 0.44 | 0.21 | 0.59 |
Vitamin A | 0.42 | 0.09 | 0.62 | 0.32 | 0.02 | 0.52 | 0.52 | 0.30 | 0.66 | 0.52 | 0.32 | 0.65 |
Folate | 0.04 | -0.37 | 0.37 | 0.32 | 0.02 | 0.52 | 0.58 | 0.37 | 0.70 | 0.54 | 0.34 | 0.66 |
Riboflavin | -0.01 | -0.44 | 0.34 | 0.30 | 0.00 | 0.51 | 0.25 | -0.05 | 0.46 | 0.31 | 0.04 | 0.50 |
Thiamine | 0.27 | -0.09 | 0.52 | 0.24 | -0.08 | 0.47 | 0.45 | 0.22 | 0.60 | 0.46 | 0.24 | 0.61 |
Niacin | 0.43 | 0.11 | 0.62 | 0.49 | 0.23 | 0.64 | 0.55 | 0.35 | 0.68 | 0.60 | 0.41 | 0.71 |
Food groups | ||||||||||||
Maize meal | 0.49 | 0.17 | 0.67 | 0.47 | 0.21 | 0.63 | 0.59 | 0.39 | 0.71 | 0.65 | 0.48 | 0.75 |
Bread group | 0.26 | -0.10 | 0.52 | 0.31 | 0.01 | 0.52 | 0.57 | 0.36 | 0.69 | 0.61 | 0.44 | 0.72 |
Cereal group | 0.01 | -0.40 | 0.35 | 0.30 | 0.00 | 0.51 | 0.51 | 0.29 | 0.65 | 0.55 | 0.35 | 0.67 |
Milk group | 0.55 | 0.24 | 0.70 | 0.50 | 0.25 | 0.65 | 0.51 | 0.29 | 0.65 | 0.56 | 0.37 | 0.68 |
Meat group | 0.13 | -0.27 | 0.43 | 0.14 | -0.21 | 0.40 | 0.38 | 0.12 | 0.55 | 0.45 | 0.23 | 0.60 |
Fruit & veg, | 0.06 | -0.35 | 0.39 | 0.26 | -0.05 | 0.48 | 0.49 | 0.27 | 0.63 | 0.44 | 0.21 | 0.59 |
Sweets | 0.06 | -0.36 | 0.39 | 0.23 | -0.09 | 0.46 | 0.50 | 0.27 | 0.64 | 0.40 | 0.16 | 0.5 |
Unadjusted models | Adjusted models | |||||||
---|---|---|---|---|---|---|---|---|
Nutrients | Within- person (%) | Between- person (%) | Seasonal (%) | Ratio | Within- person (%) | Between- person (%) | Seasonal (%) | Ratio |
Energy (kcal/d) | 80·7 | 11·0 | 8·3 | 7·3 | 71·3 | 12·1 | 6·2 | 5·9 |
Protein (g/d) | 87·2 | 8·6 | 4·2 | 10·1 | 80·9 | 8·4 | 5·5 | 9·7 |
Fat (g/d) | 81·9 | 15·2 | 2·9 | 5·4 | 76·4 | 16·1 | 2·9 | 4·8 |
Carbohydrates (g/d) | 81·2 | 6·1 | 12·7 | 13·3 | 70·9 | 7·5 | 8·0 | 9·4 |
Ca (mg/d) | 87·6 | 3·4 | 9·0 | 25·5 | 83·2 | 3·0 | 11·6 | 27·5 |
Fe (mg/d) | 91·1 | 4·5 | 4·3 | 20·1 | 85·0 | 4·1 | 4·6 | 20·8 |
Zn (mg/d) | 84·3 | 10·2 | 5·5 | 8·3 | 77·7 | 10·7 | 3·7 | 7·3 |
Vitamin A (µg RAE/d) | 92·5 | 6·4 | 1·1 | 14·4 | 88·5 | 4·9 | 3·5 | 17·9 |
Thiamin (mg/d) | 75·0 | 9·4 | 15·6 | 8·0 | 65·1 | 8·4 | 17·5 | 7·7 |
Riboflavin (mg/d) | 79·5 | 0·3 | 20·2 | 232·8 | 69·1 | 1·1 | 23·0 | 65·5 |
Niacin (mg/d) | 86·7 | 3·3 | 10·0 | 26·3 | 78·6 | 2·6 | 14·3 | 30·7 |
Vitamin B6 (mg/d) | 73·3 | 12·7 | 14·0 | 5·8 | 63·3 | 9·0 | 17·3 | 7·0 |
Folate (µg/d) | 84·6 | 5·0 | 10·3 | 16·8 | 80·6 | 6·1 | 9·1 | 13·2 |
Vitamin B12 (µg/d) | 89·1 | 8·1 | 2·9 | 11·0 | 87·0 | 7·9 | 4·1 | 11·0 |
Vitamin C (mg/d) | 88·8 | 0·0 | 11·2 | – | 84·8 | 0·0 | 9·4 | – |
Correlation Coefficients Record 1 vs. 4 Pearson r Intraclass ri | ||
---|---|---|
Protein | 0.56 | 0.56 |
Total fat | 0.57 | 0.54 |
Saturated fat | 0.57 | 0.56 |
Polyunsaturated fat | 0.44 | 0.45 |
Cholesterol | 0.54 | 0.53 |
Total carbohydrate | 0.74 | 0.72 |
Sucrose | 0.60 | 0.66 |
Crude fiber | 0.65 | 0.65 |
Total vitamin A | 0.47 | 0.56 |
without suppl. | 0.34 | 0.41 |
Vitamin B6 | 0.68 | 0.79 |
without suppl. | 0.60 | 0.60 |
Vitamin C | 0.67 | 0.70 |
without suppl. | 0.63 | 0.68 |
Total calories | 0.67 | 0.63 |
Nutrient | Age | Mean (SEM) | CVw(%) | CVb(%) | Ratio | Days |
---|---|---|---|---|---|---|
Energy (kJ/day) | <4y | 5915.7 (103.1) | 19.1 | 18.3 | 1.1 | 5 |
>4y | 6206.3 (60.6) | 17.8 | 15.1 | 1.4 | 6 | |
Protein (g/day) | <4y | 54.9 (1.1) | 23.5 | 21.7 | 1.2 | 5 |
>4y | 56.7 (0.7) | 22.5 | 18.1 | 1.6 | 7 | |
Total fat (g/day) | <4y | 49.2 (1.1) | 31.4 | 20.4 | 2.4 | 10 |
>4y | 51.5 (0.7) | 32.3 | 18.8 | 2.9 | 13 | |
Saturated fatty acids (g/day) | <4y | 21.4 (0.5) | 31.3 | 23.6 | 1.8 | 7 |
>4y | 22.5 (0.3) | 33.2 | 18.6 | 3.2 | 14 | |
Monounsaturated fatty acids (g/day) | <4y | 18.0 (0.5) | 37.7 | 20.5 | 3.4 | 14 |
>4y | 18.8 (0.3) | 37.2 | 20.4 | 3.3 | 14 | |
Monounsaturated fatty acids (g/day) | <4y | 2.8 (0.02) | 13.0 | 7.3 | 3.1 | 13 |
>4y | 2.8 (0.02) | 12.9 | 7.1 | 3.3 | 14 | |
Polyunsaturated fatty acids (g/day) | <4y | 7.4 (0.2) | 41.6 | 30.8 | 1.8 | 8 |
>4y | 7.7 (0.2) | 44.9 | 29.5 | 2.3 | 10 | |
Polyunsaturated fatty acids (g/day) | <4y | 1.9 (0.03) | 21.9 | 17.1 | 1.6 | 7 |
>4y | 1.9 (0.02) | 22.2 | 16.1 | 1.9 | 8 | |
Cholesterol (mg/day) | <4y | 160.8 (4.1) | 49.8 | 16.6 | 9.0 | 38 |
>4y | 167.3 (3.0) | 48.2 | 17.6 | 7.5 | 32 | |
Cholesterol (mg/day) | <4y | 5.0 (0.02) | 9.2 | 4.1 | 5.0 | 21 |
>4y | 5.0 (0.02) | 8.6 | 4.0 | 4.6 | 19 | |
Carbohydrates (g/day) | <4y | 186.5 (3.7) | 19.8 | 21.7 | 0.8 | 4 |
>4y | 197.4 (2.5) | 17.8 | 17.5 | 1.0 | 4 | |
Simple carbo- hydrates (g/day) | <4y | 105.1 (2.8) | 24.1 | 29.6 | 0.7 | 3 |
>4y | 110.6 (1.8) | 24.1 | 23.8 | 1.0 | 4 | |
Complex carbo' hydrates (g/day) | <4y | 80.9 (1.7) | 25.8 | 19.9 | 1.7 | 7 |
>4y | 86.1 (1.2) | 23.6 | 21.1 | 1.3 | 5 | |
Fibre (g/day) | <4y | 12.8 (0.3) | 26.3 | 22.0 | 1.4 | 6 |
>4y | 13.6 (0.2) | 26.9 | 23.2 | 1.3 | 6 | |
Water (g/day) | <4y | 1244.3 (24.1) | 17.3 | 22.7 | 0.6 | 2 |
>4y | 1276.5 (16.1) | 17.1 | 20.9 | 0.7 | 3 |
1st interview (mean) | 2nd interview (mean) | SD of differences | Intraclass correlation ri | |
---|---|---|---|---|
Energy (kcal) | 2352 | 2327 | 434 | 0.86 |
Protein (g) | 82 | 79 | 14 | 0.80 |
Fat (g) | 101 | 103 | 26 | 0.81 |
Saturated fat (g) | 45 | 46 | 9 | 0.89 |
Linoleic acid (g) | 12 | 14 | 7 | 0.67 |
Carbohydrate (g) | 256 | 248 | 46 | 0.87 |
Dietary fiber (g) | 24 | 23 | 6 | 0.75 |
Alcohol (g) | 12 | 12 | 8 | 0.91 |
Pearson Correlation coefficient | Intraclass Correlation coefficient | |||
---|---|---|---|---|
Unadjusted | Energy-adjusted | Unadjusted | Energy-adjusted | |
Food groups | ||||
Cereals | 0.61 | 0.56 | 0.59 | 0.54 |
Milk | 0.60 | 0.59 | 0.58 | 0.59 |
Meat | 0.61 | 0.59 | 0.58 | 0.55 |
Eggs | 0.42 | 0.41 | 0.34 | 0.35 |
Fish | 0.40 | 0.41 | 0.38 | 0.39 |
Oils and fats | 0.30 | 0.31 | 0.26 | 0.30 |
Vegetables | 0.59 | 0.59 | 0.55 | 0.55 |
Legumes | 0.42 | 0.42 | 0.37 | 0.38 |
Tubers | 0.08 | 0.04 | 0.08 | 0.04 |
Fruits | 0.51 | 0.49 | 0.40 | 0.40 |
Dried fruits and nuts | 0.40 | 0.40 | 0.35 | 0.39 |
Chocolate and similar | 0.41 | 0.40 | 0.42 | 0.41 |
Coffee, cocoa and infusions | 0.78 | 0.77 | 0.77 | 0.75 |
Soft drinks | 0.45 | 0.44 | 0.44 | 0.43 |
Alcoholic beverages | 0.60 | 0.59 | 0.60 | 0.59 |
Nutrients | ||||
Energy | 0.69 | – | 0.66 | – |
Total protein | 0.43 | 0.33 | 0.32 | 0.22 |
Animal protein | 0.63 | 0.59 | 0.61 | 0.57 |
Vegetable protein | 0.50 | 0.45 | 0.44 | 0.43 |
Lipids | 0.58 | 0.51 | 0.57 | 0.49 |
Saturated fatty acids | 0.65 | 0.57 | 0.65 | 0.56 |
Monounsaturated fatty acids | 0.52 | 0.46 | 0.50 | 0.44 |
Polyunsaturated fatty acids | 0.39 | 0.25 | 0.37 | 0.24 |
Linoleic acid (C 18:2, n-6) | 0.40 | 0.26 | 0.38 | 0.25 |
α-linolenic acid (C 18:3, n-3) | 0.27 | 0.26 | 0.28 | 0.26 |
Eicosapentanoic acid, EPA (C 20:5, n-3) | 0.40 | 0.40 | 0.40 | 0.40 |
Docosapentanoic acid, DPA (C 22:5, n-3) | 0.50 | 0.48 | 0.51 | 0.49 |
Docosahexanoic acid, DHA (C 22:6, n-3) | 0.40 | 0.40 | 0.40 | 0.40 |
Trans FA | 0.53 | 0.42 | 0.51 | 0.41 |
Cholesterol | 0.54 | 0.48 | 0.52 | 0.46 |
Total carbohydrates | 0.66 | 0.61 | 0.58 | 0.57 |
Sugars | 0.50 | 0.47 | 0.45 | 0.46 |
Polysaccharides | 0.62 | 0.58 | 0.60 | 0.57 |
Ethanol | 0.63 | 0.62 | 0.62 | 0.61 |
Fiber | 0.49 | 0.51 | 0.47 | 0.50 |
Caffeine | 0.40 | 0.41 | 0.40 | 0.41 |
Sodium | 0.45 | 0.34 | 0.45 | 0.34 |
Potassium | 0.52 | 0.54 | 0.47 | 0.52 |
Calcium | 0.48 | 0.43 | 0.47 | 0.42 |
Magnesium | 0.53 | 0.50 | 0.44 | 0.46 |
Phosphorus | 0.53 | 0.45 | 0.50 | 0.43 |
Iron | 0.28 | 0.19 | 0.14 | 0.10 |
Zinc | 0.60 | 0.48 | 0.57 | 0.47 |
Selenium | 0.35 | 0.31 | 0.31 | 0.30 |
Iodine | 0.37 | 0.34 | 0.37 | 0.34 |
Vitamin A | 0.20 | 0.19 | 0.19 | 0.19 |
Retinoids | 0.45 | 0.35 | 0.44 | 0.35 |
Carotenoids | 0.46 | 0.46 | 0.45 | 0.45 |
Vitamin D | 0.21 | 0.19 | 0.17 | 0.17 |
Vitamin E | 0.47 | 0.45 | 0.44 | 0.43 |
Thiamin | 0.45 | 0.34 | 0.38 | 0.30 |
Riboflavin | 0.63 | 0.56 | 0.59 | 0.55 |
Niacin | 0.53 | 0.47 | 0.49 | 0.43 |
Vitamin B6 | 0.42 | 0.35 | 0.32 | 0.29 |
Folic acid | 0.32 | 0.33 | 0.29 | 0.31 |
Vitamin B12 | 0.17 | 0.12 | 0.15 | 0.12 |
Vitamin C | 0.52 | 0.51 | 0.51 | 0.50 |
Caffeine | 0.40 | 0.41 | 0.40 | 0.41 |
Baseline Median | Follow-up Median | Absolute Difference Median |
Relative change (%) Median | Spearman correlation coefficient (rs)* Crude Energy adj. | ||
---|---|---|---|---|---|---|
Food groups | ||||||
Potatoes (g/d) | 87·8 | 82·9 | =4·3 | -5·2 | 0·51 | 0·50 |
Vegetables (g/d) | 103·5 | 106·8 | 3·3 | 3·3 | 0·41 | 0·41 |
Legumes (g/d) | 4·0 | 4·3 | 0·0 | 1·5 | 0·45 | 0·45 |
Fruits (g/d) | 95·9 | 99·8 | 5·2 | 6·0 | 0·50 | 0·50 |
Dairy products (g/d) | 177·6 | 179·1 | 0·5 | 0·4 | 0·61 | 0·62 |
Cereals/cereal products (g/d) | 202·6 | 217·4 | 10·4 | 5·1 | 0·43 | 0·45 |
Meat/meat products (g/d) | 107·5 | 104·4 | -1·7 | 2·0 | 0·60 | 0·57 |
Fish/shellfish (g/d) | 16·4 | 19·7 | 0·0 | 0·1 | 0·52 | 0·50 |
Eggs/egg products (g/d) | 10·0 | 10·3 | 0·1 | 1·6 | 0·53 | 0·51 |
Added fat (g/d) | 21·6 | 20·0 | -1.2 | 6·3 | 0·47 | 0·44 |
Sugar/confectionery (g/d) | 32·5 | 30·5 | -1·5 | -6·7 | 0·60 | 0·56 |
Cakes (g/d) | 50·4 | 44·4 | -3·1 | -9·2 | 0·59 | 0·57 |
Non-alcoholic beverages (g/d) | 1324·2 | 1489·7 | 137·2 | 10·5 | 0·48 | 0·47 |
Alcoholic beverages (g/d) | 319·2 | 275·2 | 3·0 | -1·5 | 0·73 | 0·73 |
Condiments/sauces (g/d) | 12·5 | 11·7 | -0·7 | -7·1 | 0·50 | 0·48 |
Soups/bouillon (g/d) | 35·9 | 34·3 | -1·3 | -4·2 | 0·52 | 0·51 |
Miscellaneous (g/d) | 0·1 | 0·2 | 0·0 | 3·3 | 0·48 | 0·48 |
Nutrients | ||||||
Energy (kJ/d) | 8748·3 | 8672·6 | -20·4 | -1·0 | 0·53 | |
Protein (g/d) | 73·8 | 73·8 | -0·2 | -0·2 | 0·52 | 0·50 |
Fat (g/d) | 77·4 | 74·8 | -2·3 | -3.2 | 0·53 | 0·43 |
Carbohydrates (g/d) | 221·8 | 222·9 | 1·7 | 0·8 | 0·51 | 0·52 |
Ethanol (g/d) | 18·9 | 17·8 | -0·2 | -2·4 | 0·74 | 0·74 |
β-Carotene (mg/d) | 2103·4 | 2145·5 | 50·7 | 2·5 | 0·46 | 0·45 |
Vitamin C (mg/d) | 87·5 | 92·5 | 4·4 | 5·5 | 0·43 | 0·43 |
Calcium (mg/d) | 723·0 | 749·2 | 21·3 | 3·2 | 0·54 | 0·57 |
Baseline Median | Follow-up Median | Absolute Differnce Median |
Relative change (%) Median | Spearman correlation coefficient (rs)* Crude Energy adj. | ||
---|---|---|---|---|---|---|
Food groups | ||||||
Potatoes (g/d) | 69·6 | 67·6 | −1·7 | −2·6 | 0·53 | 0·52 |
Vegetables (g/d) | 110·6 | 115·1 | 4·8 | 4·4 | 0·45 | 0·45 |
Legumes (g/d) | 2·4 | 2·6 | 0·0 | 2·3 | 0·48 | 0·48 |
Fruits (g/d) | 105·2 | 110·9 | 5·7 | 5·6 | 0·49 | 0·49 |
Dairy products (g/d) | 204·6 | 202·7 | −3·0 | −1·7 | 0·55 | 0·55 |
Cereals/cereal products (g/d) | 166·6 | 177·6 | 7·4 | 4·7 | 0·44 | 0·43 |
Meat/meat products (g/d) | 68·5 | 68·1 | 0·0 | 0·0 | 0·62 | 0·61 |
Fish/shellfish (g/d) | 15·1 | 15·6 | 0·0 | 0·1 | 0·52 | 0·51 |
Eggs/egg products (g/d) | 9·4 | 9·4 | 0·0 | 0·1 | 0·52 | 0·49 |
Added fat (g/d) | 19·6 | 17·4 | −1·9 | −10·7 | 0·44 | 0·40 |
Sugar/confectionery (g/d) | 26·9 | 24·9 | −1·6 | −8·5 | 0·59 | 0·53 |
Cakes (g/d) | 44·7 | 37·9 | −4·7 | −14·2 | 0·59 | 0·54 |
Non-alcoholic beverages (g/d) | 1445·4 | 1657·3 | 195·8 | 14·3 | 0·47 | 0·48 |
Alcoholic beverages (g/d) | 80·1 | 76·1 | −0·8& | −1·8 | 0·77 | 0·76 |
Condiments/sauces (g/d) | 11·6 | 11·0& | −0·8 | −7·7 | 0·51 | 0·48 |
Soups/bouillon (g/d) | 26·6 | 26·6 | 0·0 | 0·2 | 0·50 | 0·48 |
Miscellaneous (g/d) | 0·3 | 0·4 | 0·0 | 6·5 | 0·52 | 0·52 |
Nutrients | ||||||
Energy (kJ/d) | 6955·9 | 6896·1 | −14·2 | −0·9 | 0·53 | |
Protein (g/d) | 59·5 | 60·1 | 0·6 | 1·0 | 0·50 | 0·49 |
Fat (g/d) | 64·9 | 61·7 | −2·8 | −4·5 | 0·53 | 0·41 |
Carbohydrates (g/d) | 182·6 | 185·6 | 1·5 | 0·9 | 0·51 | 0·49 |
Ethanol (g/d) | 5·8 | 5·6 | −0·1& | −4·6 | 0·77 | 0·77 |
β-Carotene (mg/d) | 2250·8 | 2336·8 | 82·2 | 4·0 | 0·49 | 0·49 |
Vitamin C (mg/d) | 93·6 | 99·7 | 5·9 | 6·7 | 0·45 | 0·45 |
Calcium (mg/d) | 724·9 | 747·1 | 18·4 | 2·7 | 0·50 | 0.53 |
Food group | SCC | Exact quartile agreement | Exact agreement
plus adjacent quartile | Quartile Disagree ment | Extreme quartile disagreement |
---|---|---|---|---|---|
Rice, pasta, grains and starches | .78 | 56 | 92 | 8 | 0 |
Savories (lasagne, pizza) | .70 | 52 | 89 | 9 | 2 |
White bread (rolls, tortillas, crackers) | .83 | 62 | 94 | 6 | 0 |
Wholemeal, brown breads, and rolls | .77 | 60 | 91 | 8 | 1 |
Breakfast cereals and porridge | .90 | 67 | 96 | 4 | 0 |
Biscuits | .56 | 48 | 86 | 11 | 3 |
Cakes, pastries and buns | .64 | 52 | 87 | 10 | 3 |
Milk | .74 | 49 | 91 | 7 | 2 |
Cheeses | .66 | 52 | 87 | 11 | 2 |
Yogurts | .79 | 58 | 97 | 2 | 1 |
Ice cream, creams and desserts | .77 | 55 | 94 | 4 | 2 |
Eggs and egg dishes | .69 | 56 | 81 | 16 | 3 |
Fats and oils (eg, butter, low-fat spreads, hard cooking fats) | .64 | 46 | 89 | 8 | 3 |
Potatoes and potato dishes | .61 | 51 | 86 | 9 | 5 |
Chipped, fried & roasted potatoes | .61 | 57 | 87 | 12 | 1 |
Peas, beans and lentils and vegetable and pulse dishes | .75 | 62 | 92 | 7 | 1 |
Green vegetables | .76 | 54 | 93 | 6 | 1 |
Carrots | .68 | 54 | 90 | 8 | 2 |
Salad vegetables (eg, lettuce) | .77 | 58 | 92 | 6 | 2 |
Other vegetables (eg, onions) | .85 | 56 | 97 | 2 | 1 |
Tinned fruit or vegetables | .55 | 86 | 86 | 14 | 0 |
Bananas | .81 | 60 | 95 | 5 | 0 |
Other fruits (eg, apples, pears, oranges) | .86 | 61 | 97 | 3 | 0 |
Nuts and seeds, herbs and spices | .77 | 68 | 84 | 13 | 3 |
Fish and fish products/dishes | .84 | 57 | 95 | 5 | 0 |
Bacon and ham | .88 | 73 | 97 | 3 | 0 |
Red meat (eg, beef, veal, lamb, pork) | .74 | 67 | 90 | 9 | 1 |
Poultry (chicken and turkey) | .75 | 54 | 93 | 6 | 1 |
Meat products (eg, burgers, sausages, pies, processed meats) | .85 | 62 | 93 | 7 | 0 |
Alcoholic beverages | .92 | 71 | 99 | 1 | 0 |
Sugars, syrups, preserves, and sweeteners | .78 | 80 | 94 | 6 | 0 |
Confectionary and savory snacks | .73 | 52 | 92 | 8 | 0 |
Soups, sauces, and miscellaneous foods | .69 | 59 | 90 | 8 | 2 |
Teas and coffees | .85 | 69 | 96 | 3 | 1 |
Other beverages (eg, fruit juices, carbonated beverages, squash) | .75 | 54 | 95 | 4 | 1 |
Crude | Energy adjusted | Crude | Energy adjusted | |||||||||
---|---|---|---|---|---|---|---|---|---|---|---|---|
Nutrient | N | ICC (95% CI) | I2 | N | ICC (95% CI) | I2 | N | ICC (95% CI) | I2 | N | ICC (95% CI) | I2 |
Vitamin A | 27 | 0.623 (0.544, 0.692) | 95.2 | 12 | 0.597 (0.464, 0.705) | 92.2 | 42 | 0.613 (0.570, 0.651) | 87.2 | 22 | 0.553 (0.470, 0.627) | 89.8 |
Retinol | 18 | 0.589 (0.513, 0.656) | 85.3 | 9 | 0.537 (0.421, 0.635) | 74 | 49 | 0.573 (0.537, 0.607) | 80.6 | 38 | 0.513 (0.460, 0.562) | 84.3 |
Carotene | 9 | 0.632 (0.499, 0.735) | 97.1 | 5 | 0.512 (0.328, 0.658) | 0.86 | 25 | 0.605 (0.558, 0.649) | 89 | 21 | 0.510 (0.427, 0.584) | 90.8 |
β-Carotene | 21 | 0.677 (0.630, 0.719) | 76.1 | 6 | 0.613 (0.456, 0.733) | 81.9 | 39 | 0.613 (0.573, 0.649) | 72.3 | 28 | 0.554 (0.513, 0.593) | 56.5 |
Vitamin C | 47 | 0.665 (0.600, 0.722) | 96.1 | 22 | 0.635 (0.526, 0.723) | 94.9 | 92 | 0.623 (0.594, 0.650) | 85.3 | 57 | 0.596 (0.555, 0.633) | 83.6 |
Vitamin D | 16 | 0.678 (0.546, 0.777) | 98.4 | 5 | 0.671 (0.391, 0.837) | 98.1 | 30 | 0.617 (0.572, 0.659) | 83.5 | 15 | 0.560 (0.475, 0.635) | 81.5 |
Vitamin E | 34 | 0.665 (0.576, 0.738) | 97.5 | 15 | 0.606 (0.484, 0.704) | 94.4 | 52 | 0.626 (0.583, 0.667) | 91.4 | 30 | 0.555 (0.490, 0.613) | 87 |
Vitamin K | 3 | 0.656 (0.430, 0.804) | 97.4 | 2 | 0.693 (0.652, 0.729) | 0 | 7 | 0.602 (0.511, 0.679) | 60.4 | 5 | 0.658 (0.553, 0.742) | 32.7 |
Thiamin | 31 | 0.630 (0.587, 0.670) | 87.3 | 12 | 0.606 (0.492, 0.699) | 93.1 | 55 | 0.606 (0.579, 0.633) | 74.3 | 39 | 0.522 (0.475, 0.566) | 79.5 |
Riboflavin | 28 | 0.667 (0.616, 0.712) | 91.7 | 10 | 0.619 (0.483, 0.726) | 94.7 | 54 | 0.640 (0.611, 0.667) | 81 | 35 | 0.581 (0.528, 0.628) | 85.4 |
Niacin | 22 | 0.667 (0.609, 0.718) | 89.4 | 10 | 0.605 (0.499, 0.693) | 90.7 | 39 | 0.643 (0.573, 0.704) | 94.3 | 34 | 0.517 (0.452, 0.576) | 86.2 |
Vitamin B6 | 13 | 0.723 (0.522, 0.847) | 98.4 | 5 | 0.712 (0.516, 0.838) | 96.6 | 27 | 0.610 (0.553, 0.662) | 78.8 | 19 | 0.555 (0.483, 0.619) | 77.2 |
Folate | 25 | 0.637 (0.582, 0.686) | 90.5 | 6 | 0.597 (0.495, 0.684) | 76.4 | 49 | 0.612 (0.577, 0.646) | 81.6 | 26 | 0.605 (0.544, 0.659) | 82.5 |
Vitamin B12 | 13 | 0.678 (0.507, 0.797) | 97.7 | 7 | 0.683 (0.496, 0.809) | 96.8 | 28 | 0.635 (0.577, 0.686) | 82.3 | 21 | 0.575 (0.490, 0.648) | 87.5 |
Se | 11 | 0.661 (0.608, 0.709) | 69.3 | 4 | 0.586 (0.429, 0.709) | 78.7 | 15 | 0.648 (0.586, 0.702) | 82.4 | 11 | 0.568 (0.446, 0.670) | 87.6 |
Mg | 19 | 0.674 (0.612, 0.728) | 88.4 | 6 | 0.617 (0.492, 0.717) | 87.5 | 30 | 0.669 (0.603, 0.725) | 89.9 | 19 | 0.629 (0.544, 0.701) | 86.8 |
Ca | 52 | 0.635 (0.588, 0.676) | 91.8 | 23 | 0.642 (0.566, 0.708) | 91 | 87 | 0.622 (0.594, 0.649) | 83 | 55 | 0.586 (0.545, 0.626) | 84.1 |
Fe | 39 | 0.640 (0.581, 0.692) | 93.9 | 19 | 0.564 (0.496, 0.625) | 79.4 | 75 | 0.613 (0.582, 0.642) | 83.8 | 47 | 0.570 (0.525, 0.612) | 82.8 |
I | 2 | 0.499 (0.338, 0.632) | 73.7 | 3 | 0.507 (0.421, 0.585) | 35 | 2 | 0.828 (0.724, 0.894) | 19.8 | 1 | 0.744 (0.600, 0.841) | N/A |
Zn | 26 | 0.595 (0.556, 0.631) | 68.8 | 12 | 0.573 (0.495, 0.641) | 72.3 | 26 | 0.623 (0.565, 0.675) | 85.3 | 18 | 0.597 (0.507, 0.675) | 86.7 |
Cu | 4 | 0.658 (0.620, 0.693) | 0 | 1 | 0.690 (0.646, 0.728) | N/A | 6 | 0.748 (0.620, 0.837) | 86.6 | 5 | 0.726 (0.608, 0.813) | 86.6 |
K | 25 | 0.672 (0.598, 0.736) | 95.4 | 7 | 0.637 (0.486, 0.752) | 93.6 | 49 | 0.637 (0.605, 0.667) | 80 | 34 | 0.608 (0.566, 0.647) | 73.4 |
P | 23 | 0.605 (0.521, 0.676) | 91.9 | 9 | 0.635 (0.544, 0.711) | 80.7 | 43 | 0.621 (0.575, 0.662) | 83.4 | 30 | 0.579 (0.521, 0.630) | 82.1 |
Na | 25 | 0.652 (0.499, 0.766) | 98.2 | 8 | 0.670 (0.474, 0.802) | 97 | 41 | 0.623 (0.582, 0.661) | 83.9 | 30 | 0.552 (0.489, 0.609) | 86.7 |
Mn | 2 | 0.621 (0.382, 0.781) | 64.8 | N/A | N/A | N/A | 5 | 0.655 (0.596, 0.707) | 0 | 2 | 0.719 (0.645, 0.779) | 0 |
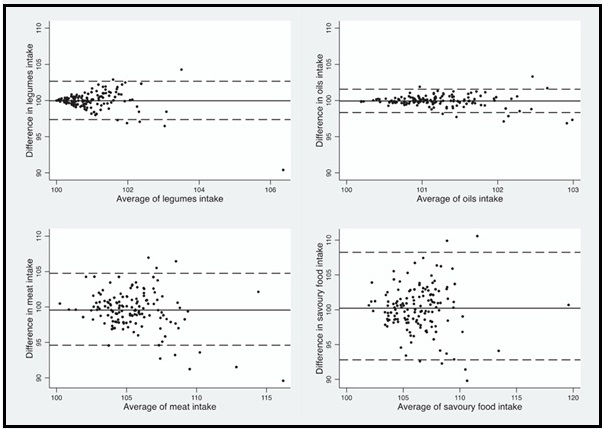
Food groups | ICC | Mean difference (%) | P-value t test | Lower limit (%) | Upper limit (%) |
---|---|---|---|---|---|
Vegetables (g) | 0.46 | 99.97 | 0.952 | 89.68 | 111.44 |
Fresh (g) | 0.54 | 100.25 | 0.654 | 87.74 | 114.55 |
Dried fruit (g) | 0.03 | 100.00 | 0.857 | 99.51 | 100.50 |
Nuts (g) | 0.22 | 100.00 | 0.797 | 99.92 | 100.08 |
Legumes (g) | 0.14 | 99.97 | 0.803 | 97.36 | 102.66 |
Breakfast cereals (g) | 0.27 | 99.97 | 0.639 | 98.35 | 101.62 |
White (g) | 0.34 | 99.94 | 0.765 | 95.55 | 104.54 |
Bread substitutes (g) | 0.21 | 100.06 | 0.544 | 97.62 | 102.57 |
Pasta/rice/couscous (g) | 0.36 | 100.10 | 0.606 | 95.57 | 104.85 |
Potatoes (g) | 0.37 | 99.98 | 0.889 | 95.83 | 104.29 |
Sweets (g) | 0.43 | 99.89 | 0.639 | 94.35 | 105.75 |
Cheeses/yogurt (g) | 0.41 | 99.89 | 0.614 | 95.07 | 104.97 |
Fishery products (g) | 0.40 | 99.84 | 0.152 | 97.19 | 102.56 |
Meat (g) | 0.41 | 99.56 | 0.040 | 94.61 | 104.76 |
Eggs (g) | 0.37 | 100.02 | 0.557 | 99.22 | 100.83 |
Animal fats (g) | 0.44 | 100.00 | 0.827 | 99.90 | 100.10 |
Oils (g) | 0.23 | 99.94 | 0.398 | 98.34 | 101.57 |
Savoury food (g) | 0.41 | 100.23 | 0.475 | 92.81 | 108.24 |
Water (ml) | 0.47 | 102.05 | 0.611 | 39.63 | 262.83 |
Soft 0drinks (ml) | 0.49 | 100.95 | 0.241 | 83.48 | 122.06 |
Fruit juice (ml) | 0.41 | 100.59 | 0.274 | 88.64 | 114.15 |
Milk (ml) | 0.56 | 100.50 | 0.318 | 89.30 | 113.11 |
Tea/coffee (ml) | 0.56 | 100.09 | 0.649 | 95.38 | 105.04 |
Alcoholic drinks (ml) | 0.51 | 99.73 | 0.286 | 93.99 | 105.8 |
N | Unadjusted energy intake Mean (SE) | p Value | Adjusted energy intake Mean (SE) | p Value | |
---|---|---|---|---|---|
Call sequence | |||||
1 | 79 | 1672.3 (57.2) | Reference | 1500.9 (200.9) | Reference |
2 | 79 | 1865.4 (84.9) | 0.02 | 2246.4 (156.5) | 0.007 |
3 | 79 | 1907.7 (84.4) | 0.003 | 2315.3 (139.5) | 0.001 |
4 | 79 | 1946.6 (83.3) | 0.005 | 1704.3 (200.5) | 0.52 |
5 | 79 | 1853.4 (73.0) | 0.04 | 1667.7 (189.4) | 0.56 |
6 | 79 | 1716.6 (73.6) | 0.62 | 1513.1 (193.6) | 0.97 |
7 | 79 | 1817.7 (69.5) | 0.11 | 1831.7 (197.3) | 0.25 |
Days of the week | |||||
Sunday | 72 | 1937.0 (73.1) | Reference | 1906.1 (83.2) | Reference |
Monday | 80 | 1751.0 (76.5) | 0.16 | 1858.0 (79.5) | 0.59 |
Tuesday | 109 | 1721.0 (62.2) | 0.01 | 1813.1 (75.3) | 0.27 |
Wednesday | 69 | 1674.7 (78.2) | 0.007 | 1786.8 (76.9) | 0.19 |
Thursday | 53 | 1887.6 (87.4) | 0.55 | 1915.9 (80.4) | 0.99 |
Friday | 84 | 1922.5 (76.0) | 0.04 | 1746.0 (64.5) | 0.04 |
Saturday | 86 | 1922.8 (81.2) | 0.61 | 1797.5 (73.2) | 0.14 |