
Courtney-Martin G, Elango R,
Haliburton B, Paoletti A,
and Gibson R.S.
Principles
of Nutritional Assessment:
Protein assessment
3rd Edition. June, 2025
Abstract
The assessment of protein status in the human body is challenging because available biomarkers lack specificity. Short-term inadequate intakes lead to protein losses from the visceral protein pool, quantified traditionally using visceral serum proteins, all of which have a low sensitivity and specificity. Additional protein biomarkers in serum or whole blood used may include serum insulin-like growth factor‑1 (IGF‑1), considered more sensitive and specific than visceral serum proteins, serum creatinine, a potential biomarker of skeletal muscle mass, and blood urea nitrogen (BUN) used as a biomarker of protein intake, especially in preterm infants. In chronic protein deficiency, there is loss of skeletal muscle mass which can be measured by technological methods in clinical settings such as dual-energy X-ray absorptiometry (DXA), ultrasound, and bioelectrical impedance analysis (BIA). Future studies may apply BIA‑derived phase angle in both community and clinical settings to detect reduced muscle mass and strength (i.e., sarcopenia) especially in the elderly. Fat‑free mass index, calculated by dividing fat‑free mass by height squared, may be used to assess muscle mass in patients with chronic illnesses. In resource poor settings, however, proxy measures of muscle mass based on anthropometry such as mid-upper arm circumference (MUAC), mid-upper arm muscle circumference (MUAMC), arm muscle area (AMA), and calf circumference are used. In the past, urinary metabolites such as creatinine, 3‑hydroxyproline and 3‑methylhistidine have also been used as indicators of skeletal muscle mass with varying success. Functional indices of protein status include changes in immunological responses and muscle function, the latter through hand grip strength, and more recently BIA‑phase angle. Preferably, a combination of measurements, based on selected serum biomarkers, anthropometry, and tests of skeletal muscle mass and function, should be used to assess body protein status. CITE AS: Courtney-Martin G, Elango R, Haliburton B, Paoletti A, & Gibson RS; Principles of Nutritional Assessment: Protein Assessment.https://nutritionalassessment.org/proteinb/
Email: Rosalind.Gibson@Otago.AC.NZ
Licensed under CC-BY-4.0
( PDF )
16b.1 Assessment of protein status
A comprehensive assessment of protein status requires dietary intake data, and selected anthropometric and biochemical measures. In chronic protein deficiency, if facilities are available, technological methods such as dual-energy X-ray absorptiometry (DXA), ultrasound, and bioelectrical impedance analysis (BIA) can also be used to quantify loss of skeletal muscle mass. No single parameter is sufficiently reliable to assess protein nutritional status. Protein turnover is a continuous process by which all body proteins are broken down and resynthesized. The balance of breakdown and synthesis reaches a steady state when there is no net gain or loss of protein. With inadequate protein intake and/or a diet limited in indispensable amino acids, the balance shifts towards tissue catabolism to provide sufficient amino acids for endogenous requirements. Short-term inadequate intake leads to protein losses from the visceral protein pool (i.e. serum proteins, erythrocytes, granulocytes, lymphocytes, etc (de Blaauw et al., 1996). Traditionally, the visceral protein pool has been quantified through the measurement of circulating visceral serum proteins, details of which are outlined below. In chronic protein deficiency, however, muscle proteins undergo proteolysis to supply the necessary amino acids for enhanced protein synthesis. Therefore, there is loss of both skeletal muscle mass and muscle function (Hansen et al., 2000). Several methods are available for measuring skeletal muscle mass and function; they vary in complexity, availability and cost and are also discussed below. Characteristics of the visceral serum proteins used traditionally to assess protein nutritional status in both community settings in low‑income countries and in hospitalized patients are summarized in Box 16b.1. The main site of synthesis for most of the visceral proteins is the liver.
Box 16b.1 Serum proteins to assess protein nutritional status.
Theoretically, visceral protein biomarkers have three potential
roles, namely diagnosis of protein-energy malnutrition, monitoring of
therapeutic interventions , and the provision of information on prognosis
(i.e., predicting outcome) on which to decide whether to intervene
therapeutically
(Livingstone, 2013).
To accomplish these roles, an
ideal biomarker should have the following characteristics listed in Box
16b.2 and summarised by Livingstone
(2013).
Features of an ideal protein-energy visceral protein
biomarker
Unfortunately, none of the visceral protein biomarkers listed in
Box 16b.1 meet all the criteria listed in Box 16b.2. This has led to
controversy over their use, especially in clinical settings where acute
and chronic disease is common. In such settings visceral serum proteins
act as negative-acute phase proteins, declining in response to
inflammation due to the influence of cytokines, regardless of
malnutrition. As it is not possible to separate the
influence of inflammation from that of malnutrition,
the American Society for Parenteral and Enteral Nutrition has deemed the available
visceral serum proteins of limited use for assessing
protein-energy malnutrition. Instead, they emphasize that visceral serum proteins should
only be recognized as inflammatory biomarkers associated with "nutrition
risk"
(Evans et al., 2019).
The current consensus is that visceral serum proteins should
always be used alongside biomarkers of inflammation and as a complement
to other methods of nutritional assessment such as a nutrition-focused
physical examination
(Bharadwaj et al., 2016).
Several nutrition-focused physical examination assessment tools are available for
diagnosing malnutrition in hospitalized patients. See Keller
(2019)
for more details. Whether visceral serum proteins can be used to diagnose
protein-energy nutritional status in the absence of inflammation is the
subject of active investigation.
Currently, the biomarker most widely used to identify the
presence of inflammation in both community and hospital settings is
serum C‑reactive protein (CRP). It is a useful biomarker because it responds
rapidly to changing clinical conditions, is widely available, and has high sensitivity
(Evans et al 2019).
Measuring CRP concurrently with visceral serum proteins allows for some
differentiation between the contribution of inflammation versus protein-energy
malnutrition when interpreting decreased visceral serum protein levels
(Bharadwaj et al., 2016).
The importance of adjusting for the confounding effects
of inflammation on biomarkers in low‑income countries has led to a new
approach using regression correction to adjust for the confounding
effects of inflammation termed the "BRINDA inflammation adjustment
method." For the BRINDA method, CRP alone, alpha‑1‑acid glycoprotein
(AGP) alone, or both AGP and CRP together can be used. So far, the
BRINDA inflammation adjustment method has been applied only to
biomarkers of micronutrient status (i.e., iron, zinc, and vitamin A).
However, in the future this method may be modified for use with visceral
serum proteins when used in settings where inflammation co‑exists. For
details of a practical guide on applying the BRINDA adjustment method,
see Luo et al.
(2023).
All the serum visceral proteins are affected to varying degrees
by several other factors besides inflammation, which together reduce
their specificity; these are summarized in Box 16b.2 and discussed in
more detail below.
- Albumin (Half life = 18d)
- Clinical Use: Severe malnutrition
- Advantages: Ease of measurement; Low cost; Reproducible; Excellent predictor of surgical outcomes; Consistent response to interventions.
- Limitations: Affected by protein-losing enteropathy, renal loss, burns, fluid status, and by liver disease.
- Transferrin (Half life = 8‑9d)
- Clinical Use: Limited to the diagnosis of chronic deficiency.
- Advantages: Shorter half-life. Responds more rapidly to changes in protein status.
- Limitations: Affected by iron deficiency and by infection.
- Pre-albumin (Half life = 2d)
- Clinical Use: Diagnosis of acute depletion
- Advantages: Shorter half-life. Easily available. Expected to change more rapidly with changes in nutrient status. Unaffected by hydration status.
- Limitations: Affected by vitamin A deficiency.
- Retinol‑binding protein (Half life = 12h)
- Clinical Use: Diagnosis of acute depletion
- Advantages: Short half-life
- Limitations: Affected by vitamin A and zinc deficiency, and by infection,
Box 16b.2 Factors affecting serum
protein concentrations.
- Inadequate protein intake resulting from low dietary intakes, anorexia, unbalanced diets, hypocaloric intravenous infusions
- Altered metabolism generated by trauma, stress, sepsis, and hypoxia
- Specific deficiency of plasma proteins caused by protein-losing enteropathy and liver disease
- Reduced protein synthesis resulting from inadequate energy intake, electrolyte deficiency, trace element deficiencies (e.g., iron and zinc), vitamin A deficiency
- Pregnancy-induced changes in the amount and distribution of body fluids
- Capillary permeability changes
- Drugs (e.g., oral contraceptive agents)
- Strenuous exercise
16b.1.1 Total serum protein
This biomarker measures the total protein content in blood serum and includes albumin and globulins. It is easily measured and in the past was used an index of visceral protein status in national nutrition surveys, especially in low-income countries (Evans et al 2019). However, it is now known to be a poor biomarker of protein status. Many factors influence total serum protein concentrations as shown in Box 16b.2, compromising their specificity and sensitivity. An additional factor often impacting on total serum protein levels in severely ill hospital patients is the administration of blood products such as albumin. A recent systematic review and meta-analysis of older adults found only a moderate association between total serum protein levels and risk of malnutrition in a non‑acute population, defined by validated nutrition assessment tools, such as subjective global assessment (SGA); although other biomarkers evaluated were said to be superior (Zhang et al., 2017).16b.1.2 Serum albumin
The primary protein in human serum is albumin (between 3‑5g/kg body weight) which has been used in the past as a biomarker of protein nutritional status. However, serum albumin concentrations only reflect changes within the intravascular space and not the total visceral protein pool. As such, it is a poor nutritional biomarker. Albumin has a large pool size and a long half-life (14‑20d) so it is insensitive to short-term changes in protein status and thus not appropriate for assessing acute changes in nutritional status. Moreover, in cases of both acute and chronic illness, serum albumin concentrations may be maintained due to a compensatory reduction in albumin catabolism. For example, in the anorexia nervosa population, normal or only slightly decreased serum albumin levels have been observed, despite the presence of severe protein-energy malnutrition, low muscle mass and reduced muscle strength (Lee et al., 2015). Albumin plays a significant role in maintaining colloidal osmotic pressure (Levitt & Levitt, 2016) so in an inflammatory state albumin leaks out of the intravascular space resulting in a measurable decrease in serum values (Evans et al., 2019). Even a well‑nourished person can develop hypoalbuminemia (low albumin) within hours of a traumatic injury or acute illness due to inflammation and fluid shifts (Soeters et al., 2019). As albumin leaves the intravascular space, interstitial edema can develop which further dilutes measured serum values. Albumin also provides more than 50% of the antioxidant activity in plasma (Taverna et al., 2013) so it binds to pro‑oxidative substances and is rapidly degraded. The half‑life of albumin may be shortened during an inflammatory period, further contributing to reduced serum levels. The use of serum albumin concentrations as a prognostic index for the development of postoperative complications has been extensively studied. Adults undergoing spinal surgery with pre‑operative hypoalbuminemia were reported to experience an increase in postoperative complications (hospital length of stay, surgical site infections and readmission rates) (Chaker et al., 2024). Examination of the National Surgical Quality Improvement Program (NSQIP) database has also revealed increased 30d morbidity and mortality rates in patients with pre‑operative hypoalbuminemia following a variety of other surgical procedures including pancreatic-duodenectomy surgery (Sawchuk et al., 2024), esophagectomy (Li & Zhu, 2024), and head and neck microvascular surgery (Xu et al., 2024). Whether complications could be improved with pre‑operative nutritional and/or medical interventions is uncertain due to the retrospective nature of these studies. In many cases, however, surgery was the only possible intervention to improve the underlying inflammatory processes. Several other studies attempting to evaluate whether intense nutritional interventions in acute or chronically ill patients with hypoalbuminemia improved low serum albumin levels and/or clinical outcomes were unable to demonstrate any significant improvements. The 2021 American Society of Parenteral and Enteral Nutrition (ASPEN) position paper discourages the use of serum albumin as a proxy measure of total body protein and as a biomarker of nutritional status in clinical settings (Evans et al 2019). Factors affecting serum albumin Age influences serum albumin, with concentrations rising until the second or third decade of life and then declining thereafter, possibly related to a reduction in the rate of albumin synthesis. In a 2017 review and meta-analysis of malnutrition risk in older adults (n=111), albumin levels <35g/dL were associated with reduced nutritional status. However, the authors suggest that albumin was insensitive as a screening biomarker in this population (Zhang et al., 2017). Sex also influences serum albumin levels, with males tending to have higher values than females, the maximum difference occurring at age 25y (Richie et al., 1999). Pregnancy reduces serum albumin due in part to hemodilution. Inflammation, infection, and metabolic stress elicit the acute phase response mediated by pro‑inflammatory cytokines. Albumin is a negative acute phase reactant, so its production is decreased if there is an active infection or inflammation resulting in low serum albumin concentrations (Evans et al 2019). Disease states such as some gastrointestinal diseases (e.g., ulcerative colitis and Crohn's disease) and renal diseases are associated with decreased serum albumin concentrations (i.e., hypoalbuminemia) due to an increase in albumin losses either via the gastrointestinal tract or kidneys. In liver disease, low serum albumin concentrations arise from a reduction in protein synthesis, whereas in hypothyroidism and congestive heart failure, fluid retention and dilutional effects contribute to reduced serum albumin levels. Degradation of albumin is also reduced in hypothyroidism further contributing to altered albumin levels Semi-starvation is associated with low albumin levels (i.e., hypoalbuminemia) due to a reduction in protein intake which in turn reduces the ability of the liver to synthesize albumin. In some cases, however, fluid loss may occur leading to higher serum albumin concentrations (hyperalbuminemia). Dehydration as may occur with severe diarrhea may result in hyperalbuminemia as a result of a diminished plasma volume. Blood transfusions and parenteral administration of albumin may increase serum albumin, masking any changes in levels in hospital patients, thus confounding its use. Interpretive criteria and measurement of serum albumin Reference intervals are a statistically derived range of values that encompass the central 95% of values from a healthy reference population. Values within this interval are assumed to represent a normal range. Biomarker test results lying outside of the reference interval suggest an abnormal result. For more discussion, see Chapter 1: Introduction; Section 1.6 Evaluation of nutritional assessment indices. Unfortunately, depending on the biomarker, reference intervals are not necessarily transferable between laboratories due to differences in both the reference populations (e.g., ethnic composition, geographic factors, habitual diets, lifestyles) and analytical methods used. Several countries have established reference intervals for serum albumin. In the U.S, Ritchie et al. (1999) have derived reference intervals for serum albumin stratified by age and sex from a cohort of over 124,000 Caucasians in the northeastern United States. Individuals with evidence of inflammation (i.e., CRP ≥10mg/L) were excluded. The reference medians and percentiles by age and sex are presented in Table 16b.1. Measurements were standardized against the Certified Reference Material (CRM) 470‑RPPHS (Whicher et al., 1994; Baudner et al., 1994). It should be used to check the accuracy of all methods used to determine serum albumin.| Males | Females | ||||||
|---|---|---|---|---|---|---|---|
| Age (y) | 2.5th | 50th | 97.5th | 2.5th | 50th | 97.5th | |
| 1.0 | 35.9 | 43.1 | 51.9 | 36.1 | 43.5 | 52.2 | |
| 4.0 | 36.6 | 44.0 | 52.9 | 36.9 | 44.3 | 53.3 | |
| 7.0 | 36.9 | 44.3 | 53.3 | 37.2 | 44.7 | 53.7 | |
| 10.0 | 37.1 | 44.6 | 53.8 | 37.3 | 44.9 | 54.0 | |
| 14.0 | 37.7 | 45.3 | 54.5 | 36.6 | 44.0 | 52.9 | |
| 18.0 | 38.1 | 45.9 | 55.1 | 36.3 | 43.7 | 52.5 | |
| 20.0 | 38.2 | 45.9 | 55.2 | 35.0 | 43.6 | 52.4 | |
| 30.0 | 37.9 | 45.5 | 54.8 | 35.0 | 43.3 | 52.0 | |
| 40.0 | 37.0 | 44.6 | 53.6 | 35.6 | 42.8 | 51.4 | |
| 50.0 | 36.1 | 43.6 | 52.3 | 35.1 | 42.1 | 50.7 | |
| 60.0 | 35.2 | 42.3 | 50.9 | 34.4 | 41.4 | 49.7 | |
| 70.0 | 34.3 | 41.2 | 49.6 | 33.7 | 40.6 | 48.8 | |
| 80.0 | 33.4 | 40.2 | 48.3 | 33.0 | 39.7 | 47.8 | |
16b.1.3 Serum prealbumin or transthyretin
Pre‑albumin, historically known as transthyretin, is a protein synthesized in the liver which acts as a transport protein for thyroid hormones. Prealbumin circulates bound to retinol‑binding protein 4 (RBP 4) and its retinol ligand. Pre‑albumin has a high indispensable to dispensable amino acid ratio (Beck & Rosenthal, 2002; Ranasinghe et al., 2022), a relatively short half‑life (2‑3d), and a smaller body pool size than albumin, and is not as sensitive to fluid status (Beck & Rosenthal, 2002; Bharadwaj et al., 2016). Recent research suggests that fluctuations in plasma prealbumin reflect both the size and alterations in lean body mass; for more details see Ingenbleek & Bernstein (2015). Synthesis of prealbumin decreases as the body nitrogen pools decline following a reduction in protein intake, suggesting that prealbumin may have potential as biomarker of protein nutritional status. Certainly in the rat model, prealbumin was noted to decrease after 14 days on an intake of sixty percent dietary protein (Le Moullac et al., 1992). The response of serum prealbumin to dietary protein intake has also been investigated in human studies. In children with severe protein-energy malnutrition, for example, prealbumin levels increased within 48 hours of protein supplementation and normalized within eight days of therapy (Ingenbleek et al., 1975). However, in these early studies, the possible influence of inflammation on the prealbumin response was not considered. In a later systematic review and meta-analysis of blood biomarkers associated with risk of malnutrition in older adults (Zhang et al., 2017), a sensitivity analysis confirmed that serum prealbumin concentrations were markedly reduced in response to acute inflammatory stress. In a later study of neonates in the neonatal intensive care unit (NICU), concentrations,of prealbumin were also negatively correlated with CRP (‑0.62; P<0.005) (Tian et al., 2018). Hence, together these findings emphasize that caution must be used when interpreting prealbumin concentrations in acute health care settings. The use of prealbumin as a nutritional biomarker in non-inflammatory states has also been investigated. In a systematic review of subjects with restrictive eating disorders but were otherwise healthy with no evidence of inflammatory illness, those with severe protein-energy malnutrition had normal prealbumin concentrations that did not decline until their Body Mass Index (BMI) was <12. Based on these findings, the authors concluded that prealbumin concentrations cannot be used as biomarkers of protein nutritional status or to identify the need for nutrition support even in otherwise healthy subjects with no evidence of inflammation (Lee et al., 2015). Nevertheless, considerable controversy remains over the usefulness of serum prealbumin as a biomarker of protein nutritional status. Investigations on the use of prealbumin as a biomarker for monitoring the efficacy of nutrition support in clinical nutrition practice have been extensive, in part because of its short half‑life (i.e., 2‑3d). Results have been mixed. Bernstein et al. (1989) reported weekly increases in serum prealbumin of 40‑50mg/L in response to adequate nutritional support. They suggested that a response of less than 20mg/L in a week is indicative of either inadequate nutritional support or a failure to respond to the treatment. Others have argued that if inflammation decreases during nutritional support, prealbumin will surely increase, so the part played by nutritional care will be difficult to distinguish (Casati et al., 1998). Indeed, the recent ASPEN position paper on the use of visceral proteins as nutrition biomarkers concluded that normalization of prealbumin during nutrition support could indicate several factors including the resolution of inflammation, the reduction of nutrition risk, a transition to anabolism, and/or potentially lower calorie and protein requirements (Evans et al., 2019). In view of these uncertainties, authors of the ASPEN publication discourage the use of prealbumin as a biomarker of total body protein or total muscle mass. They also conclude that prealbumin is not useful for monitoring nutrition support, even for individuals with no evidence of inflammatory illness. Nevertheless, the ASPEN recommendations remain open to debate. Despite its recognized limitations, according to Delliere & Cynober (2017), plasma prealbumin can be useful to diagnose malnutrition and its severity in those individuals with no inflammation syndrome. Moreover, they also advocate prealbumin as a good biomarker for monitoring the efficacy of the response to nutrition interventions. In their review, they provide two algorithms, one to interpret prealbumin levels in patients with a CRP concentration indicative of the absence of inflammation (i.e.,<15mg/L), and a second to interpret levels in intensive care unit patients; see Delliere & Cynober (2017), for more details. Factors affecting serum prealbumin levels Age and sex influence serum pre‑albumin. Concentrations increase linearly from birth during infant growth, plateauing in adulthood until the sixth decade, after which concentrations decline. At the onset of puberty, hormonal-induced sexual dimorphisms occur with males having higher concentrations than females which reach a plateau during full sexual maturity. These sex‑related differences are maintained during adulthood, with concentrations of 300‑330mg/L in adult males compared to 250‑270mg/L in adult females. From the sixth decade, concentrations show a stepwise decrease, with sex‑related differences becoming less marked and no longer evident by the eighth decade (Ingenbleek, 2022). Prealbumin is unaffected by ethnic differences or genetics (Delliere & Cynober, 2017). Inflammation, infection, stress elicit the acute phase response resulting in a decrease in serum prealbumin concentrations. Several mechanisms have been proposed for the observed decline, including the existence of hepatic reprioritization of protein synthesis, possibly increased tissue catabolism, and/or redistribution of prealbumin because of an increase in capillary permeability (Evans et al 2019). Disease states such as kidney disease degrade prealbumin so with any renal dysfunction prealbumin levels are increased. Conversely, prealbumin levels are decreased in liver disease, and dialysis because the ability of the liver to synthesize proteins, including prealbumin, is impaired. Likewise, significant hyperglycemia can decrease prealbumin levels through several mechanisms such as an increase in protein degradation, inflammation, and endothelial dysfunction. The latter causes increased permeability and loss of proteins like prealbumin from the blood stream (Delliere & Cynober, 2017; Bharadwaj et al., 2016). Concentrations may also be low with zinc deficiency because zinc is essential for the synthesis of proteins such as prealbumin (Beck & Rosenthal, 2002). Hyperthyroidism is associated with a decrease in serum prealbumin concentrations in part because the increased thyroid hormones reduce the amount of thyroxine (T4) available to bind with prealbumin as well as an increase in protein turnover and breakdown. In contrast in hypothyroid states, thyroid hormones are sometimes low resulting in increased prealbumin levels. This is because the reduced availability of thyroxine leads to less binding with prealbumin, potentially causing an accumulation of unbound prealbumin in the blood. Pregnancy and estrogen-containing preparations (e.g. oral contraceptive agents, estrogen replacement therapy) increase serum prealbumin concentrations due to increased liver protein synthesis in response to the increased demand and hormonal changes (i.e., increased levels of estrogen and progesterone). Medications such a corticosteroids and non‑steroidal anti‑inflammatory agents increase prealbumin concentrations Changes in fluid distribution and hydration changes modify serum prealbumin concentration, increasing with acute hydration and decreasing with hemodilution (Delliere & Cynober, 2017). Interpretive criteria and measurement of serum prealbumin The reference interval for serum prealbumin is reportedly 0.20‑0.40g/L, although varying with age and sex. Hence, these factors must be considered for the interpretation. Table 16b.2 presents the reference intervals for serum prealbumin (g/L) by age and sex (Richie et al., 1999).| Males | Females | ||||||
|---|---|---|---|---|---|---|---|
| Age (y) | 2.5th | 50th | 97.5th | 2.5th | 50th | 97.5th | |
| 1.0 | 0.12 | 0.18 | 0.26 | 0.12 | 0.18 | 0.26 | |
| 4.0 | 0.12 | 0.18 | 0.27 | 0.13 | 0.18 | 0.27 | |
| 7.0 | 0.13 | 0.18 | 0.27 | 0.13 | 0.19 | 0.28 | |
| 10.0 | 0.15 | 0.22 | 0.32 | 0.15 | 0.23 | 0.33 | |
| 14.0 | 0.18 | 0.26 | 0.37 | 0.17 | 0.25 | 0.36 | |
| 18.0 | 0.19 | 0.28 | 0.41 | 0.18 | 0.26 | 0.37 | |
| 20.0 | 0.20 | 0.29 | 0.42 | 0.18 | 0.26 | 0.38 | |
| 30.0 | 0.21 | 0.30 | 0.44 | 0.18 | 0.26 | 0.38 | |
| 40.0 | 0.21 | 0.31 | 0.45 | 0.18 | 0.26 | 0.39 | |
| 50.0 | 0.21 | 0.30 | 0.44 | 0.18 | 0.27 | 0.39 | |
| 60.0 | 0.20 | 0.29 | 0.43 | 0.18 | 0.27 | 0.39 | |
| 70.0 | 0.19 | 0.28 | 0.41 | 0.18 | 0.27 | 0.39 | |
| 80.0 | 0.19 | 0.27 | 0.40 | 0.18 | 0.26 | 0.39 | |
16b.1.4 Serum retinol‑binding protein
Retinol binding protein (RBP) is the serum protein responsible for the transport of retinol throughout the blood stream and is bound to prealbumin. Of the visceral proteins, retinol binding protein has the shortest half‑life (approximately 12h) with a relatively small body pool. Retinol binding protein is catabolized in the kidneys and is elevated with renal failure. Some of the factors affecting serum RBP are similar to those outlined for prealbumin, including the decrease in serum RBP concentrations during the acute phase response. Unlike prealbumin, however, RBP is significantly impacted by both vitamin A and zinc status, low levels of these micronutrients inhibiting mobilization of RBP in the liver. Hence, these are additional factors limiting RBP as a useful protein biomarker, limiting its use (Bharadwaj et al., 2016); Keller, 2019).16b.1.5 Serum creatinine
Serum creatinine is a derivative of the skeletal muscle protein creatine phosphate. Creatine is a nitrogenous organic acid made up of three amino acids, glycine, arginine, and methionine which is produced mainly in the liver and kidney, and then transported to skeletal and heart muscles. Once in the tissues, creatine is phosphorylated to creatine phosphate, a readily available energy source used for muscle contractions (Kashani et al., 2020). Creatinine in serum is produced from the spontaneous, non‑enzymatic breakdown of creatine in the skeletal muscle cells. This process is done continuously at a nearly constant rate in healthy subjects and is irreversible. Consequently, the body creatine pool must be replenished daily by the intake of indispensable amino acids. As serum creatinine originates mainly from the creatine in skeletal muscle cells, the circulating level of creatinine has been considered a potential biomarker reflecting muscle mass, provided kidney function is stable and under the steady state. However, many other factors besides muscle mass influence serum creatinine concentrations, and the contribution of muscle mass to the variation in serum creatinine appears small. Several studies have shown serum creatinine can serve as a biomarker of skeletal muscle in healthy adults. For example, Baxmann et al. (2008), in a study of healthy adults classified as sedentary or having mild or moderate / intense physical activity, observed serum creatinine was significantly correlated with lean body mass measured by bioelectrical impedance analyses (BIA), after adjustment for protein / meat intake and physical activity. Several other investigators have reported that serum creatinine is also a surrogate marker of skeletal muscle mass in dialysis patients, and that low lean body mass in the dialysis population is associated with increased mortality; see Patel et al. (2012) for a table summarizing these studies.| LBM (kg) estimated by variables | Limits of agreement | Mean difference 95% CI | Correl- ation* (r) | Correl- ation (p) |
|---|---|---|---|---|
| SCr | −6.7 to 6.7 | 0.0 (−0.6,0.6) | 0.34 | <0.001 |
| MAMC | −7.0 to 7.0 | 0.0 (−0.7, 0.7) | 0.35 | <0.001 |
| HGS | −7.0 to 7.0 | 0.0 (−0.6, 0.6) | 0.35 | <0.001 |
| Males | Females | |||||
|---|---|---|---|---|---|---|
|
Height (cm) |
60% Expec- ted Urine Creatinine (mg) |
Serum Creatinine (mg/dL) |
Height (cm) |
60% Expec- ted Urine Creatinine (mg) |
Serum Creatinine (mg/dL) | |
| 152.4 | 773 | 0.7 | 147.3 | 498 | 0.4 | |
| 154.9 | 795 | 0.7 | 149.9 | 511 | 0.4 | |
| 157.5 | 815 | 0.7 | 152.4 | 525 | 0.5 | |
| 160.0 | 832 | 0.7 | 154.9 | 540 | 0.5 | |
| 162.5 | 856 | 0.7 | 157.5 | 555 | 0.5 | |
| 165.1 | 880 | 0.8 | 160.0 | 569 | 0.5 | |
| 167.6 | 910 | 0.8 | 162.5 | 586 | 0.5 | |
| 170.2 | 933 | 0.8 | 165.1 | 604 | 0.5 | |
| 172.7 | 958 | 0.8 | 167.6 | 626 | 0.5 | |
| 175.3 | 985 | 0.9 | 170.2 | 646 | 0.6 | |
| 177.8 | 1015 | 0.9 | 172.7 | 665 | 0.6 | |
| 180.3 | 1043 | 0.9 | 175.3 | 685 | 0.6 | |
| 177.8 | 1071 | 0.9 | 177.8 | 704 | 0.6 | |
| 180.3 | 1099 | 1.0 | 180.3 | 724 | 0.6 | |
| 182.9 | 1135 | 1.0 | 182.9 | 744 | 0.6 | |
16b.1.6 Serum Insulin-like growth factor 1
Insulin-like growth factor (IGF‑1) (formerly called Somatomedin C) is a peptide hormone produced mainly in the liver in response to pituitary growth hormone. Insulin-like growth factor circulates in the serum largely bound to binding proteins (mainly IGF‑BP3) with minimum diurnal variation and a short half-life (approximately 24h). Serum IGF‑1 concentrations are dependent on age, with the lowest levels at birth, peaking during puberty, and gradually declining in adulthood. There are also physiological changes in IGF‑1 levels during normal pregnancy, with levels decreasing during the first and second trimesters, followed by an increase by the 36th week of pregnancy (Huang et al., 2024). IGF‑1 has an important role in up-regulating protein synthesis and maintaining muscle mass, with low serum levels possibly reflecting nutritional insufficiency and tissue catabolism (Livingstone, 2013). During periods of fasting, for example, serum IGF‑1 levels decrease (by nearly fourfold), increasing with nutritional repletion (Keller, 2019). Some investigators suggest that serum IGF‑1 is more sensitive and specific biomarker of protein-energy nutritional status than prealbumin, transferrin and retinol binding protein (Livingstone, 2013). Nevertheless, many factors other than nutritional status affect serum IGF‑1 and reduce its specificity. Of these summarized in Table 16b.5, the most notable is the acute phase response. Consequently, in patients who have an active systemic inflammatory response, serum IGF‑1 has limited use. Table 16b.5 summarizes the other factors influencing serum IGF‑1 concentrations; see Livingstone (2013) for more details.| Factor | Effect on serum IGF-1 |
|---|---|
| Genes | Unchanged or Increase or Decrease |
| Age | Increases until 20y then decreases until 50y. |
| Pregnancy | Increases as pregnancy progresses |
| Malnutrition | Decreases |
| Obesity | Unchanged, increases or decreases |
| Zinc deficiency | Decreases |
| Chronic wasting conditions | Decreases |
| Catabolic conditions | Decreases |
| Severe liver disease | Decreases |
| Chronic kidney disease | Decreases or Unchanged |
| Hypothyroidism | Decreases |
| GH deficiency | Decreases |
| Acromegaly | Increases |
16b.1.7 Plasma amino acids
Plasma amino acids concentrations reflect a complex pathway influenced by many factors including protein intake, amino acid oxidation, tissue breakdown, and protein synthesis. As a result, there is significant variability in plasma amino acid concentrations between individuals (Schanler & Garza, 1987; Wu et al., 1986), making them an insensitive marker of protein status (Rigo & Senterre, 1987). In early studies, Ozalp et al. (1972) investigated changes in plasma amino acid concentrations in healthy adults fed a series of diets deficient in essential amino acids. They noted a 30% decrease in fasting plasma concentrations for some amino acids (phenylalanine, lysine, isoleucine, and leucine) over the 12d study, whereas other amino acid levels (threonine and valine) decreased by about half within four days of the study initiation (Ozalp et al., 1972). Initially, the group hypothesized that the plasma levels of the deficient amino acids would reflect the concentration found in skeletal muscle. Even though their initial hypothesis may have been a contributing factor, their results suggested other processes may also be involved. For example, the observed differences in plasma amino acid concentrations between the fasting and fed state may reflect the role of carbohydrates on amino acid transport into the liver for protein synthesis (Ozalp et al., 1972) and the role of insulin in reducing proteolysis in adults (Souba & Pacitti, 1992). Plasma amino acid concentrations in pre-term and term infants also demonstrate large variations in response to feeding interventions involving different protein sources. For example, in infants fed formula with protein concentrations at 30g per litre, Rassin et al. (1977) noted that plasma and urine concentrations of phenylalanine and tyrosine were elevated. Plasma levels of these amino acids were even higher when the infants were fed a predominately casein-based formula (Rassin et al., 1977). In another study of very low birthweight infants, plasma amino acid concentrations on continuous enteral infusions of either breast milk or a whey-based formula (Schanler & Garza, 1987) varied and were thought to be related to amino acid profiles and bioavailability of the various feeding regimens (Schanler & Garza, 1987). Similarly, using a neonatal piglet model to represent the physiology of a human neonate, Bertolo et al. (1998) and Wykes et al. (1993) followed plasma amino acid concentrations throughout a 12h fast. They observed plasma amino acid concentrations decreased during the initial fast, but as the fast became prolonged, amino acid concentrations continued to fluctuate. Authors suggest this occurred as a result of decreased protein synthesis and increased catabolism (Bertolo et al., 1998).16b.1.8 Blood urea nitrogen/urea
Both urea and blood urea nitrogen (BUN) are endpoints of the metabolism of dietary protein and tissue turnover. Measured urea levels reflect the whole urea molecule whereas BUN only reports the nitrogen content of urea. As nitrogen comprises about 50% of the urea molecule, BUN levels are roughly half that of measured urea. Nitrogen utilization occurs very rapidly following enteral or parenteral nitrogen intake whereas the overall urea pool is slow to change (7‑10 turnover time). This means urea/BUN can be used as biomarkers of protein intake in clinical practice although they must be interpreted cautiously with short term interventions . Additionally, serum urea/BUN levels may be impacted by fluid status. For example, levels may be artificially elevated in a dehydrated state or artificially lowered with high intravenous fluid administration and/or hypervolemia (i.e., fluid overload). Urea is commonly used as a biomarker in neonates admitted to neonatal intensive care units (NICU). A positive correlation between protein intake and BUN has been observed in several studies of preterm infants (Mathes et al., 2018; Sanchez-Holgado et al., 2024). In clinically stable enterally fed preterm infants, a BUN value lower than 1.6mmol/L (4.48 mg/dL) indicates insufficient protein intake and is used to guide the use of human milk fortifiers. Periodic determinations of BUN are recommended by the European Milk Bank Association to guide individualized fortification of human breast milk in very low birth weight infants (Arslanoglu et al., 2019). One fortification strategy endorsed is called Adjustable Fortification (AF) and recommends adjusting protein intake based on measured BUN. For example, if BUN levels are <10 mg/dL then protein intake should be increased, whereas when BUN levels are >10mg/dL and inadequate growth is observed, then non-protein calories should be increased with no change to protein intake. In contrast, with BUN >16mg/dL and adequate growth, a decrease in protein intake should be considered (Arslanoglu et al., 2006; Arslanoglu et al., 2019). Sanchez-Holgado et al. (2024) recently examined the effect of this fortification strategy compared to targeted breast milk fortification. The latter is based on adjusting fortification/intake based on analysis of breast milk composition instead of BUN measurements. Protein intake was overall higher with Adjustable Fortification but growth parameters did not differ between the two strategies.16b.1.9 Immunological biomarkers
Consistent changes in immunological responses have been observed during protein-energy malnutrition which have been reversed with nutritional repletion (Lesourd & Mazari, 1997; Roebothan & Chandra, 1994). As a result, measurements of immunocompetence may be useful markers of functional protein-energy status. However, many non-nutritional factors (infections, illnesses, major burns, medications, surgery, emotional and physical stress) influence the immune response in the absence of protein-energy malnutrition . Therefore, to correctly interpret the results of immunological measurements, the results should always be interpreted in conjunction with other biomarkers of protein status. Although no single test can measure the adequacy of the immune response, the most frequently used tests are discussed below: Lymphocyte count. Lymphocytes are small cells that circulate between blood and lymphoid tissues and are derived from hematopoietic stem cells in the bone marrow. Lymphocytes are the primary cells of the acquired immune system and comprise 20‑40% of the total white blood cells (WBCs). A decrease in total lymphocytes, often to less than 1500/mm3 (reference range 2000‑3500 cells/mm3) can be supporting evidence of severe protein-energy malnutrition in the absence of any other hematological abnormalities (Shenkin et al., 1996; Keller, 2019). Even in mildly undernourished elderly, the total lymphocyte count is often reduced compared with data for both healthy elderly and young adults (Lesourd, 1995). Nevertheless, lymphocyte count is a very insensitive biomarker, responding slowly to correction of nutritional status (Shenkin et al., 1996). In clinical laboratories the lymphocyte count (and total white cell count) are determined automatically using an electronic particle counter (e.g., Coulter Counter). These counters discriminate cells based on their induced resistance as they pass through an electrical potential. Thymus-dependent lymphocytes. Approximately 75‑80% of the circulating lymphocytes are T‑cells which affect destruction of virus-infected cells, bacteria, and some malignant cells. During severe protein-energy malnutrition, both the proportion and absolute number of T‑cells in the peripheral blood may be reduced (Keusch, 1990). This low proliferation of T‑cells has been attributed in part to alterations in monokine metabolism, particularly decreased activity of interleukin‑1 (Bhaskaram & Sivakumar, 1986; Hoffman-Goetz & Kluger, 1979a; 1979b). In most cases, these changes can be rapidly reversed with nutritional therapy. Hence, sequential measurements of T‑cell numbers can provide an index of the effect of a nutrition intervention and monitor nutritional recovery in malnourished patients. Measurement of T‑cells is performed by flow cytometry. Isolated immune cells are stained in suspension with fluorescently tagged antibodies to identify cells of interest prior to analysis through a flow cytometer; for more details, see Manhas & Blattman (2023). Delayed cutaneous hypersensitivity (DCH). This is used as a direct measure of T‑cell-mediated immunity in response to an antigen that is observed on the skin. When healthy persons are re-exposed to recall antigens intradermally, the T‑cells respond by proliferation and then by the release of soluble mediators of inflammation. This produces an induration (hardening) and erythema (redness). These skin reactions are often reduced in malnourished persons, although the response is non-specific and occurs with marasmus or kwashiorkor and with micronutrient deficiencies such as vitamin A, zinc, iron, and pyridoxine. The reactions are reversed, however, after appropriate nutritional rehabilitation. Several other diseases and drugs also influence DCH, so it is a poor measure of protein malnutrition, especially in sick patients. Box 16b.3 summarizes the non-nutritional factors that affect the DCH response, and thus reduce the specificity of the test.
Box 16b.3 Non-nutritional factors affecting the delayed
cutaneous hypersensitivity (DCH) response.
For this test, generally a panel of 4‑5 antigens are injected
intradermally, often into the forearm. The area of induration is
measured after 48h, with a positive result being taken as an area of
induration of at least 0.5cm. Lack of response to all antigens is
called anergy. A cell mediated immunity test kit for measuring DCH is
available which is preloaded with standardized doses of seven antigens
(Tuberculin, Tetanus toxoid, Diphtheria toxoid, Streptococus, Candida,
Tricophyton and Proteus) in glycerol solution and a glycerin control.
Use of seven antigens reduces the number of false negatives and
increases the sensitivity of the test. Use of this kit eliminates some
of the methodological problems associated with the traditional skin
testing method.
- infections — sepsis as a result of viral, bacterial, and granulomatous infections can suppress normal DCH.
- Metabolic disorders — uremia, cirrhosis, hepatitis, inflammatory bowel diseases, and sarcoidosis suppress normal DCH.
- Malignant diseases — most solid tumors, leukemias, lymphomas, chemotherapy, and radiotherapy impair DCH.
- Medications — corticosteroids, immunosuppressants, cimetidine, coumarin, warfarin, and possibly aspirin may influence DCH.
- Surgery and anesthesia — can alter DCH.
- Patient factors — age, race, geographic location, prior exposure to antigen, circadian rhythm, and psychological state may all affect DCH.
16b.2 Assessment of muscle mass based on technology
Muscle is a major component of the fat-free mass and the primary site for glucose uptake and storage as well as a reservoir of amino acids stored as protein, as noted earlier. assessment of muscle mass can therefore provide an index of the protein reserves of the body, which can be metabolized during prolonged periods of negative nitrogen balance, leading to loss of muscle. Indeed, loss of muscle mass is now an important diagnostic criterion for the definition of protein malnutrition by the Academy of Nutrition and Dietetics (AND)/American Society for Parenteral and Enteral Nutrition (ASPEN) (Cederholm et al., 2019). Muscle wasting characterizes the marasmic form of protein-energy malnutrition. In children with the marasmic form of protein-energy malnutrition, depleted muscle mass increases the risk of mortality during infections (Briend et al., 2015). In the elderly, loss of muscle mass is a defining characteristic of sarcopenia (defined as loss of muscle mass as well as strength). Sarcopenia often occurs in the face of chronic and acute illness and may be associated with several negative outcomes, including falls, fractures, and mobility disorders, cognitive impairments, and mortality (Cruz-Jentoft et al., 2019). The consensus report by the Global Leadership Initiative on Malnutrition (GLIM) endorsed methods such as dual-energy absorptiometry (DXA), bioelectrical impedance (BIA), ultrasound, computed tomography (CT), or magnetic resonance imaging as validated measures of body composition. However, the advantages and limitations of each technique vary, and must be considered prior to selecting the appropriate method. For more details of each of these methods, see Chapter 14: Body composition: Laboratory Methods Recommendations to support the use of these technological methods for the assessment of muscle mass in clinical patients are inconsistent across expert groups. For example, DXA has been endorsed for body composition assessment by the GLIM Body composition Working Group, and European and Asian sarcopenia working groups (Prado et al.,2022), even though DXA does not measure muscle mass directly. Instead, DXA measures lean soft tissue mass, which includes muscle mass and other tissues and organs. In contrast, the ASPEN does not support the use of DXA for the assessment of lean soft tissue mass in patients with a variety of disease state. Sheean et al. (2020) in their systematic review, found no reports exploring the validity of DXA for lean mass assessment in clinical populations. Furthermore, consistent associations between DXA measures of lean soft tissue and adverse outcomes in older adults have not been reported (Bhasin et al., 2020). Both ultrasound and BIA are available as portable measurement devices so their use in both community and clinical settings for muscle mass assessment is increasing. Currently the diverse technology across the commercially available devices for ultrasound and BIA makes it difficult to compare results across studies (Lee et al., 2020). Diagnostic ultrasound, also called sonography, is an imaging technique used to measure various tissue thicknesses, including muscle, bone, and subcutaneous and visceral adipose tissue. The device is low cost, and capable of making fast and noninvasive regional estimates of body composition with no exposure to ionizing radiation. In the ASPEN systematic review, only three of the seven ultrasound studies included compared muscle thickness and cross-sectional area against lean mass by DXA so no recommendation could be made to support the use of ultrasound in the clinical setting for muscle mass assessment (Sheean et al., 2020). More research is needed to develop a standardized protocol for ultrasound measurements, and to generate population-specific reference data as well as cut-off values to identify low muscle mass, before ultrasound gains widespread use for assessing muscle mass and diagnosing malnutrition in clinical (Earthman, 2015) and community (Prado et al., 2022) settings. Challenges also exist in using ultrasound to measure muscle parameters in individuals with obesity or edema (Stock & Thompson, 2021). Bioelectrical impedance analysis measures the electrical conductivity of a weak alternating current at one or more frequencies passed between two electrodes attached to the body in various locations. The current flows at various rates depending on the composition of the body. The current is well conducted by tissues with a high water and electrolyte content such as lean tissues but is poorly conducted by adipose tissue and bone which have a low water and electrolyte content. The drop in voltage as the current passes through the body (i.e., impedance) is detected through the current sensing surface electrodes, and the impedance data (i.e., resistance, R; reactance, X; impedance, Z; and phase angle, PA) are recorded by the BIA device. From the data generated, estimates of fat-free mass and total body water can be made. BIA has gained widespread use in both community and clinical settings because it is a low cost, portable, and noninvasive tool with minimal risks. These features render BIA an ideal method for follow-up studies. However, the accuracy of the estimates of fat-free mass is often compromised in clinical populations who may have alterations in body water or abnormalities in body geometry. See Kyle et al. (2004) for more details of the theory of BIA. Each BIA device works with an inbuilt algorithm specific to the device and for the population for which the algorithm was developed so it is not possible to compare studies unless the same combination of device / equation / population is used (Ward, 2019; Sheean, 2020). Furthermore, the reference population on which the BIA algorithm was based must be appropriate for the target subject being measured (Lemos & Gallagher, 2017). The BIA algorithms applied are based on or validated against other body composition reference methods (e.g., multiple dilution, DXA, and CT). However, none of these reference methods are totally accurate and error-free. Many factors may influence the precision and accuracy of BIA techniques. They include factors associated both with the individual (e.g., degree of adiposity, fluid and electrolyte status, skin temperature) and with the environment (ambient temperature, proximity to metal surfaces and electronic devices), the assumptions underlying prediction or modeling equations, instrumentation, and variations in the protocols used for the BIA measurements. For more discussion of these factors, see Section 14.8 in Chapter 14. Interestingly, the ASPEN does not support the use of BIA for the assessment of body composition in the clinical setting, based on their systematic review of 23 BIA studies. Their main objections included the scarcity of data on the validity of BIA in specific clinical populations, difficulties comparing studies using different BIA devices, variability in the body compartments estimated, and the proprietary nature of manufacture-specific BIA regression models to procure body composition data. For a summary and discussion of the studies reviewed which led to this conclusion, see Sheean et al. (2020). The questionable validity of BIA approaches for the assessment of whole body composition estimates in clinical populations, especially those with abnormal body geometry or altered fluid homeostasis, has led to the use of raw BIA measurements per se for bedside assessment of nutritional status and/or clinical outcomes. Raw BIA measurements do not depend on equations or models, thus eliminating bias and are available from any single frequency BIA device. From the raw BIA measurements generated, phase angle can be estimated, now known to be a surrogate of both the quantity and quality of lean muscle mass (Sheean et al., 2020).16b2.1 Bioelectrical impedance analysis (BIA) - derived phase angle
The derived phase angle (PA) is a specific non-invasive measurement obtained directly from a phase-sensitive BIA device. The phase angle concept is based on changes in resistance and reactance as low-level alternating currents pass through evaluated tissues, providing information on hydration status and body cell mass. As such, phase angle is being used as a marker of abnormal body composition and low muscle strength. The phase angle is also sensitive to changes over time and hence could be useful in the evaluation of different treatments. Phase angle is obtained directly from the raw parameters, resistance, R and reactance, X and is calculated using the following equation (Mulasi et al., 2015). \[\small \mbox { PA (degrees) = arctan (Reactance/Resistance) × (180 degrees/π )}\] Where arctan =arctangent; Reactance, X represents the health and integrity of cells and reflects how much of the current is stored in cell membranes; Resistance R indicates how easily the electric current flows through body fluids and is determined primarily by the amount of water and electrolytes in the body. Bellido et al. (2023) provide an extensive review of the clinical applications of phase angle assessment. For example, a lower phase angle can indicate compromised cellular health and may be associated with malnutrition and sarcopenia in the elderly. A systematic review has confirmed that phase angle is decreased in sarcopenic subjects, with a higher prevalence of sarcopenia reported in those with low phase angle (Di Vincenzo et al., 2021). In several other studies, the accuracy of phase angle to detect sarcopenia has also been good, with lower phase angle scores associated with reduced muscle mass and poor muscle function measured by BIA and handgrip strength, respectively (Gonzalez et al., 2018; Akamatsu et al., 2022). These observations have led the EWGSOP 2019 consensus on sarcopenia to suggect that phase angle could be regarded as an index of overall muscle quality (Cruz-Jentoft et al., 2019). Phase angle has also been used to predict protein-energy wasting and all-cause mortality in older patients undergoing hemodialysis (Kojima e al., 2024). Typically, low phase angle values are related to more-severe illnesses and worse overall health outcomes. Factors affecting phase angle Age-related changes in phase angle are relatively marked. Phase angle values peak during early adulthood and then gradually decline as individuals age. The basis of this age-related decline is uncertain. Several factors may be involved, including loss of muscle mass and strength and physiological changes in the ratio of extracellular water (ECW) and intracellular water (ICW) with aging. Sex differences in phase angle exist, with women having lower values due to a lower muscle mass. Body mass index (BMI) influences phase angle. In adults, values increase proportionally with BMI depending on the BMI range. See Bellido et al. (2023) for more details. Ethnicity/race affects phase angle values. In the US NHANES (1999‑2004) survey data, Hispanic and African Americans had larger phase angle values than Caucasians. Hence, ethnicity/race should be considered when evaluating phase angle values (Kuchnia et al., 2017). Alterations in fluid distribution affect phase angle values. In disease-related malnutrition there is an early shift of fluids from intracellular water (ICW) to extracellular water (ECW) space with increased ECW/ICW and a concomitant decrease in body cell mass. Both factors contribute to the lower phase angle values (Gonzalez et al., 2016). Interpretive criteria Several countries have generated normative reference values for phase angle measured by BIA based on population samples; details are given below. Notable differences in phase angle normative reference values across countries have been observed, some of which may be related to ethnicity-specific differences in relative leg length, frame size, and body build. Such differences may also be contributed in part by the devices used and/or lack of adequate standardization of the phase angle measurement technique. Hence, standardized population-specific reference data may be necessary. In general, values for phase angle in a healthy population are reported to range from 5‑8°, with a decrease with increasing age, older adults having values between 4‑6°. U.S. reference data for phase angle by race and sex were compiled by Kuchnia et al. (2017) for non-pregnant individuals aged 8‑49y. Data were generated by Bioelectrical Impedance Spectroscopy (BIS) from participants in the U.S NHANES 1999‑2004 surveys (Table 16b.6.)| Males | Females | ||
|---|---|---|---|
| Race- Ethnicity | PA (50 kHz) | PA (50 kHz) | |
| White | 7.36 ± 0.71 | 6.30 ± 0.67 | |
| Black | 7.55 ± 0.78 | 6.61 ± 0.73 | |
| Hispanic | 7.58 ± 0.68 | 6.54 ± 0.70 | |
| Other | 7.37 ± 0.76 | 6.30 ± 0.59 |
| Ethnicity | 18–19y | 20–29y | 30–39y | 40–49y |
|---|---|---|---|---|
| Hispanic/black | 6.42 | 6.47 | 6.68 | 6.13 |
| Men (n) | 441 | 477 | 404 | 465 |
| BMI | 24.4 ± 5.1 | 26.5 ± 5.2 | 27.8 ± 4.7 | 28.1 ± 4.8 |
| White/other | 6.35 | 6.30 | 6.32 | 6.08 |
| Men (n) | 213 | 423 | 405 | 407 |
| BMI | 24.6 ± 4.6 | 25.8 ± 4.7 | 27.0 ± 4.6 | 27.9 ± 4.6 |
| Hispanic/black | 5.43 | 5.52 | 5.60 | 5.37 |
| Women (n) | 412 | 404 | 370 | 485 |
| BMI | 26.0 ± 6.6 | 28.1 ± 6.9 | 29.7 ± 6.8 | 30.9 ± 6.4 |
| White/other | 5.29 | 5.47 | 5.38 | 5.11 |
| Women (n) | 172 | 350 | 403 | 406 |
| BMI | 24.9 ± 6.2 | 26.0 ± 6.5 | 27.0 ± 6.9 | 27.4 ± 6.5 |
| Sex Age | AUC | 95% CI | Cut-off (°) | Sensitivity (%) | Specificity (%) |
|---|---|---|---|---|---|
| Male Young | 0.882 | 0.796–0.967 | 5.95 | 100.0 | 71.8 |
| Male Elderly | 0.838 | 0.516–1.160 | 5.04 | 100.0 | 67.6 |
| Female Young | 0.865 | 0.804–0.926 | 5.02 | 100.0 | 79.4 |
| Female Elderly | 0.850 | 0.674–1.026 | 4.20 | 80.0 | 87.0 |
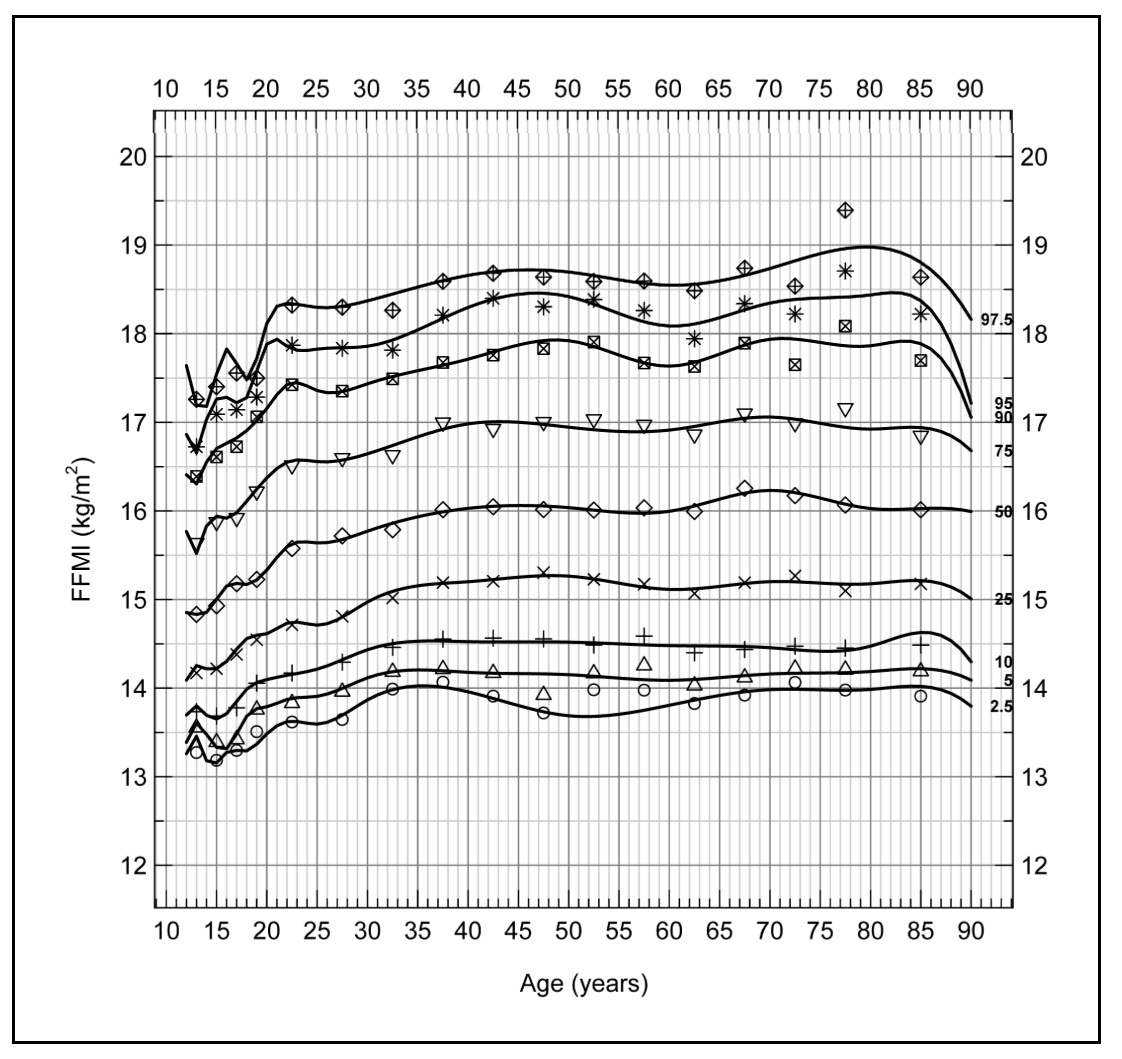
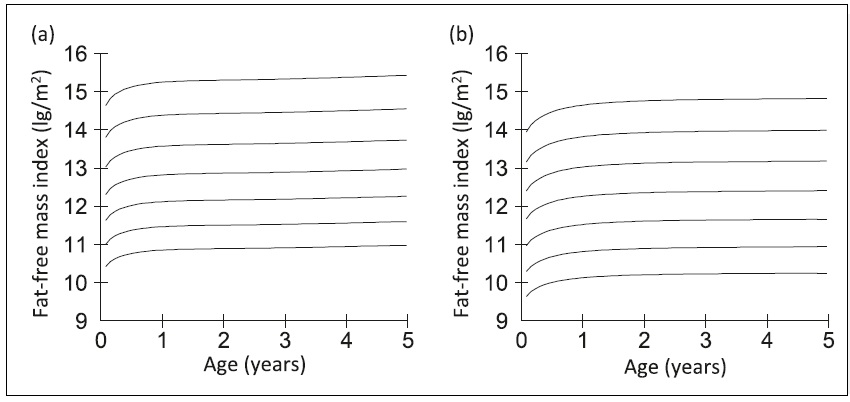
16b.2.2 Fat-free mass index
Use of a fat-free mass (FFM) index has been explored in place of fat-free mass alone to overcome the confounding effect of variation in stature on fat-free mass. Stature reportedly explains 45% of the variance in FFM and 2% of the variance in fat mass (Van Itallie et al., 1990). Hence, the fat-free mass index (FFMI) assesses the amount of muscle mass relative to a person's height. It is calculated by dividing fat-free mass (FFM) in kilograms by height in meters squared. Fat-free mass index is used to evaluate nutritional status among patients with chronic illnesses or those undergoing treatments that may affect muscle mass, such as cancer or chronic obstructive pulmonary disease (COPD). For example, Zhang et al. (2021) reported low FFMI was associated with a worse prognosis even among cancer patients with a normal/high BMI, emphasizing the prognostic value of FFMI in these patients. Fat-free mass index is also used to diagnose sarcopenia in the elderly, and to evaluate the efficacy of treatment such as exercise programs or medications aimed at improving muscle mass (Cruz-Jentoft et al., 2019). Based on these findings, the GLIM have recommended the inclusion of FFMI in their diagnostic criteria of malnutrition for use for all patients and in all clinical settings (Cederholm et al., 2019). The use of FFMI has also been explored in studies of undernutrition in children in low-income countries (Fabiansen et al., 2017; Wells, 2019). To date, however, challenges remain when applying FFMI to assess nutritional status in these children. Undernutrition in children often coexists with edema, so depending on the method used to measure body composition, some of the assumptions applied to convert raw data into body composition values may have been violated due to altered hydration (see Chapter 14. Section 14.8 for these assumptions). Increasingly in the future, BIVA may be employed to differentiate between children who are dehydrated and those with edema, as discussed earlier. An additional challenge limiting the use of FFMI in children has been the absence of normative reference values and cut-off points that can be used to identify malnutrition. Current data indicate that universal reference data for FFMI may not be feasible, and instead population specific reference data may be required. Furthermore, any comparison with the reference values should be made using the same body composition measurement technique as that used to assess body composition in the child under study (Wells, 2014). Interpretive criteria for fat-free mass index| BMI (kg/m2) | FFMI (kg/m2) | BFMI (kg/m2) | BF (%) |
|---|---|---|---|
| Men (n = 2982) | |||
| 30.0 | 21.7 | 8.3 | 28.8 |
| 27.8 | 20.9 | 6.9 | 25.8 |
| 25.0 | 19.8 | 5.2 | 21.7 |
| 20.0 | 17.5 | 2.5 | 13.4 |
| 18.5 | 16.7 | 1.8 | 10.8 |
| Women (n = 2647) | |||
| 30.0 | 18.2 | 11.8 | 40.0 |
| 27.3 | 17.5 | 9.8 | 36.5 |
| 25.0 | 16.8 | 8.2 | 33.2 |
| 20.0 | 15.1 | 4.9 | 24.6 |
| 18.5 | 14.6 | 3.9 | 21.7 |
16b.3 Assessment of muscle mass using anthropometry
The technology-based methods described above are not always available in resource-poor settings. Consequently, the GLIM have acknowledged the use of selected non-invasive anthropometric measurements as alternative proxy measures of muscle mass in both community and clinical settings, complemented, where possible, with hand grip strength as a proxy measure of muscle strength (see Section 16b.5) (Cederholm et al., 2019). The anthropometric measurements selected include mid-upper arm circumference (MUAC), either alone (Hu et al., 2021), or in combination with triceps skinfold thickness (i.e., arm-muscle circumference and arm-muscle area), together with calf circumference. All of these measurements have been shown to correlate with muscle mass assessed by in vivo laboratory-based methods such as BIA (Hu et al., 2021), DXA, or CT (Heymsfield et al., 1982; Carnevale et al., 2018). As a result, they are used to predict changes in protein status in resource-poor settings, provided the changes are not small; they are discussed below.16b.3.1 Mid-upper arm circumference
Mid-upper arm circumference (MUAC) has been used in low-income countries to identify protein-energy malnutrition and to monitor progress during nutritional therapy. In low-income countries the amount of subcutaneous fat in the upper arm is often small, so changes in MUAC tend to parallel changes in muscle mass. As changes in MUAC are easy to detect and require a minimal amount of time and equipment, they are often used for screening for protein-energy malnutrition in emergencies such as famines and refugee crises. In these situations, measurement of weight and height may not be feasible, and ages of the children are often uncertain (de Onis et al., 1997). In addition, use of a weight-based nutritional assessment (e.g., WLZ) can be misleading in children with severe acute protein-energy malnutrition (SAM) who frequently have diarrheal disease accompanied by dehydration, which lowers the weight of a child. For example, Modi et al. (2015) showed that MUAC outperformed weight-for-length-score <−3 to identify SAM in children from Bangladesh aged 6‑60mo with diarrhea. In such cases, a fixed cutoff point (e.g., 11.5cm) has been used to distinguish normal and children with protein-energy malnutrition and diarrhea. The use of fixed cutoffs to distinguish normal and malnourished children assumes that MUAC is relatively independent of age. However, the age independence of MUAC has been questioned (Hall et al., 1993; Bern & Nathanail, 1995; WHO, 1995) and has led to the use of MUAC Z‑scores, that adjust for age and sex differences (Houssain et al., 2017). However, some investigators have concluded that the additional estimation of age, required when using MUAC-for-age Z‑score was not justified, especially in humanitarian settings. They urged the need for further research on morbidity and mortality of children with low MUAC-for-age Z‑scores (Leidman et al. 2019). A major application of MUAC in older adults is as a surrogate for appendicular skeletal muscle mass, and the subsequent detection of sarcopenia (Pinheiro et al., 2020; Hu et al., 2021) as well as a reliable predictor of protein-energy malnutrition in hospitalized frail older adults (Sanson et al., 2018). MUAC is recommended because its measurement is less affected by fluid retention compared to the lower extremities, a condition that often occurs in older adults. Sarcopenia is characterized by decreases in muscle mass, as well as strength and function, all of which have multiple adverse health consequences. Interpretive criteria and measurement of mid-upper arm circumference WHO (2009) recommends a MUAC cutoff of <115mm to diagnose children aged 6‑60mo with severe acute malnutrition (SAM), together with the presence of bilateral pitting edema, where possible. This MUAC cutoff was chosen because children with a MUAC less than 115mm were observed to have a highly elevated risk of death compared to those with a MUAC above 115mm (Myatt et al., 2006). Following treatment, the WHO discharge criteria recommended for children with SAM are a MUAC cutoff of >125mm and no edema for at least 2wks (WHO, 2009). To avoid any relapse, children with SAM who have been discharged from treatment should be monitored periodically. Provision to mothers of MUAC tapes with a cut-off value of 115mm have been used in an effort to detect malnutrition early before the onset of complications, and thus reduce the need for inpatient treatment (Blackwell et al., 2015). The U.S Academy of Nutrition and Dietetics (AND) and the American Society for Parenteral and Enteral Nutrition (ASPEN) also recommends MUAC cutoffs to classify bedbound children aged 6‑60mos with undernutrition when measurements of weight and length or height are not feasible. For children classified with severe protein-energy malnutrition, a MUAC cutoff <115mm is also recommended, for moderately malnourished children, a MUAC cutoff of 115‑124mm, and for children at risk of protein-energy malnutrition, a MUAC cutoff of 125‑134mm (Becker et al., 2014). Currently, there is no consensus on the MUAC cutoff to predict low muscle mass and diagnose undernutrition in adults. WHO has proposed universal cutoff values for MUAC of 22cm for females and 23cm for males to screen for undernutrition (WHO, 1995). However, reginal and ethnic differences in MUAC exist, and a higher MUAC cutoff (23.5cm) has been used to screen for underweight in women of reproductive age in northern Vietnam. If the lower WHO cutoff (22cm) had been used, many women at risk for undernutrition would have been misclassified as healthy. Cutoffs for MUAC to predict low muscle mass and identify sarcopenia in adults have also been investigated. In a study of community-dwelling Chinese adults >50y, Hu et al. (2021) recommended MUAC cutoffs of <28.6cm for men and <27.5cm for women for predicting low muscle mass, and <27cm for both sexes to identify sarcopenia. This cutoff was developed based on low muscle mass diagnosed using the European Working Group on Sarcopenia in Older People 2 (EWGSOP2) criteria. Whether these MUAC cutoffs for adults are applicable for other race-ethnic groups warrants investigation. WHO has developed MUAC-for-age reference data (Z‑scores and percentiles by sex) for children aged 3‑60mo for international use. The curves show both age-specific and sex-specific differences for boys and girls aged <24mos. Numerical Z‑score tables and charts for boys are also available. Details on the measurement of MUAC can be found in Section 11.2.1 of Chapter 11.16b.3.2 Mid-upper arm muscle circumference
Mid-upper arm muscle circumference (MUAMC) has been used in the past as a proxy for total body muscle mass and to diagnose protein-energy malnutrition in community surveys in resource-poor setting (Jelliffe, 1966). Strong correlations between calculated values for MUAMC and fat-free mass estimates based on reference in vivo methods, such DXA Carnevale et al., 2018) and computed tomography (Lambell et al., 2021), have also led to the use of MUAMC as a proxy for muscle mass in the elderly (Akin et al., 2015; Landi et al., 2010) when using these more direct in vivo methods are not feasible (Gort-van Dijk et al., 2021). Nevertheless, it is important to realize that the MUAMC is a one-dimensional measurement, whereas MUAMA is two-dimensional, and mid-upper-arm-muscle volume is three dimensional. Consequently, if the volume of the mid-upper-arm muscle declines during protein-energy malnutrition or enlarges following a program of nutritional support, the MUAMC change will be proportionally smaller than the change in the mid-upper-arm muscle area (Heymsfield et al., 1982). Hence, MUAMC is insensitive to small changes of muscle mass that might occur, for example, during a brief illness. Interpretive criteria and measurement of mid-upper-arm-muscle circumference Mid-arm-muscle circumference is the calculated circumference of the inner circle of muscle surrounding a small central core of bone (Gurney & Jelliffe, 1973). The muscle circumference of the mid-upper arm is derived from measurements of both the MUAC and triceps skinfold thickness. For details on the measurement of triceps skinfold thickness, see Section 11.1.2 of Chapter 11. The equation for the calculation of MUAMC is based on the same assumptions as those described for mid-upper-arm fat area (see Chapter 11, Section 11.1.4). As variations in skinfold compressibility are ignored and as the triceps skinfold of females is generally more compressible than that of males, female MUAMC may be underestimated. As a further complication, the MUAMC equation does not take into account between subject variation in the diameter of the humerus relative to MUAC (Frisancho, 1981). If MUAC = mid-upper-arm circumference, TSK = triceps skinfold,d1 = arm diameter, and d2 = muscle diameter. Then:
TSK = 2 × subcutaneous fat (d1 - d2)
and MUAC = π × d1.
MUAMC = π × d2 = π × [d1 - (d1 - d2)]
= π × d1 - π × (d1 - d2).
Hence MUAMC = MUAC - (π × TSK)
Where MUAMC =
mid-upper-arm-muscle circumference, MUAC = mid-upper-arm circumference,
and TSK = triceps skinfold thickness. Note that this equation is only
valid when all measurements are in the same units (preferably mm).
There are no reference ranges for MUAMC for children based on
the WHO Multicentre Child Growth Study or for the U.S. children used to
compile the CDC 2000 BMI growth charts
(Kuczmarski et al., 2000a).
Some population-specific reference data based on calculated MUAMC
are available for Argentinian children aged 4‑14y
(Oyhenart et al., 2019a).
Kuczmarski et al.
(2000b)
compiled MUAMC reference data for
adults from the U.S. NHANES III survey (1988‑1994), but only for those
adults >50y. Mean (SE) and selected percentile values of males and
females for four age groups are available. During this time, values for
MUAMC increased up to age 65y in women and up to middle age in men and
then steadily decreased. However, secular-related changes in MUAC and
triceps skinfold thickness have been reported in U.S. males and females,
so caution must be used when comparing more recent MUAMC data with these
earlier MUAMC reference data for U.S. adults
(Frisancho, 1990).
and MUAC = π × d1.
MUAMC = π × d2 = π × [d1 - (d1 - d2)]
= π × d1 - π × (d1 - d2).
Hence MUAMC = MUAC - (π × TSK)
16b.3.3 Mid-upper-arm-muscle area
Mid-upper-arm-muscle area (AMA) is said to be preferable to mid-upper-arm-muscle circumfer-ence as an index of total body muscle mass because it more adequately reflects the true magnitude of muscle tissue changes (Frisancho, 1981). Several studies have examined the validity of mid-upper-arm-muscle area by comparison with in vivo body composition reference methods such as magnetic resonance imaging (MRI), computer tomography (CT), bioelectrical impedance (BIA), and DXA. Unfortunately, the validity of the calculated mid-upper-arm-muscle area (AMA) as a proxy for actual arm-muscle mass is dependent on the characteristics of the study population and the in vivo reference method used. For example, the traditional equation appears to overestimate AMA in obese patients and may not be appropriate for undernourished children (Heymsfield et al., 1982; Rolland-Cachera et al., 1997). Despite these limitations, calculated AMA as a proxy for arm-muscle mass has been used by several investigators. Pinto et al. (2021), reported that AMA, like MUAMC, was linked with length of hospital stay. In Caucasian adult patients with AMA values lower than the 5th percentile (i.e., indicative of depletion), the probability of being discharged from the hospital was lower. However, this finding has not been consistent in all studies (Luis et al., 2013). AMA has also served as an early indicator of deteriorating nutritional status in a longitudinal study of pediatric patients with cystic fibrosis (Ellemunter et al., 2021). Interpretive criteria and measurement of mi-upper-arm-muscle area The following equation may be used to estimate mid-upper-arm-muscle area (AMA): \[ \small \mbox{Arm muscle area} = \mbox{(MUAC − (π × TSK))}^{2}\mbox{/4π}\] where MUAC = mid-upper-arm circumference and TSK = triceps skinfold thickness (Frisancho, 1981). Consistent units, preferably mm, should be used throughout. Age and sex-specific smoothed percentiles for AMA based on the same population of healthy U.S. children aged 1‑20y used to construct the CDC 2000 BMI charts (Kuczmarski et al., 2000a) and the 2010 skinfold thickness percentiles of Addo and Himes (2010) are shown in Figure 16b.4 (Addo et al., 2017). The authors also provide the necessary least mean squares coefficients to calculate Z‑scores; see Addo et al. (2017) for more details.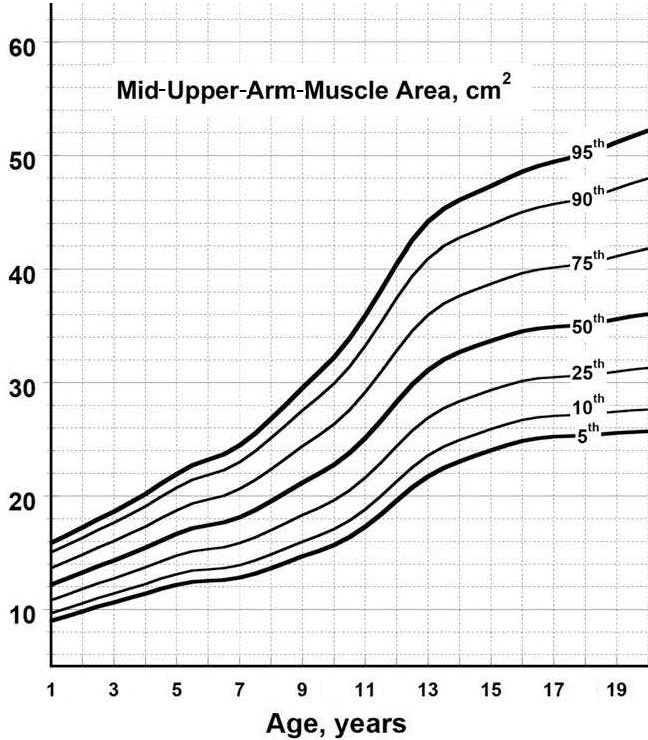
16b.3.4 Calf circumference
Calf circumference is often used as a surrogate marker of skeletal muscle mass when body composition techniques are not available. The measurement is simple and practical and has been reported as the most used measurement in clinical practice to assess muscle mass, based on an international survey in 55 countries (Bruyere et al.,2016). Calf circumference has the added advantage of having a lower fat mass compared to other body sites. As a result, the impact of fat mass on the measurements will be less (Bahat, 2021). The use of calf circumference as a proxy for muscle mass to identify older adults with or at risk for sarcopenia is supported by both the Asian Working Group for Sarcopenia (AWGS) (Chen et al., 2020) and the European Working Group on Sarcopenia in Older People (EWGSOP) (Cruz-Jentoft et al., 2019), especially for use in settings where no other muscle mass diagnostic methods are available. Several investigators have compared the performance of calf circumference as an indirect anthropometric marker of appendicular skeletal muscle mass against in vivo reference methods. Most of these studies have been on the elderly and have reported moderate to good correlations of calf circumference against direct measurements of skeletal muscle mass using reference methods such as DXA (Kawakami et al., 2015) and BIA (Gonzalez-Correa et al., 2020). However, whether changes in calf circumference can be used as a valid proxy for changes in muscle mass for hospitalized patients remains uncertain (Hansen et al., 2024). Factors affecting calf circumference Age has little effect on calf circumference in adult males and females until age 60y, after which calf circumference decreases slowly with age, irrespective of ethnicity or race. These age-related trends in calf circumference values appear to be confounded by BMI. Sex impacts on calf circumference with males having higher values than females. Ethnicity or race differences exist due to alterations in muscularity. Such ethnic differences are confounded by BMI. Body mass index influences calf muscle values. Persons with overweight/obesity have higher calf circumference values, whereas for those with BMI<18.5, values are smaller irrespective of age, ethnicity or race. Such differences are attributed to the larger amount of adipose and intermuscular adipose tissue in the calves, limiting the usefulness of calf circumference diagnostic performance as a marker of muscle mass. However, BMI adjustment factors are available; see below (Gonzalez et al., 2021). Edema can affect the measurement and its interpretation. Ishida et al. (2019) reported that edema in the lower limb increased calf circumference by approximately 2cm. Adjustment factors for low extremity edema are available (Ishida et al. 2019). Interpretive criteria and measurement of calf circumference Normative reference values for calf circumference by sex, ethnicity and race for U.S. adults 18‑39y with a normal BMI (18.5‑24.9kg/m2) are presented in Table 16b.10 (Gonzalez et al., 2021).
| Males | Females | |||||
|---|---|---|---|---|---|---|
| n | Reference1 mean ± SD | Cutoff2 −1 SD | n | Reference1 mean ± SD | Cutoff2 −1 SD | |
|
White Non- Hispanic | 633 | 36.6 ± 2.2 | 34.4 | 656 | 35.6 ± 2.2 | 33.4 |
|
Black Non- Hispanic | 429 | 36.4 ± 2.2 | 34.2 | 279 | 35.3 ± 2.2 | 33.1 |
|
Mexican American | 428 | 34.9 ± 2.1 | 32.8 | 378 | 33.9 ± 2.3 | 31.6 |
|
Other races & ethnicities | 149 | 36.0 ± 2.1 | 33.9 | 152 | 34.6 ± 2.2 | 32.4 |
| BMI Group (kg/m2) | Total All subjects | White
Non- Hispanic | Black Non- Hispanic | Mexican- American | Other
races & ethnicities |
|---|---|---|---|---|---|
| < 18.5 | +4.3 | +4.7 | +4.2 | +4.0 | +3.4 |
| 25‑29.9 | −3.4 | −3.4 | −3.4 | −3.1 | −3.5 |
| 30‑39.9 | −6.8 | −6.7 | −7.2 | −6.4 | −6.9 |
| ≥ 40 | −12.0 | −11.9 | −12.0 | −12.1 | −12.2 |
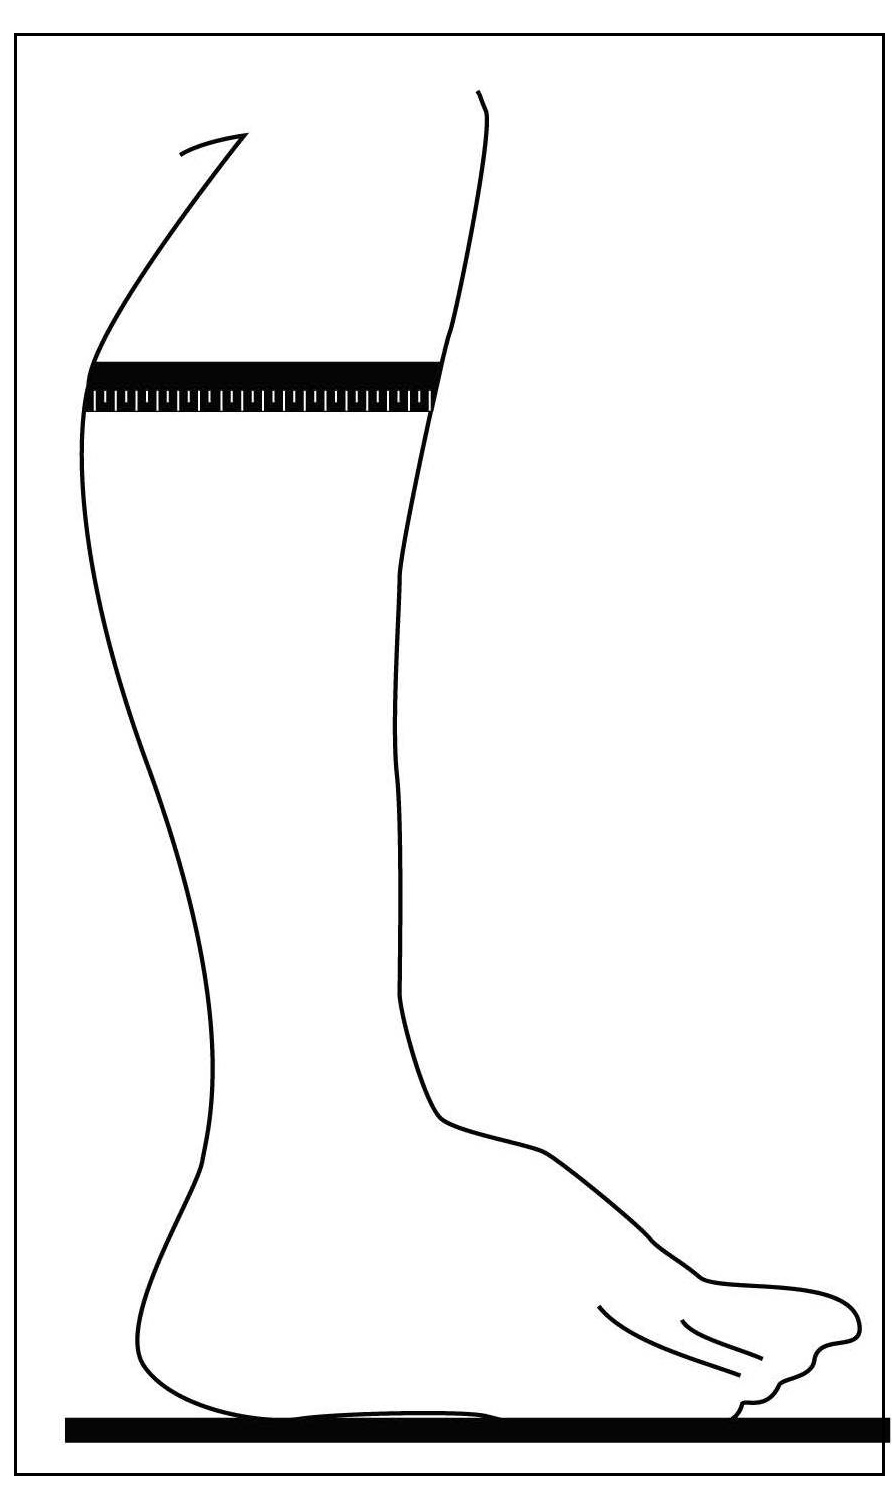
16b.4 Assessment of muscle mass using urinary metabolites
16b.4.1 Urinary creatinine
Urinary creatinine is a breakdown product of creatine phosphate, a metabolite distributed primarily in skeletal muscle, as noted earlier; (see serum creatinine Section 16b.1.5). Under the steady-state and a stable kidney function, creatinine is usually produced by the body at a relatively constant rate depending on the absolute amount of muscle mass. Several studies have investigated the relation between 24h urinary creatinine and skeletal muscle mass using reference methods to measure muscle mass. These studies led to the development of prediction equations to estimate total body muscle mass based on 24h urinary creatinine excretion (Forbes & Brunning, 1976; Wang et al., 1996). Based on regression analysis, each gram (9mmol) of creatinine in urine is derived from about 17kg skeletal muscle (Forbes & Brunning, 1976) This prediction equation was developed with total body potassium-measured lean body mass as the reference for skeletal muscle (see Chapter 14, Section 14.2). In a more recent study, the total body creatine pool was measured in subjects who ingested a gel capsule filled with the stable isotope deuterated creatine (DCR). Skeletal muscle mass was determined in these same subjects using magnetic resonance imaging (MRI) as the reference and reported to be well correlated with skeletal muscle mass measured from the stable isotope deuterated creatine using mass spectroscopy (Clark & Manini, 2010). However, several factors affect daily creatinine excretion; for more details see Box 16b.4.
Box 16b.4 Factors affecting daily creatinine excretion.
Traditionally, the creatinine height index (CHI) as a percentage has been
used to evaluate the degree of depletion of muscle mass in children with
the marasmic form of protein-energy malnutrition. In these subjects,
there will be a decrease in CHI because of loss of lean body mass to
maintain serum protein levels. Knowledge of the exact age of the child
is not required, which can be an advantage in low-income-countries. The
CHI can also be used to monitor the effects of long-term nutritional
interventions on repletion of lean body mass in hospital patients.
Changes in adipose tissue and fluid retention in these patients have no
influence on CHI. However, the CHI is not sensitive to weekly changes
in lean body mass and must be used over longer periods.
Interpretive criteria and measurement of urinary creatinine
The creatinine height index (CHI as%) is calculated as
\[\small \frac{\mbox{measured 24h urinary creatinine × 100% }}
{\mbox{ideal 24h urinary creatinine for height}} \]
A CHI of <60% of the standard is said to represent a severe
deficit in body muscle mass
(Bistrain et al., 2020).
Table 16b.4
presents the urine creatinine values that represent 60% of the expected
urine creatinine excretion by height and sex. Bistrain and co-workers
advocate the use of CHI to identify severe protein-energy malnutrition
in hospital patients, followed by more advanced body composition
techniques to confirm or refine the initial diagnosis; see Chapter 14
for details of more advanced body composition methods.
For details of the analytical methods for creatinine, see
Section 16b1.5 on serum creatinine.
- Diurnal and day-to-day variations within an individual occur, which are independent of diet and physical activity. These normally range from 4% to 8%, although larger variations ranging from 8.7% to 34.4% have been noted for obese subjects (Webster & Garrow, 1985). Use of several consecutive 24h urine samples eliminates some of this variation (Waterlow, 1986).
- Strenuous exercise increases urinary creatinine excretion by 5%‑10% (Srivastava et al., 1957). The mechanism inducing such changes is unknown.
- Emotional stress affects the variability but not the absolute amount of creatinine excretion. The cause is unknown.
- Dietary intakes of creatine and creatinine from meat or supplements increase urinary creatinine excretion. Dietary protein also has a small effect on urinary creatinine excretion because it is the main source of the two dietary amino acid precursors of creatine—arginine and glycine.
- Menstruation affects creatinine excretion. It increases by 5%‑10% late in the second half of the menstrual cycle, decreasing just before and during menstrual flow (Smith, 1942).
- Age influences creatinine excretion, a decline occurring with increasing age. This effect is attributed to a probable progressive decrease in lean body mass in absolute terms, a decrease in the proportion of muscle in lean body mass, especially in men, and a probable lower meat intake in older subjects (Walser, 1987).
- Infection, fever, and trauma result in an apparent increase in urinary creatinine excretion because noncreatinine chromogens interfere with the analysis (Walser, 1987).
- Chronic renal failure results in decreased excretion of creatinine. The decrease is not related to depletion in muscle mass but to a recycling of creatinine to creatine, to intestinal degradation of creatinine to products other than creatine, and to a decreased urine volume (Mitch et al., 1980). Hence, the use of urinary creatinine to estimate muscle mass or lean body mass in patients with chronic renal failure is invalid.
16b.4.2 Urinary 3‑hydroxyproline
3‑hydroxyproline is abundant in collagen protein and is a metabolite of collagen breakdown (Alcock et al., 2019; Saito et al., 2010). Collagen is essential to maintain the normal structure and strength of connective tissue such as bone, skin, cartilage, and blood vessels. The measurement of urinary 3‑hydroxyproline reflects both dietary collagen and collagen from tissue breakdown, and as such has been suggested as a method for evaluating tissue breakdown (Alcock et al., 2019). Urinary 3‑hydroxyproline has also been used in earlier studies in low-income countries on malnourished children with impaired growth in whom excretion levels were significantly lower than thoseF in age-matched, well-nourished children, irrespective of whether the malnourished children had kwashiorkor, marasmus, or marasmic-kwashiorkor. However, in clinical settings, urinary 3‑hydroxyproline is commonly used for cancer screening (and not as a nutritional biomarker). In cancer screening, levels are elevated because cancerous cells destroy the high collagen content of the cellular basement membrane (Saito et al., 2010). A variety of extraneous factors are known to influence urinary 3‑hydroxyproline levels and are shown in Box 16b.5.
Box 16b.5 Factors affecting urinary 3‑hydroxyproline excretion.
Interpretive criteria and measurement of
3‑hydroxyproline
Recognition of the influence of age on
3‑hyroxyproline excretion led to the development of the hydroxyproline
index. This is independent of age in children and attempts to take body
weight into account and is shown below:
\[\small \frac{\mbox{mg hydroxyproline per ml urine}}
{\mbox{mg creatinine per ml urine}} × \mbox{kg body weight}\]
In well-nourished children between 1 and 6y, the hydroxyproline index
is relatively constant and is approximately 3.0 whereas in malnourished
children the index is low, irrespective of the type of malnutrition and
statistically related to the weight deficit
(Whitehead, 1965).
Interpretive criteria for the hydroxyproline index are shown in Table
16b.12.
- Age-related changes in urinary 3‑hyroxyproline excretion are related to differences in growth velocity: excretion rises rapidly during periods of fast growth. Hence, the highest excretion is apparent during the adolescent growth period (11–16 y), after which there is a gradual reduction in hydroxyproline excretion.
- Sex influences urinary 3‑hydroxyproline excretion. Males, for example, have greater amounts of soft and calcified tissue and excrete larger amounts of hydroxyproline than females.
- Infection influences urinary 3‑hyroxyproline excretion and complicates the interpretation of the results.
- Intake of collagen or gelatin increases urinary 3‑hydroxyproline excretion.
- Disease states involving disturbances in collagen metabolism such as rheumatoid arthritis are associated with elevated hydroxyproline excretion.
- Parasitic infections such as hookworm and malarial infestations increase urinary 3‑hydroxyproline excretion.
| Deficient (high risk) | Low (medium risk) | Acceptable (low risk) | |
|---|---|---|---|
| Hydroxyproline index (3mo to 10y of age) | <1.0 | 1.0–2.0 | >2.0 |
| Creatinine height index (3mo to 17y of age) | <0.5 | 0.5–0.9 | >0.9 |
| Urea nitrogen : creatinine ratio | < 6.0 | 6.0–12.0 | >12.0 |
16b.4.3 Urinary 3‑methylhistidine
Urinary 3‑methylhistidine (3‑MH) arises from the catabolism of the two skeletal muscle proteins actin and myosin. 3‑methylhistidine cannot be re-utilized for protein synthesis, but instead is excreted quantitatively into the urine without further metabolism. Therefore, in individuals in a steady state of body composition, 3‑MH urinary excretion has been proposed as a predictor of fat-free mass and muscle breakdown (Ballard & Tomas, 1983), although with relatively poor sensitivity to monitor changes in body protein stores (Keller, 2019). Several empirical prediction equations have been published based on urinary 3‑MH to estimate total skeletal muscle mass (Heymsfield et al., 2915). Nevertheless, there are several limitations to the use of 3‑MH (Box 16b.6) for assessing the size and turnover of the skeletal protein mass.
Box 16b.6 Factors affecting urinary 3‑methylhistidine excretion.
Of the confounding factors listed in Box 16b.6, in clinical
settings catabolic conditions are of special concern because muscle
protein turnover is sensitive to stressful conditions, resulting in an
increase in 3‑MH excretion even in patients with depleted skeletal
protein mass
(Young et al., 1990).
The dependence of 3‑MH on
appropriate renal function is also a limiting factor in clinical
settings.
Interpretive criteria and measurement of
3‑methylhistidine
There is a paucity of data on the excretion of
3‑MH in healthy populations so that interpretive criteria have not been
established.
For the measurement, multiple 24h urine collections, preferably
on a meat-free diet, are required, which limit the use of urinary 3‑MH
as a biomarker of skeletal protein mass
(Keller, 2019).
Further, the
analytical methods available are cumbersome, some involving ion-exchange
chromatography, and others high-performance liquid chromatography
(Minkler et al., 1987).
- A meat-free diet should be consumed by the subjects for at least 3d prior to urine collection to eliminate 3‑MH from dietary sources, in addition dietary protein intakes should be held constant (Wassertheil-Smollers et al., 1990). After such a period, mean daily 3‑MH excretion is relatively constant, with a coefficient of variation of 4.5% (Lukaski et al., 1981).
- Other sources contribute to the endogenous urinary 3‑MH. Not all comes from skeletal muscle; some is derived from cardiac and smooth muscle (Afting et al., 1981).
- Other excretionary forms also occur. About 5% of urinary 3‑MH in adults is excreted in the N‑acetyl form (Long et al., 1975). This is not normally analyzed.
- Age also affects 3‑MH excretion when expressed per kg body weight. Excretion is higher in the neonate than in the mature adult (Munro & Young, 1978) and it declines further in the elderly, presumably because of their decreasing muscle mass.
- Catabolic states such as fever, starvation, trauma, and infection generally increase muscle turnover and alter the relationship between muscle mass and the excretion of 3‑MH, thus confounding the interpretation of the measured level of 3‑MH excretion.
- Chronic renal failure results in a prolonged period of adaptation to a meat-free diet and reduced 3‑MH excretion (Gutierrez et al., 1992).
16b.5 Assessment of muscle function
Malnutrition-related muscle wasting is associated with significant changes in muscle function. Such changes in muscle function may precede body composition changes, and as a result are used to detect functional impairment, and a key component for diagnosis of sarcopenia (Cederholm et al., 2019). Studies using magnetic resonance imaging have shown that muscle strength decreases by more than 50% in in the elderly (70‑82y) compared to that in young men (18‑30y). Moreover, only half the decrease in muscle strength that occurs with aging is accounted for by a decrease in the volume of muscle (Morse et al., 2005). Handgrip strength is frequently used to evaluate skeletal muscle function in both clinical and community-based studies and is recommended by the Global Leadership Initiative on Malnutrition (GLIM) consensus for use in situations where muscle mass cannot be readily assessed (Cederholm et al., 2019). Handgrip strength (HGS) is a simple, inexpensive and non-invasive tool that can be used as a surrogate of skeletal muscle strength (Bohannon, 2019; Sandhu & Lee, 2023). For example, HGS is the recommended technique for assessing muscle strength by the European Working Party on Sarcopenia in Older People (EWGSOP) (Cruz-Jentoft et al., 2019) and the Asian Working Group for Sarcopenia (AWGS) (Chen et al., 2020). It has been introduced by AWGS to identify "possible sarcopenia" with or without reduced physical performance in both community health care and prevention settings (Chen et al., 2020). A decline in muscle strength generally exceeds changes in muscle size. For the measurement, subjects squeeze a handgrip dynamometer for a few seconds, the resulting value reflecting static force (measured in kilograms) which provides an objective measurement of strength (Vaishya et al., 2024). Dynamometers are relatively inexpensive and can be used in both community and hospital-based settings. When used while seated, measured handgrip strength reflects primarily arm strength, whereas if the subject is standing, lower body and core strength may also be reflected. Handgrip strength, when compared to subjective global assessment (SGA), has been shown to be an independent predictor of malnutrition (Flood et al., 2014; Kaegi-Braun et al., 2021; Norman et al., 2011) and to improve with nutritional intervention (Norman et al., 2011; Sandhu & Lee, 2023). In a recent randomized control trial of adults admitted to hospital, handgrip strength was negatively associated with 30d all-cause mortality. Additionally, in this trial, the men not the women with the lowest handgrip strength at admission, experienced the greatest benefit of nutrition support (Kaegi-Braun et al., 2021). Bohaanon (2017) however, has cautioned that relatively large percentage changes in grip strength may be necessary to conclude with confidence that a real change has occurred in muscle strength over time in response to treatment or an intervention. The EWSOP2 group have emphasized that more studies are needed to establish whether the current recommended lower limits (i.e., cutoffs) improve the prediction of outcomes most sensitive to response to treatment for sarcopenia (Cruz-Jentoft et al., 2019). Several functional health outcomes have been used to define optimum HGS in the elderly. They include slow measured walking speed, self-reported difficulty in walking (Lauretani et al., 2003;. Sallinen et al., 2011), limitations in Instrumental Activities of Daily Living, and altered physical performance. The latter may be evaluated through the Timed Up and Go test, 5‑time chair stand test (>12s), 6‑meter walk (<1.0m/s) or short physical performance battery (<9) (Lera et al., 2018; Chen et al., 2020). Most of these relationships have been based on cross-sectional data. However, there have also been some prospective cohort studies in which lower HGS at discharge from acute care hospitals has been associated with 30d readmission (Allard et al., 2016). In others, associations of HGS with all-cause mortality and cardiovascular mortality have been reported (Lera et al., 2018; Leong et al., 2015; Wu et al., 2017; Rantanen et al., 2003; Steiber, 2016). Factors affecting hand grip strength Age influences HGS with increases over the life course. Values peak in early adult life at a strength that is maintained through to midlife, after which it declines, with the loss accelerating through old age (Roberts et al., 2011). Sex affects HGS, with males typically having higher HGS than females. Age and sex are the strongest predictor of HGS in healthy aging individuals (Norman et al., 2011) (see Figure 16b.6).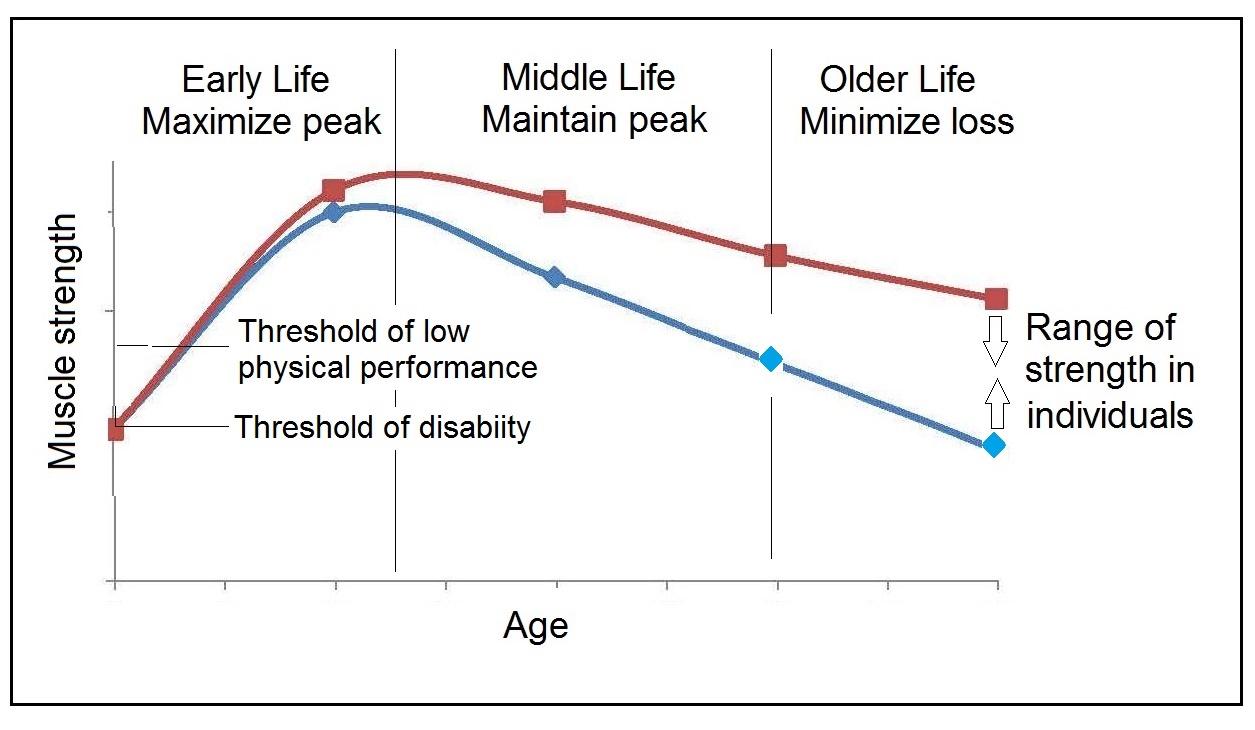
Interpretive criteria and measurement of hand-grip strength
Measurements generated from dynamometers differ depending on the device used. However, currently dynamometer-specific cutoff values are not recommended because of insufficient comparative data (Chen et al., 2020). Several sets of region-specific normative reference values for hand grip strength are available, although they have not yet been standardized. In the United Kingdom for example, percentiles (10th, 25th, 50th, 75th, 90th) by sex for grip strength based on cross-sectional observations in persons aged 4‑90y from twelve U.K. hand grip studies have been compiled (Dodds et al., 2014). A subset of these results are presented in Table 16b.13.| Centiles (kg) | |||||
|---|---|---|---|---|---|
| Age(y) | n | 10th | 50th | 90th | Mean (SD) |
| 10 | 3222 | 12 | 17 | 22 | 17.2 (4.1) |
| 20 | 354 | 30 | 40 | 52 | 41.5 (7.3) |
| 30 | 984 | 38 | 51 | 64 | 51.6 (9.6) |
| 40 | 880 | 38 | 50 | 63 | 50.3 (10.3) |
| 50 | 820 | 35 | 48 | 60 | 47.6 (10.1) |
| 60 | 2683 | 33 | 45 | 56 | 44.6 (9.2) |
| 70 | 3286 | 29 | 39 | 49 | 39.1 (8.1) |
| 80 | 1115 | 23 | 32 | 42 | 32.2 (7.3) |
| 90 | 431 | 16 | 25 | 33 | 24.7 (6.8) |
| Height (cm) | Mean HGS (kg) | Threshhold1 (kg) |
|---|---|---|
| 150‑154 | 31.5 | 25.3 |
| 155‑159 | 32.7 | 26.4 |
| 160‑164 | 33.7 | 27.4 |
| 165‑169 | 34.8 | 28.6 |
| 170‑174 | 35.8 | 29.6 |
| 175‑179 | 37.1 | 30.8 |
| 180‑184 | 38.0 | 31.8 |
| Age (y) | n | Lowest quintile (kg) | Mean (SD) (kg) |
|---|---|---|---|
| Men | |||
| 60‑69.9 | 5319 | 32.7 | 37.9 (6.5) |
| 70‑79.9 | 5317 | 28.0 | 33.3 (6.3) |
| ≥ 80 | 1554 | 23.6 | 28.4 (6.2) |
| Women | |||
| 60‑69.9 | 6384 | 20.0 | 23.6 (4.6) |
| 70‑79.9 | 6009 | 17.8 | 21.1 (4.5) |
| ≥ 80 | 1761 | 14.7 | 18.3 (4.5) |
| Location | Guidelines | Mean Age | Males | Females |
|---|---|---|---|---|
| Europe | EWGSOP2 (Cruz-Jentoft et al., 2019). | 77.0y | <27kg | <16 kg |
| USA | FNIH (Studenski et al., 2014)). | M: 75.2y F: 78.6y | <26kg | <16 kg |
| Asia | AWGS 2019 Update 2020) (Chen et al., 2020). | Not Available | <28kg | <18kg |
| India | Sarco-CUBES (Pal et al., 2021). | 44.4y | <27.5kg | <18kg |
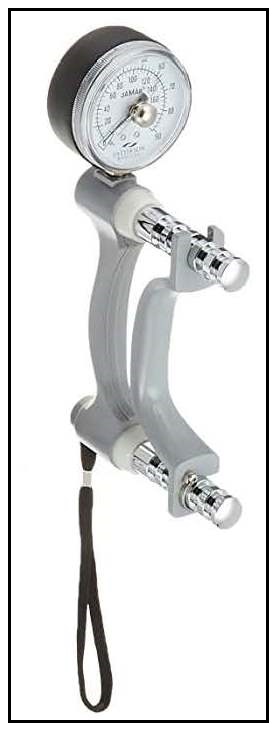
Box 16b.7 Protocol for Performing Hand Grip Strength
Measurement of grip strength obtained by dynamometry appears to
have good to excellent relative test-retest reliability, even among
older adults
(2017).
Dynamometers should be calibrated
every 4‑6mos to maintain longitudinal validity.
Dominant HGS occurs when the measurement is taken
in the subject's dominant
hand and can provide insight into strength available for daily activities.
Some researchers have
suggested using a Relative Handgrip strength in which
grip strength is standardized to BMI to
account for differences in body size
(Vaishya et al., 2024).
- Calibration: Before starting, make sure the dynamometer is calibrated according to the manufacturer's instructions to ensure accurate measurements
- Preparation: Ensure the participant is in a comfortable seated position with their feet flat on the floor and their arm resting on a flat surface.
- Shoulder position: The shoulder should be in a neutral position, and the elbow should be bent at 90 degrees
- Wrist position: Wrist should be between 0 and 30 of dorsiflexion
- Grip Position: Instruct the participant to hold the dynamometer in their hand so that the handle rests comfortably against their palm. The handle should be adjusted for a snug fit, neither too tight nor too loose
- Grip Technique: The participant should be encouraged to grip the handle as firmly as possible without straining excessively. The four fingers should wrap around the handle, while the thumb rests on the other side. Ensure that the wrist is maintained in a neutral position
- Measurement: Ask the participant to squeeze the dynamometer with maximal effort for about 3 to 5 s. During this time, encourage them to exert their maximum strength. The participant should avoid any sudden jerks or movements during the squeeze
- Encouragement: "I want you to squeeze as hard as you can for as long as you can until I say stop". (When the needle stops rising)
- Rest Between Trials: Allow a brief rest period (about 1 min) between each trial to prevent muscle fatigue that could affect subsequent measurements
- Repeat Measurements: Typically, three trials are conducted for each hand alternately. This provides a more accurate representation of the participant's handgrip strength. However, some investigators see one trial as equally reliable.