
Courtney-Martin G, Elango R,
Haliburton B, Paoletti A,
and Gibson R.S.,
Principles
of Nutritional Assessment:
Amino acids and Protein
3rd Edition. June, 2025
Abstract
Body proteins are made up of 20 amino acids, of which nine are termed indispensable because they cannot be synthesized in the body and must be supplied preformed from the diet. Proteins and amino acids in the body have multiple and varied functions ranging from the support of growth and repair of body tissue to the support of immune cell functions. Ingested proteins are degraded during digestion into free amino acids and peptides prior to absorption through the intestinal mucosa, followed by transport in the portal blood to various tissues and cells. About one third of the amino acids entering the liver are used for protein synthesis, energy metabolism, and gluconeogenesis. No body store of protein exists so with short-term inadequate intakes, protein is first lost from the visceral protein pool, but with prolonged deficiency, from skeletal muscle, leading to the marasmic form of protein-energy malnutrition. ln general, high protein intakes are not harmful except under certain conditions or disease states, and as yet, no Tolerable Upper Intake Levels for protein have been set. Protein requirements are currently based on nitrogen balance and defined as the minimum amount of nitrogen required to achieve zero balance for healthy adults. For children, pregnant and lactating women, the additional amounts of nitrogen required for deposition of newly formed tissues and secretions are estimated by the factorial approach. An alternative approach for estimating protein requirements has been developed, called the indicator amino acid oxidation (IAAO) method. This method is not based on nitrogen balance and yields protein requirements which are approximately 40% higher than current recommendations. Indispensable adult amino acid requirements are currently based on this IAAO method plus an adaption. The 24-hour indicator amino acid balance (IAAB) yields estimates that are 2 to 3 times higher than nitrogen balance data estimates. Sources of protein in the diet vary in their amino acid composition. Some plant-based proteins are lacking in indispensable amino acids whereas most animal-source foods are considered high quality protein because they have an optimal indispensable amino acid composition relative to their requirements and high digestibility and bioavailability. The current recommended measure of protein quality is the Digestibility Indispensable Amino Acid Score (DIAAS) which relies on measures of true ileal digestibility. Future evaluations of the adequacy of protein intakes should correct for protein quality based on DIAAS. CITE AS: Courtney-Martin G, Elango R, Haliburton B, Paoletti A, and Gibson R.S., Principles of Nutritional Assessment: Amino acids & Protein.https://nutritionalassessment.org/proteina/
Email: Rosalind.Gibson@Otago.AC.NZ
Licensed under CC-BY-4.0
( PDF )
16a.1 Introduction
Total body protein accounts for about 14‑16% of body mass; approximately 11kg of protein in a 70kg reference male and approximately 9kg of protein in a 60kg reference female (Zoladz, 2019) which is widely distributed throughout the different tissues of the body. Most body protein is present in the skeletal muscle (approximately 43%) (IOM, 2006). Structural tissues (i.e., skin and blood) each contain approximately 15% of the total protein while the metabolically active visceral tissues (e.g., liver and kidney) contain about 10% of the total protein. The remainder is in the brain, heart, lung, and bone. Approximately 50% of the total protein content of the body is characterized by four proteins, myosin and actin in skeletal muscle, collagen, and hemoglobin. The skeletal muscle protein (termed somatic protein) and the visceral protein pool together comprise the metabolically available protein known as the "body cell mass". The distribution of protein among the organs such as the brain, lung, heart, and bone varies with developmental age, with the neonate having proportionately less muscle and much more brain and visceral tissue than an adult.16a.1.1 Functions of protein and amino acids
Protein is important in the diet as a source of amino acids, particularly those amino acids which are indispensable and hence must be derived from the diet. There are 20 amino acids required for protein synthesis (Table 16a.1),| Indispensable | Dispensable | Conditionally dispensable |
|---|---|---|
|
Isoleucine Leucine Lysine Methionine Phenylalanine Threonine Tryptophan Valine Histidine |
Alanine Aspartic acid Asparagine Glutamic acid Serine |
Arginine Cysteine Glutamine Glycine Proline Tyrosine |
Box 16a.1 Selected functions of proteins and amino acids.
In addition to the synthesis of body protein, amino acids
are also required for the synthesis of
other important nitrogen-containing compounds.
The latter include creatine, nucleotides and
nucleic acids, polypeptide hormones (e.g., insulin, thyroid
hormones, growth hormone, and
glucagon), and some neurotransmitters and other
non-polypeptide hormones. Functions of
some of the individual amino acids are shown in Box 16a.2;
for more details, see Wu
(2009).
- Growth, maintenance, and movement: Proteins form integral parts of most body structures such as skin, tendons, membranes, muscles, organs, and bones. As such, they support the growth and repair of body tissues and protect the body (skin, immunoglobulins, etc).
- Enzymes: Proteins function as enzymes and modulate various biochemical reactions for energy production and body mass formation.
- Hormones: Some, but not all hormones, are proteins or derived from an amino acid; hormones function as messengers and signals and regulate body processes (e.g.,insulin, growth hormone, oxytocin).
- Immune function/communication: The structure of antibodies, cytokines, chemokines, and regulators of gene transcription and translation through mTOR signaling pathway are proteins.
- Fluid and electrolyte balance: Proteins in extracellular fluid help to maintain the fluid volume and the composition of body fluids (e.g., albumin).
- Acid-base balance: Proteins help maintain the acid-base balance of body fluids by acting as buffers because of their charged amino acids.
- Transportation and storage: Proteins transport substances, such as lipids, vitamins, minerals, and oxygen, throughout the body and storage of micronutrients (e.g., ferritin).
Box 16a.2. Functions of some of the individual amino acids.
Amino acids consumed in excess of the amounts needed for the
formation of nitrogenous compounds are not stored but are degraded; the
nitrogen is excreted in the urine as urea, and the keto acids, left after
removal of the amino groups, are either used directly as sources of
energy or are converted to carbohydrate or fat. Nitrogen is also lost
in feces, sweat, and other body secretions and in sloughed skin, hair,
and nails. Therefore, a continuous supply of amino acids must be
obtained from the diet to replace these losses, even in adulthood after growth has
ceased.
- Alanine. Glucogenic precursor; N-carrier from peripheral tissues to liver for N-excretion
- Aspartate. Urea biosynthesis; glucogenic precursor; pyrimidine precursor
- Cysteine. Precursor of taurine (used in bile acid conjugation and for other functions); reducing agent, also part of glutathione (important in the defense against oxygen radicals)
- Glutamate. Intermediate in amino acid interconversions; precursor of proline, ornithine, arginine, polyamines, neurotransmitter α-aminobuyric acid (GABA); NH3 source
- Glutamine. Amino group donor to many nonamino acid reactions; N-carrier (crosses membranes more easily than glutamate); NH3 source
- Glycine. Precursor in purine biosynthesis and for glutathione and creatine; neurotransmitter
- Histidine. Precursor of histamine; donates to 1‑C pool
- Lysine. For cross-linking proteins (as in collagen); precursor of carnitine biosynthesis (used in fatty acid transport)
- Methionine. Methyl group donor for many synthetic processes; cysteine precursor
- Phenylalanine. Precursor of tyrosine; and via tyrosine, precursor of catecholamines, dihydroxyphenylalanine, melanin, thyroxine
- Serine. Constituent of phospholipids; precursor of sphingolipids; precursor of ethanolamine and choline
- Tryptophan. Precursor of serotonin; precursor of nicotinamide (B‑vitamin)
- Tyrosine. See phenylalanine
16a.1.2 Absorption and metabolism of protein and amino acids
In the body amino acids exist freely or as part of protein (IOM, 2005). They are made available through dietary protein intake or de novo synthesis. The protein in the diet is denatured by stomach acid and hydrolyzed in the gastrointestinal tract by a series of proteolytic enzymes. The end products of protein digestion — free amino acids and small peptides — are taken up by mucosal cells of the small intestine by an energy-requiring process involving several carrier systems. Trace amounts of whole proteins are also absorbed through the intestinal mucosa and can enter the blood stream. Upon entering the portal blood, the free amino acids are taken up by the liver and other organs and metabolized along three possible pathways. These are: (a) incorporation into tissue proteins, (b) catabolism by degradation pathways that involve deamination or transamination and, (c) synthesis of new nitrogen-containing compounds such as purine bases, creatine, and epinephrine, as well as dispensable amino acids. About one third of the amino acids entering the liver from the portal blood are used for protein synthesis, energy metabolism, or gluconeogenesis. Skeletal muscle is the main site of metabolism of the branched-chain amino acids (leucine, isoleucine, and valine). For further details see Crim and Munro (1994) and the Dietary Reference Intakes (IOM, 2005). The amount of protein synthesized daily depends on the requirements for growth, the manufacture of digestive and other enzymes, and the repair of body tissues. Even in healthy adults, proteins and other nitrogenous compounds are being continuously degraded and resynthesized in the body. This process is termed "protein turnover" and varies with age, physiological status, and level of protein intake. In healthy adults, the rate of protein synthesis is balanced by an equal amount of protein degradation, so that the amount of body protein remains approximately constant over long periods of time. During growth, however, protein synthesis exceeds protein degradation so there is a net deposition of protein leading to an expansion of the body cell mass. When protein intake is inadequate or diets are limiting in certain indispensable amino acids, then there is a shift in this balance so that rates of synthesis of some body proteins decrease while protein degradation continues in an effort to provide an endogenous source of those amino acids most in need. Conversely, when amino acids are consumed in excess of the amounts actually needed, the excess are not stored but are degraded, as noted earlier.16a.1.3 Effects of protein deficiency
There is no long-term storage of proteins in humans (Holt et al., 1962 ), and therefore loss of body protein results in the loss of essential structural elements as well as impaired function. Initially, during short-term changes in dietary intakes, the main loss of protein occurs from the visceral protein pool (de Blaauw et al., 1996). In chronic deficiency states, however, the largest single contributor to protein loss is the skeletal muscle (Hansen et al., 2000). Loss of muscle mass (and adipose tissue) characterizes the marasmic form of protein-energy malnutrition (PEM). This is the form most frequently encountered in low-income countries, where it is known as nutritional marasmus. It generally results from a prolonged reduction of food intake. Marasmus may also occur in more affluent countries in hospital patients with chronic illnesses such as cancer, or from the prolonged use of clear fluid diets and hypocaloric intravenous infusions of 5% dextrose (Corish & Kennedy, 2000; Naber et al., 1997). Kwashiorkor, a second form of PEM, occurs in children from certain regions of low-income countries. In these countries, kwashiorkor is often precipitated by a series of environmental insults in concert with a diet with a low protein content relative to energy (Fuhrman et al., 2004). Observations in Malawi have also implicated the gut microbiome as a causal factor in kwashiorkor (Smith et al., 2013). Unlike marasmus, kwashiorkor does not result in clinical signs of wasting, but instead with a range of clinical signs, including bilateral pitting, edema, loss of hair pigmentation, and skin lesions. Metabolic disturbances are also more severe in kwashiorkor than marasmus, some of which are poorly understood, but include hypoalbuminemia, hepatic steatosis, and depletion of minerals, vitamins, and antioxidants. Of the latter, a reduced rate of synthesis of red blood cell glutathione, the most abundant antioxidant in the body, has been reported in children with edematous PEM relative to those with non-edematous PEM (Reid et al., 2000). Such a low glutathione status has been associated with a decreased glutathione synthesis secondary to a shortage of protein-derived cysteine in children with edematous PEM. Differences in gut microbiota have also been reported, with more pathogenic species in the kwashiorkor gut microbiota. For more details on metabolic differences, see Green et al. (2014); Di Giovanni et al. (2016); and Pham et al. (2021). Kwashiorkor may also occur in adult hospital patients in more affluent countries, where it is termed "adult kwashiorkor" and tends to arise from an inadequate intake of dietary protein accompanied by acute protein losses and metabolic reactions induced by the stresses associated with hypermetabolism (e.g., trauma or sepsis) (Jeejeebhoy, 1981).16a.1.4 Effects of high protein intakes
There is no formal definition of a high-protein diet, although most of the definitions range between 1.2 to 2.0g/kg/d (Ko et al., 2020). Within this range, a protein intake >1.5g/kg/d can be considered a high-protein diet. According to data from the U.S National Health and Nutrition Examination Surveys (NHANES), the average intake of protein in an American diet is 1.2 to 1.4g/kg/d (Berryman et al., 2018). High protein intakes have been associated with negative effects on kidney function (Brenner et al., 1982). In a more recent meta-analysis of data from 28 papers from 1975 to 2016, the effects of low (<0.8g/kg/d) and normal protein intakes (0.8 to <1.5 g/kg/d) versus higher protein intakes (>1.5g/kg BW/d) in healthy individuals were investigated on kidney health (Devries et al., 2018). The data showed that when changes in glomerular filtration rates were compared, dietary protein had no effect suggesting that high protein intake does not negatively affect kidney health in healthy adult populations. These results are in accordance with statements made by FAO / WHO / UNU (FAO, 2007) and by the US Institute of Medicine in their report on protein requirements (IOM, 2005). Another concern with high protein diets pertains to bone health. Several systematic reviews and meta-analyses have addressed the benefits and risks of dietary protein intakes for bone health in adults (Darling et al., 2011; Mangano et al., 2014; Shams-White et al., 2018 ). Overall, the evidence suggests no adverse effects of higher protein intake on bone health. Instead, protein has been shown to be positive for bone health. Moreover, mounting evidence demonstrates that older adults require more dietary protein to support good health, recovery from illness, and maintain functionality (Bauer et al., 2013). Higher dietary protein intakes (1.0 to 1.2g/kg/d) are necessary to offset age-related changes in protein metabolism such as high splanchnic sequestration of amino acids and the decline in anabolic responses to ingested protein (Fujita & Volpi, 2006; Volpi et al., 2003). In addition, more protein than current recommendations is required for the elderly to promote an adequate metabolic response to inflammatory and catabolic conditions associated with chronic and acute diseases that occur frequently with aging (Bauer et al., 2013). Despite the lack of evidence suggesting harmful effects of higher protein intakes in healthy populations, under certain conditions/disease states higher protein intakes may be unsafe. The Modification of Diet in Renal Disease (MDRD) study was a large randomized multicenter, controlled trial evaluating the relationship between dietary protein restriction and renal disease (Levey et al.,1999). Outcomes such as glomerular filtration rate (GFR), were measured in patients with chronic renal disease at baseline and during a 2‑year follow-up period. The results showed that for patients with a lower total protein intake, the time to renal failure was longer. These findings suggest that a lower protein intake postponed the progression of advanced renal disease (Levey et al.,1999). Additionally, a systematic review and meta-analysis by Li Q et al. (2021) investigated the effects of a low protein diet (<0.8g/kg/day) versus a control diet (1.29 g/kg/d) on the progression of diabetic kidney disease (DKD). Patients with DKD who consumed a low protein diet had a significantly reduced decline in GFR and a significant decrease in proteinuria compared to those on the control diet. Therefore, under certain conditions / disease states, particularly renal disease, higher protein intakes are not recommended.16a.2 Methods to assess protein requirements
Nitrogen balance is the traditional method used for measuring protein requirements, and the one adopted for estimating the protein requirements in healthy adults by several expert groups including the Institute of Medicine (2005), FAO (2007) and EFSA (2015) (see Section 16a.3). For children, pregnant and lactating women, a factorial approach is used whereby the maintenance needs, based on nitrogen balance, are summed with the additional protein needs associated with the deposition of tissues or secretion of milk. The only other method that has been used to assess protein requirement is the indicator amino acid oxidation (IAAO) method. All three methods and their limitations are discussed briefly below.16a.2.1 Nitrogen balance
The nitrogen balance method is the classical approach for determining protein requirements. It is based on several assumptions. These include the assumption that nearly all of the body nitrogen is incorporated into protein so that gain or loss of nitrogen from the body can be regarded as synonymous with gain or loss of protein. Secondly, in healthy adults in energy balance, body nitrogen is constant if the dietary intake of the test protein is adequate, and thirdly if the body nitrogen content decreases or does not increase adequately, then the dietary protein is deficient. The validity of these assumptions is discussed in the FAO /WHO / UNU report (FAO, 2007). The method for nitrogen balance involves the measurement of nitrogen intake (from the diet) minus the sum of nitrogen output in urine, plus nitrogen losses in feces, skin, hair and other miscellaneous losses. However, the majority of nitrogen balance studies only report measurements of urinary and fecal losses and not the measurements for dermal or miscellaneous nitrogen losses. As a result, adjustments are made to take such losses into account when determining the protein requirements. The intake of nitrogen is quantified by analyzing the nitrogen content of duplicate portions of food and careful collection of all food not consumed, such as spillage and residue on plates. In some cases, nitrogen intake is estimated from the protein intake because most proteins are assumed to contain approximately 16% nitrogen. To assess protein requirements using nitrogen balance, different levels of a high-quality protein above and below the expected requirement are tested on healthy adults who are in energy balance. For each level of test protein, multiple days (i.e., 6-10 days) are needed for each participant to adapt to reach a new steady state of nitrogen excretion (Danielsen & Jackson, 1992). Therefore, nitrogen balance studies are usually conducted on only a few test protein intakes. After the metabolic adaption period, it is assumed that the requirement is met when the individual comes into "zero nitrogen balance" i.e., when nitrogen intake equals nitrogen excretion. When nitrogen intake is inadequate, more nitrogen is excreted than is consumed, due to net losses of body protein, and the individual is said to be in negative nitrogen balance. Conversely, when the nitrogen intake exceeds nitrogen losses, an individual is in positive balance. The expression for nitrogen balance is: N balance = I − (U − Ue) + (F − Fe) + S where I = intake of nitrogen (protein / 6.25), U = total urinary nitrogen, Ue = endogenous urinary nitrogen, F = nitrogen voided in feces (as unabsorbed protein), Fe = endogenous fecal nitrogen losses, and S = dermal nitrogen losses. In most of the nitrogen balance studies on which the protein requirements have been based, only the nitrogen contents of the diet (I), urine(U) and feces (F) have been measured directly. For the endogenous urine and fecal nitrogen losses and dermal nitrogen losses, the estimated allowances are based on data from a limited number of studies, as noted earlier. Nitrogen balance studies are very challenging, with difficulties in quantifying all routes of both intake and loss of nitrogen. In practice, intake is often over-estimated due to unconsumed food (crumbs, plate residue etc) and output under-estimated due to inaccurate collection techniques. As a consequence, nitrogen balance results tend to be biased toward a positive balance which leads to the under-estimation of nitrogen/protein requirements (Elango et al., 2010). For more details on the nitrogen balance method and its limitations to estimate protein requirements for adults, see the FAO / WHO / UNU report (FAO, 2007). Nitrogen balance is also used to guide protein intake in critically ill patients in whom excessive protein catabolism (e.g., from trauma, sepsis, infection, and burns) can result in high negative nitrogen balance values. Results of a recent systematic review and meta-analysis analysis suggest that improved nitrogen balance is associated with a better prognosis in critically ill patients (Zhu et al., 2022). Other factors that may precipitate a negative nitrogen balance include excessive loss of nitrogen arising from fistulas or excessive diarrhea, inadequate intakes of protein or energy, and an imbalance in the dispensable : indispensable amino acid ratio. In the past, total urinary nitrogen levels were rarely measured in routine hospital laboratories, so urinary urea nitrogen was determined and used to replace the estimation of total urinary nitrogen in some circumstances. To account for the nonurea nitrogen components of the urine not measured (e.g., ammonia, uric acid, and creatinine), a correction factor of 2g of nitrogen per day was commonly applied. This factor was derived from studies examining the relationship between measured total urinary nitrogen and measured urinary urea nitrogen in a variety of nutritional and clinical conditions (Blackburn et al., 1977; MacKenzie et al., 1985). An additional correction factor of 2g was also added for the dermal and fecal losses of nitrogen that were also not measured ( MacKenzie et al., 1985). Nitrogen intake was determined accurately by analyzing the nitrogen content of the diets or parenteral/enteral formulas using the micro-Kjeldahl technique. Alternatively, specific conversion factors were used to calculate the nitrogen content of parenteral solutions containing free amino acids, and for mixed diets, 16% of the protein intake was assumed to be protein. However, many factors can affect the validity of adjusted urinary urea nitrogen as a measure of nitrogen balance in clinical patients (Konstantinides et al., 1991), and the use of the estimated nitrogen balance method has declined.16a.2.2 Factorial approach
For infants >6mos, children, pregnant, and lactating women, current protein requirements are based on the factorial approach (FAO, 2007; (IOM, 2005; EFSA, 2015) as noted earlier. In this approach the additional nitrogen (as protein) needed for the deposition of newly formed tissues or secretion of breast milk is added to the requirement for maintenance for an adult. As the maintenance need is based on nitrogen balance, the factorial approach is subject to the limitations described above in Section 16a.2.1. Moreover, whether the calculated additional amounts of nitrogen required for depositing newly formed tissues and secretions for children, pregnant and lactating women, are correct is unclear, especially in view of the debate surrounding the efficiencies of protein utilization (Millward, 2012). For more discussion, see Sections 16a.3.2 and 16a.3.3.16a.2.3 Indicator amino acid oxidation
In light of the limitations of nitrogen balance, the FAO, 2007 report notes nitrogen balance has..serious technical drawbacks that may result in requirement values that are too low.Moreover, the U.S Institute pf Medicine (IOM, 2005) has stated,
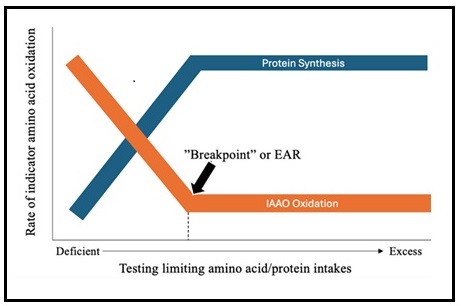
...due to the shortcomings of the nitrogen balance method noted earlier, it is recommended that the use of nitrogen balance should no longer be regarded as the 'gold standard' for the assessment of the adequacy of protein intake and that alternative means should be sought.However, the only other method that has been used to assess protein requirements to date is the indicator amino acid oxidation (IAAO) method, described below. The IAAO method was developed to determine amino acid and protein requirements in baby pigs and later used to determine amino acid and protein requirements in humans (Ball & Bayley, 1986; Kim et al., 1983; Humayun et al., 2007). It is a minimally invasive technique employing a stable isotope-labeled indispensable amino acid to determine amino acid or protein requirements (Elango & Ball, 2016). The premise of the method is that there is no long-term storage of amino acids in the body so excess amino acids must be partitioned between incorporation into protein and oxidation (Elango, et al, 2012; Holt et al., 1962) . This principle was validated in an animal study by Ball & Bayley (1986). When protein or a single indispensable amino acid is provided below its requirement in the diet, all others (including the indicator amino acid), are in relative excess and will be oxidized as shown in Figure 16a.1 (Ball & Bayley, 1986). As the intake of protein increases (from deficient to excess) there is a decline in indicator oxidation, reflecting whole-body protein synthesis. Oxidation of the indicator amino acid is highest when the dietary intake is below the protein pr amino acid requirement. Once the requirement is met for the limiting amino acid / protein, there is no further change in oxidation of the indicator amino acid, and the point of inflection, where oxidation stops declining and plateaus, is denoted as the breakpoint (Figure 16a.1). The breakpoint is determined using two-phase linear regression and indicates the requirement (equivalent to the Estimated Average Requirement or EAR) of the limiting (test) amino acid or protein (Elango et al., 2012). The upper 95% confidence interval provides a surrogate estimate of the FAO safe individual intake (equivalent to the IOM Recommended Dietary Allowance (RDA).
16a.3 Nutrient Reference Values for protein
Nutrient reference values (NRVs) for protein have been set by several expert groups, although inconsistencies exist on the terminology and approaches applied and the recommendations set. In most cases, two NRVs for protein have been set for life-stage groups from aged 6mos to >70y. The Average Requirement (AR) (or equivalent) is defined as the median protein requirement for healthy individuals of a particular sex and life-stage group. Hence, the AR (or equivalent) refers to the intake level that meets the protein requirement of half of the healthy individuals in that sex and life-stage group. The AR is used to evaluate the adequacy of protein intakes of population groups. In contrast, the second NRV, termed a Safe Individual Intake by FAO (2007), and the Recommended Dietary Allowance by IOM (IOM, 2005) is defined as the 97.5th percentile of the distribution of individual requirements, nominally the average + 1.96SD. Hence any individual with a safe individual intake (or equivalent) will have a very low risk (i.e., <2.5%) of deficiency (intake less than requirement) (FAO, 2007). Currently, due to lack of data, no Tolerable Upper Intake Level (UL) for protein has been set by FAO (2007), IOM (2005), or EFSA (2015). The UL represents the highest level of daily nutrient intake that is likely to pose no risk of adverse effects for almost all people. In the following sections, the NRVs for protein set by FAO (2007) for global use are outlined. Discrepancies in the NRVs for protein set by FAO (2007), the IOM (2005), and ESFA (2015) are also highlighted.16a.3.1 Protein requirements for adults
A meta-analysis of nitrogen balance studies (Section 16a.2.1) has been used to estimate protein requirements for adults by all three expert groups. Protein requirements were defined as the minimum amount of nitrogen required to achieve zero balance (FAO, 2007; EFSA, 2015; IOM, 2005). When based on per kg body weight basis, adult values for the AR and safe individual intake for protein are the same for all three expert groups. These are 0.66 g/kg BW/d for the AR (or equivalent) and 0.83 g/kg BW/d for the safe level of intake (or equivalent) based on a protein digestibility corrected amino acid score of 1.0. Note that currently these values remain the same for the elderly and for those consuming only plant-based products due to insufficient available data for these subgroups.16a.3.2 Protein NRVs for infants, children, and adolescents
All three agencies also applied the factorial model to derive protein NRVs based on protein needs for maintenance plus growth for infants from 6mos onwards and for children and adolescents up to 18y. FAO applied the adult maintenance value (0.66g/kg/d), plus growth costs from total body potassium (TBK) studies of protein gain adjusted with an efficiency value of 58%.| Ages (years) | Average Requirement (median) | Safe individual intake (+1.96 SD) |
|---|---|---|
| 0.5 | 0.12 | 1.31 |
| 1 | 0.95 | 1.14 |
| 2 | 0.79 | 0.97 |
| 3 | 0.73 | 0.90 |
| 4 | 0.69 | 0.86 |
| 5 | 0.69 | 0.85 |
| 6 | 0.72 | 0.89 |
| 7 | 0.74 | 0.91 |
| 8 | 0.75 | 0.92 |
| 9 | 0.75 | 0.92 |
| 10 | 0.75 | 0.91 |
| 11 | M 0.75 F 0.73 | M 0.91 F 0.90 |
| 12 | M 0.74 F 0.72 | M 0.90 F 1.89 |
| 13 | M 0.73 F 0.71 | M 0.90 F 1.88 |
| 14 | M 0.72 F 0.70 | M 0.89 F 0.87 |
| 15 | M 0.72 F 0.69 | M 0.88 F 0.85 |
| 16 | M 0.71 F 0.68 | M 0.87 F 0.84 |
| 17 | M 0.70 F 0.67 | M 0.86 F 0.83 |
| 18 | M 0.69 F 0.66 | M 0.85 F 0.82 |
| Age (months) | Average Requirement (median) | Safe individual intake (+1.96 SD) |
|---|---|---|
| 1 | 1.41 | 1.77 |
| 2 | 1.23 | 1.50 |
| 3 | 1.13 | 1.36 |
| 4 | 1.07 | 1.24 |
| 6 | 0.98 | 1.14 |
16a.3.3 Protein NRVs for pregnant and lactating women
A factorial method was also used by all three expert groups to estimate the protein requirements of pregnant and lactating women. For pregnant women, the requirement was derived from adult protein maintenance needs (0.66g/kg/d) estimated from mid-trimester weight gain plus mean protein deposition estimated from TBK accretion in normal healthy pregnant women gaining 13.8kg by the end of the third trimester (Emerson et al., 1975; FAO, 2007; King, 1975; Pipe et al., 1970). However, estimates for efficiency of dietary protein utilization varied across the three expert groups. FAO adopted an estimate of 42% (Emerson et al., 1975; IOM (2005) of 43%, whereas EFSA (2015) applied 47%, the value derived for adults. FAO (2007) include gestational stage-specific recommendations for additional protein intakes to support a 13.8kg weight gain during pregnancy (Table 16a.4), an approach also adopted by EFSA (2015). In contrast, IOM (2005) provide only one value equivalent to the FAO Average Requirement and Safe Individual Intake for pregnancy. For more details see FAO (2007), IOM (2005), and EFSA (2015).| Pregnancy additional protein requirement (g/d) | ||
|---|---|---|
| Average requirement (median) | Safe individual intake (+1.96 SD) | |
| 1st Trimester | 0.5 | 0.7 |
| 2nd Trimester | 7.7 | 9.6 |
| 3rd Trimester | 24.9 | 31.2 |
| Lactation additional protein requirement (g/d) | ||
| 1 mo | 16.2 | 20.2 |
| 2 mo | 15.6 | 19.5 |
| 3 mo | 14.8 | 18.5 |
| 4 mo | 14.3 | 17.0 |
| 5 mo | 14.4 | 18.1 |
| 6 mo | 15.5 | 19.4 |
| > 6 mo | 10 | 12.5 |
16a.3.4 Protein NRVs based on the IAAO method
The IAAO method (Section 16a.2.3) was first applied to the study of protein requirements in humans by determining the protein requirements of the same young adult males who participated in the original nitrogen balance study (Humayun et al., 2007). The IAAO response was measured when feeding graded intakes of protein ranging from 0.1 to 1.8g/kg/d. NRVs corresponding to the FAO AR and safe individual intake of 0.93 and 1.2g/kg/d respectively, were determined. Subsequently, the IAAO method has been used to determine protein requirements in other life-stage and physiological groups (Table 16a.5) (Rafii et al., 2015; Elango et al., 2011; Stephens et al., 2015). All the IAAO studies were conducted under measured energy needs and the derived protein requirements range from 10‑18% of the energy from protein.| Life-stage group | EAR | RDA |
|---|---|---|
| Children (6-10y) | 1.3 | 1.55 |
| Young Adult Males | 0.93 | 1.2 |
| Pregnant Females: Early Gestation | 1.2 | 1.66 |
| Pregnant Females: Late Gestation | 1.52 | 1.77 |
| Older Adult Males (>60y) | 0.94 | 1.24 |
| Older Adult Females (>60y) | 0.96 | 1.20 |
16a.4 Methods for assessing amino acid requirements
Several methods have been developed to improve the nitrogen balance method to determine the requirement for an individual indispensable amino acid. Of these, amino oxidation methods are described briefly below. These methods are now used to determine the amino acid requirements in adults (>19y) by FAO / WHO / UNU (2007).16a.4.1 Direct Amino Acid Oxidation (DAAO)
This method was the first to demonstrate that amino acid requirements derived using the nitrogen balance method were underestimated by a factor of 2 to 3 (Zello et al., 1995). However, because the DAAO method can only be used to estimate the requirements of those amino acids whose carboxyl carbon is released into the bicarbonate pool and measurable in breath (Pencharz & Ball, 2003), other methods with broader application have been developed.16a.4.2 Indicator amino acid oxidation (IAAO)
This method can also be used to determine amino acids requirements (Section 16a.4.3), when instead of feeding graded intakes of protein, graded intake levels of the test amino acid are provided. The protein source is a crystalline amino acid mixture patterned after egg protein pattern and provided at 1.0g/kg/day in adults. Additionally, the indicator amino acid is a different indispensable amino acid than the amino acid being tested, often 13C‑labeled L‑phenylalanine or 13C‑labeled L‑leucine. When determining amino acid requirements, the IAAO study day (day 3) diet is formulated to be isocaloric and isonitrogenous. The nitrogen content of the diets is adjusted according to the level of amino acid intake level being studied. For all dietary indispensable amino acid requirements except the branched chain amino acids, L‑alanine is used to keep the diets isonitrogenous. When assessing branched chain amino acid requirements, L‑serine is used to balance nitrogen content. As discussed in Section 16a.2.3, opponents argue that the IAAO fed-state amino acid requirements do not capture 24h fasted and fed cycles. Additionally, concern about whether prior adaptation to the test amino acid intake is required, led to the modification termed the 24h indicator amino acid balance (IAAB) method and described below.16a.4.3 24h indicator amino acid balance (IAAB)
The IAAB method is an adaption of the IAAO method led by concerns that the IAAO fed-state amino acid requirements do not capture 24h fasted and fed cycles, and the need for prior adaptation to the test amino acid intake. The method includes a 6d adaptation period to the test amino acid intake, followed by measurement of an indicator amino acid oxidation over a 24h period (12h fasted and 12h fed) (Elango et al., 2012). The indicator amino acid used is usually 13C‑labeled L‑leucine. Balance is calculated as the difference in leucine oxidation and leucine intake. The 13C‑labeled L‑leucine isotope is administered intravenously over 24h and during this time blood and breath samples are collected to measure isotopic enrichment in the plasma. Thus, the IAAB protocol is more invasive than the IAAO protocol, so a fewer number of amino acid levels are assessed in each participant: between 2 to 4 intakes. As reviewed by Elango et al., (2012), no systematic difference in amino acid requirement estimates have been found using the 24h IAAB or 8h fed state IAAO protocol. Also, for a given amino acid requirement determined by the 24h IAAB method, the requirements in the fed and fasted state are the same (Kurpad, Raj, et al., 2002; Kurpad, Regan, et al., 2002). Prior adaptation to the test amino acid intake does not alter the IAAO-derived requirement for threonine (Szwiega et al., 2023).16a.4.4 Protein NRVs for indispensable amino acids
Unlike the requirements for protein, amino acid requirements in adults (>19y), including older adults, have been set by FAO / WHO / UNU using data from studies conducted using both IAAO (Section 16a.4,2) and IAAB (Section 16a.4.3) methods; see FAO (2007) for more details. All IAAO and IAAB studies were conducted under measured energy needs and the derived protein requirements range from 10‑18% of the energy from protein. It is noteworthy that EFSA (2015) did not derive requirements for the indispensable amino acids . They argued that amino acids are not provided as individual nutrients but in the form of protein. They were also of the view that more data are needed to obtain precise values for the individual indispensable amino acids. The US Institute of Medicine has published recommendations for amino acids as part of the Dietary Reference Intakes (DRI) (IOM, 2005)| Age/life-stage group | HIS | ILE | LEU | LYS | SAA | THR | TRP | VAL |
|---|---|---|---|---|---|---|---|---|
| 1 month | 36 | 95 | 165 | 119 | 57 | 76 | 29 | 95 |
| 2 month | 26 | 69 | 121 | 87 | 42 | 55 | 21 | 69 |
| 3 month | 23 | 60 | 105 | 75 | 36 | 48 | 19 | 60 |
| 4 month | 21 | 54 | 95 | 68 | 33 | 44 | 17 | 54 |
| 6 month | 20 | 52 | 90 | 65 | 31 | 41 | 16 | 52 |
| 1-2 yr | 15 | 27 | 54 | 45 | 22 | 23 | 6.4 | 36 |
| 3-10 yr | 12 | 23 | 44 | 35 | 18 | 18 | 4.8 | 29 |
| 10-14 yr | 12 | 22 | 44 | 35 | 17 | 18 | 4.8 | 29 |
| 14-18 yr | 11 | 21 | 42 | 33 | 16 | 17 | 4.5 | 28 |
| > 18 yr | 10 | 20 | 39 | 30 | 15 | 15 | 4 | 26 |
| Life-stage | HIS | ILE | LEU | LYS | SAA | THR | TRP | VAL |
|---|---|---|---|---|---|---|---|---|
| Pregnancy | 15 | 20 | 45 | 41 | 20 | 21 | 5 | 25 |
16a.5 Food sources, dietary intakes, and quality of dietary protein
In many affluent countries, foods of animal origin (e.g., meat, fish, milk and dairy products) are the major source of protein in the diets of adults, with the proportion from the meat and dairy group varying with age and region. Most animal-source foods are considered to have high quality protein because their protein has both an optimal indispensable amino acid composition and a high digestibility. Some plant-based foods such as legumes, nuts and seeds, and soy products are also considered high-quality sources of plant proteins because they provide a higher proportion of indispensable amino acids than other plant foods. However, certain anti-nutritional factors present in plant foods or formed during processing may reduce the protein digestibility. In the US NHANES 2015‑2018 survey, approximately two-thirds of total protein intake of adults was from animal sources, and one third from plant sources. Of the latter, the primary protein source was grains, mainly as refined grains, whereas the intake of protein from high quality plant protein sources was low (Hoy et al., 2022). Similar patterns have been reported among Canadians (Auclair & Burgos, 2021) and French adult populations (Salome et al., 2020). In general, the proportion of adults in these Western countries with protein intakes considered inadequate is low, although in the United States, 12% of adults over 70y had inadequate intakes which is of concern (USDA, 2019; Berryman et al., 2018). A recent systematic review compared the intake and adequacy of nutrients in adults (mostly in Europe or North America) consuming plant-based diets compared to meat-eaters (Neufingerl & Eilander, 2021). Protein intake (as percent energy) was lower in those following plant-based diets compared to meat-eaters, although on average within recommended levels, a trend consistent with that in the US NHANES 2015‑2018 study (Hoy et al., 2022). Nevertheless, nutrient inadequacies existed across all the dietary patterns reviewed, including vegan, vegetarian, and meat-based diets. In general, however, replacing protein from animal sources with plant foods does provide a better intake of those dietary components associated with reducing chronic disease risk (i.e., lower intake of cholesterol and saturated fat and higher intake of dietary fiber) (Hoy et al., 2022). Both quantity and quality impact the adequacy of dietary protein intakes. Protein quality of diets is mainly dependent on its composition of indispensable amino acids, and their digestibility and bioavailability. In Western countries, the amino acid pattern of mixed diets meets the requirement levels for most age groups. Even vegetarian mixed diets are likely to meet the requirement levels if they contain complementary mixtures of plant proteins (IOM, 2005). A recent study comparing the habitual indispensable amino acid intake of participants of the US NHANES, 2001-2018 reported that the intakes of the US population exceeded the recommended minimum population requirements. Less than 1% of those aged at least 19y did not meet the EAR for each indispensable amino acid Berryman et al., 2023). In low-income countries, unlike affluent countries, plant-based foods often supply more than 50% of the total protein. Moreover, there is often excessive reliance on a single low protein plant-based staple which is a poor source of certain indispensable amino acids. For example, cassava and maize are the main sources of dietary protein in many parts of Africa, and poor sources of leucine and methionine, and tryptophan and lysine, respectively. Hence, some concerns have been raised, especially among young children in low‑ and middle-income countries, that poor protein quality may be a factor limiting their growth (Ghosh et al., 2012). The protein content of staple foods in low-income countries are often expressed as the proportion of the energy in the food provided by protein: i.e., the FAO / WHO / UNU protein : energy ratio (FAO, 2007). Using this approach, foods such as cassava, plantains, sweet potatoes and taros are classified as examples of poor sources of protein (in relation to their energy). Indeed, cassava has the lowest protein : energy ratio of any staple crop, common cassava cultivars having only 1% protein. Potatoes, unrefined maize, rice and sorghum are classified as "adequate" sources of protein, and groundnuts, beans and peas, cow's milk (skimmed), soybean, and dried fish as "good".16a.5.1 Factors affecting the quality of dietary protein
The quality of dietary protein is largely evaluated based on its composition of indispensable amino acids, and their digestibility and bioavailability. The latter affect how well the amino acids within the protein are digested, absorbed, and utilized for protein synthesis. All three factors are discussed below. For a detailed review of protein quality, see Boye et al. (2012). Composition of amino acids affects protein quality. High quality or animal proteins provide all nine indispensable amino acids in the correct proportions for the synthesis of body protein and other non-protein substances. Poorer quality proteins such as plant proteins are low in one or more indispensable amino acid as noted earlier (IOM, 2005). The indispensable amino acid that is present in the smallest quantity relative to the requirements and thus limits the body's ability to fully utilize other amino acids in a given food or diet, is termed the "first limiting amino acid". There is no official standardized method for amino acid analysis. The methods involve three steps: hydrolysis to break down protein into their constituent amino acids, followed by derivatization to improve their detectability, and finally chromatography to separate the derivatized amino acids. This final step is performed using techniques such as High-Performance Liquid Chromatography (HPCL) or Gas Chromatography (GC). Digestibility refers to the net absorption of an amino acid following digestion (FAO, 2013). Assessment of digestibility is challenging due to the presence of endogenous nitrogen compounds (digestive enzymes, mucoproteins etc.) which are mixed with the ingested food in the intestinal tract. Digestibility can be measured as fecal or ileal digestibility. Both methods have limitations. Fecal digestibility measures the amino acid absorbed across the entire gastrointestinal tract (mouth to anus) (FAO, 2007). A limitation of this method is that a portion of the dietary protein that enters the large intestine is degraded by microbial activity. This leads to disappearances and/or appearances of amino acids from the digestive tract which have no nutritional contribution to the availability of the amino acids for protein metabolism. Hence, this results in an over‑ or under-estimate of digestibility depending on the food consumed. Ileal digestibility quantifies the absorption of amino acids across the small intestine (mouth to terminal ileum). It has been adopted by FAO as more representative of the bioavailability of dietary amino acids, overcoming some of the limitations of fecal digestibility (FAO, 2013). When measuring ileal digestibility, endogenous amino acid components must be accounted for to yield the true ileal digestibility value. This step requires insertion of a naso-intestinal tube in humans and is highly invasive. However, in vitro digestibility methods are being explored, such as INFOGEST, that mimic oral, gastric, and intestinal phases of digestion (Brodkorb et al., 2019). Some hold promise for the measurement of ileal amino acid digestibility (Xipsiti, 2024). It is posible that dual stable-isotope tracer method can be used to determine true ileal indispensable amino acid digestibility in humans but requires validation. The method requires development of an isotopically intrinsically labeled food, which is then fed to subjects in small meals, after which the appearance of the labeled amino acids in the plasma is measured (Mansilla et al., 2020). Bioavailability refers to the quantity of amino acids that are digested and absorbed in a form that is utilizable for synthesizing body proteins. Heat and processing affects the bioavailability of some amino acids (e.g, lysine, lysine, methionine, tryptophan and threonine) which can lead to overestimates of ileal digestibility (Batterham, 1992; Van Barneveld et al., 1994). Certain anti-nutritional factors present in plant foods or formed during processing can also interfere with bioavailability and digestibility. Examples of those naturally occurring include: trypsin inhibitors and haemagglutinins found in legumes; tannins in legumes and cereals; and phytates in cereals, legumes, and oilseeds. Antinutritional factors formed during processing include: Maillard reaction products (MRP) from heating or alkaline treatment, oxidized forms of sulfur amino acids, D‑amino acids and lysino-alanine; for more details, see Gilani (2012).16a.5.2 Methods to evaluate protein quality
Evaluating protein quality involves assessing the capacity of sources of protein in both foods and diets to meet the protein and indispensable amino-nitrogen requirements (FAO, 2013). Two methods for evaluating protein quality are described, the first originally recommended by FAO / WHO in 1993, is termed the Protein digestibility-corrected amino acid score (PDCAAS) in which digestibility is adjusted using nitrogen fecal digestibility factors. The second, recommended by FAO / WHO in 2013 is called the Digestible Indispensable Amino Acid Score (DIAAS) and includes measurement of ileal digestibility.| Amino acid | Requirement (mg/g crude protein) |
|---|---|
| Isoleucine | 28 |
| Leucine | 66 |
| Lysine | 58 |
| Total sulfur amino acidsa | 25 |
| Total aromatic amino acidsb | 63 |
| Threonine | 34 |
| Trytophan | 11 |
| Valine | 35 |
| Total | 320 |
| Age (y) | HIS | ILE | LEU | LYS | SAA | AAA | THR | TRP | VAL |
|---|---|---|---|---|---|---|---|---|---|
| 0.5 | 20 | 32 | 66 | 57 | 27 | 52 | 31 | 8.5 | 43 |
| 1–2 | 18 | 31 | 63 | 52 | 25 | 46 | 27 | 7.4 | 42 |
| 3–10 | 16 | 31 | 61 | 48 | 23 | 41 | 25 | 6.6 | 40 |