
Calvo MS1,
Whiting SJ2,
and
Uribarri J1,
Principles of Nutritional
Assessment: Phosphorus
3rd Edition, August 2024
Abstract
The essential nutrient phosphorus (in nature occurring as phosphate) is ubiquitous in all the foods we eat, the human body and, in effect, all living organisms. phosphate is critical to structural and biochemical functions needed to secure energy, reproduce and grow. Most of the body's phosphate is contained within bones, teeth, membranes and intracellular spaces; however, it is the 1% present in the extracellular space, serum that is clinically measured to inform about physiologic and nutritional phosphate status. Serum phosphate in healthy individuals usually reflects phosphate balance that is maintained within a narrow range by hormonal control of renal reabsorption and excretion, and intestinal absorption when dietary phosphate intakes are low or excessive. Regulation of serum phosphate involves the interplay of four organs (kidneys, intestine, bone and parathyroid glands), phosphate in these organs, and the actions of three endocrine hormones (parathyroid hormone, calcitriol (the active form of vitamin D), and bone-secreted fibroblast growth factor‑23 (FGF‑23), all of which influence the activity of the phosphate transporters to increase or decrease absorption, reabsorption or excretion of phosphate. Hyperphosphatemia (i.e., serum phosphate > 1.45mmol/L) is often related to excess dietary phosphate intake by the consumption of phosphate additive-rich processed foods, or the typical Western diets when kidney function is impaired. Higher serum phosphate has been associated with disruption of endocrine pathways that may link high phosphate intake with pathology associated with chronic disease risk, including cardiovascular disease. In contrast, hypophosphatemia (i.e., serum phosphate < 0.87mmol/L) is rarely related to dietary deficiency of phosphate except in cases of severe malnutrition, and more likely due to inborn errors of metabolism or tumor production of excess FGF‑23 that causes renal phosphate wasting and bone disease (rickets and osteomalacia). CITE AS: Calvo MS, Whiting SJ, & Urbarri J. Principles of Nutritional Assessment: phosphorus. https://nutritionalassessment.org/ phosphorus/Email: mscalvo55@comcast.net
Licensed under CC-BY-4.0
( PDF )
23b.1 Phosphorus
Phosphorus is the 11th most abundant element yet phosphorus is not present in nature as elemental phosphorus, instead occurring mainly bound to oxygen as phosphate (Ferro, 2018). Deposits of phosphate-rich rock in the earth's crust slowly release phosphate which builds up in soils over time, entering the food chain via soil microbes, and then crops, livestock, and other components of the human food supply. However, deposits of rocks rich in phosphate are limited across the globe. When mined, these phosphate deposits are largely used as fertilizers for crop growth (Ferro, 2018). Phosphorus is often the key growth-limiting factor for all living things. As an essential nutrient, phosphorus functions in critical pathways and cellular components in all life forms on earth, ranging from subcellular viruses to complex plants and animals, all dependent on phosphate for energy, growth, reproduction, structure, and homeostasis facilitated through signal transduction. Phosphates participate in all biological processes providing energy stored in phosphodiester bonds of ATP (the phosphodiester backbone of RNA and DNA). Other functional roles include the structural integrity of cell membranes as phospholipids, regulation of acid base balance, mineralization of teeth and bones, lipid transport in blood, and signalling pathways essential to maintaining phosphate homeostasis. As phosphate has such a critical role in so many biological processes, phosphate homeostasis must be tightly regulated. In conditions when sources of phosphate are deficient, growth or reproduction is limited, whereas with excess, toxicity may occur, which in humans may manifest as disease (Hernando et al., 2021).23b.2 Biological forms of phosphate and their measurement
The three forms of phosphorus bound to oxygen that occur in nature are shown in Figure23b.1: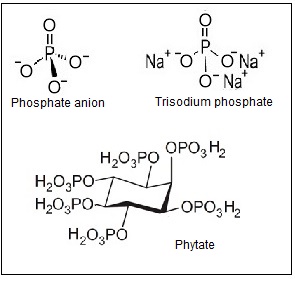
23b.3 Interpretive criterion: serum phosphate
Serum phosphate is the most frequently used biomarker of phosphorus status in a clinical setting, and is usually measured in the fasting state. However, the measurement of a single fasting serum phosphate concentration represents only a small portion of the total body phosphate, and hence does not always reflect the body phosphate stores. Measurement of serum or plasma phosphate concentration requires the use of anticoagulants such as heparin which do not interfere with the color reaction described for the AOAC spectrophotometric method described in 23b.2. Hemolyzed samples are not suitable for phosphate measurement as erythrocyte phosphate confounds the measurement and hemoglobin contributes color interference. Serum phosphate concentrations can also be affected temporarily by acute shifts of phosphate between intracellular and extracellular compartments without affecting total body content (Uribarri & Oh, 2018).| Sample | Reference Ranges | |
|---|---|---|
| mg/dL | mmol/L | |
| Cord | 3.7 ‑ 8.1 | 1.2 ‑ 2.8 |
| Child | 4.5 ‑ 5.5 | 1.45 ‑ 1.78 |
| Adult | 2.7 ‑ 4.5 | 0.87 ‑ 1.45 |
| Older Adult > 60y | M: 2.3 ‑ 3.7 F: 2.8 ‑ 4.1 |
M: 0.74 ‑ 1.2 F: 0.90 ‑ 1.3 |
Serum phosphate concentrations are maintained within a narrow range (see Section 23b.5 for details of the hormonal regulation of serum phosphate). In adults, total serum inorganic phosphate ranges between 0.87-1.45mmol/L (Table 23b.1): 56% is ionized, 20% bound to protein and 24% bound to other cations. However, there is a significant amount of organic phosphate in serum (7.5‑8.0mg/dL or 2.4‑2.6mmol/L) which is not included in the analytical method used by clinical laboratories. When serum phosphate concentrations fall below the normal range, a condition called hypophosphatemia occurs, whereas for concentrations above the normal range, hyperphosphatemia develops; serious clinical consequences can arise from both conditions.
Several factors affect serum phosphate concentrations. Diurnal variation in serum phosphate occurs with concentrations lowest at 9AM and highest at 7PM. There is also a seasonal variation, whereby levels are higher during the summer than during the winter; this may arise because phosphorus absorption is stimulated by the greater synthesis of vitamin‑D with higher summer sunlight exposure. Serum phosphate is also higher in women than in men (by about 0.31mg/dL, 0.1mmol/L), and higher in children (i.e., normal range 1.45‑1.78mmol/L) than adults (i.e., normal range 0.87‑1.45mmol/L); see Table 23b.1. Normal serum phosphate values for children and adults are shown in Table 23b.1. Hypophosphatemia is usually defined as serum phosphate < 0.87mmol/L and hyperphosphatemia as a serum phosphate > 1.45mmol/L; see Section 23b.8 for more discussion of abnormalities in serum phosphate (Koumakis et al., 2021).23b.4 Phosphate balance
Phosphate balance is the result of the interaction of intestinal absorption of dietary phosphate, renal phosphate excretion, and exchange of phosphate between extracellular and bone and intracellular phosphate pools (Figure 23b-2.). At present, the only easily available parameter to study total body phosphate in a clinical setting is to measure the serum phosphate concentration, usually in the fasting state. This measurement represents only a small portion of the total body phosphate, as noted above, and can also be affected by shifts of phosphate between intracellular and extracellular compartments (Uribarri & Oh, 2018).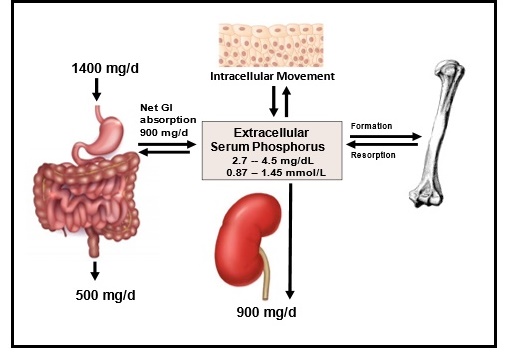
23b.5. Hormonal regulation of serum phosphate
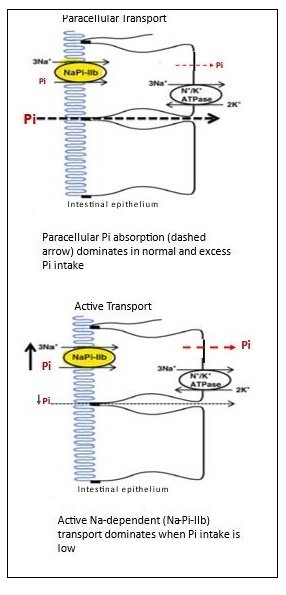
Serum phosphate concentration must be maintained within a very narrow range to avoid adverse health consequences and risk of disease such as soft tissue calcification or cardiovascular disease. Regulation of serum phosphate involves the interplay of four organs, phosphate membrane transporters bound in these organs, and the actions of three endocrine hormones that influence the activity of the phosphate transporters (Uribarri & Calvo, 2023). The four major organs involved in regulating serum phosphate are the kidneys, bone, intestine, and parathyroid glands. There are two families of sodium-phosphate membrane transporters specific to these organs. They include the SLC34 group of NaPi‑2a, b, c, chiefly located in the kidney and intestine, and the SLC20 family (PiT‑1 and 2) largely found in bone, intestine, soft tissue, muscle, with some in the kidney (Forster et al., 2013). The activity of these two families of sodium-phosphate membrane transporters is controlled by three endocrine hormones: parathyroid hormone (PTH), calcitriol (1‑25,dihydroxycholecalciferol; (1‑25(OH)2D), the active metabolite of vitamin D), and fibroblast growth factor 23 (FGF‑23). The three phosphate regulating hormones are endocrine hormones meaning that they are secreted into the circulation by a specific organ, but act upon a distal organ. As illustrated in Figure 23b.4, PTH is secreted by the parathyroid glands when the rise in serum phosphate triggers a decrease in serum ionized calcium or is sufficiently elevated to directly stimulate PTH secretion. Circulating PTH rapidly acts to decrease NaPi‑2a and NaPi‑2c co‑transporters in the renal proximal and distal tubules. A decrease in membrane co‑transporters acutely decreases phosphate reabsorption and increases phosphate excretion in the urine. When normal serum phosphate concentration is filtered in the glomerulus, about 75% of phosphate is reabsorbed in the proximal tubule and 10% from the distal tubule with 10‑15% lost in urine, as noted earlier.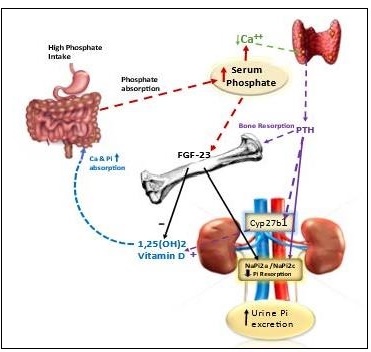
23b.6 Nutrient reference values
In 1997, the Institute of Medicine (U.S. and Canada) determined adult age specific Estimated Average Requirement (EAR) values for phosphorus derived from studies using serum phosphorus as a biomarker (IOM, 1997). For adults 19‑50 years, the EAR was based on the relationship between serum phosphate and absorbed intake determined from earlier published data. This relationship was then used to translate absorbed intake to the amount of ingested phosphorus based on an assumed efficiency of absorption of 62.5% from a mixed diet not high in phytate (Calvo & Whiting, 2018). An intake of phosphorus of 580mg/d meets the needs of 50% of the adult population (≥ 19y) and therefore was set as the EAR and served as the basis for determining the Recommended Daily Allowance (RDA) for phosphate that covers the phosphorus needs of 97% of the adult population. For children, the biomarker used to set the EAR for dietary phosphorus intake was based on published factorial estimates of accretion of phosphate into bone; see IOM (1997) for more details. For infants, the AI was set to reflect the observed mean intakes of infants fed principally with human milk (IOM, 1997). The EAR and RDA values for phosphorus for infants, children and adults by age and sex, and for the physiologic states of pregnancy and lactation recommended in 1997, are shown in Table 23b.2.| Age/sex groups | EAR | RDA | UL |
|---|---|---|---|
| 0‑6 mo | -- | 100 (AI) | - |
| 6‑12 mo | -- | 275 (AI) | - |
| 1‑3y F & M | 380 | 460 | 3000 |
| 4‑8y F & M | 405 | 500 | 3000 |
| 9‑18y F & M | 1055 | 1250 | 4000 |
| 19‑50y F* & M | 580 | 700 | 4000 |
| 51‑70y F & M | 580 | 700 | 4000 |
| 71+ F & M | 580 | 700 | 3000 |
23b.7 Dietary sources
Dietary sources of phosphate include both organic and inorganic phosphate. Phosphate is present in most food sources and is usually highest in animal protein compared to plant protein sources. Importantly, the bioavailability of phosphorus differs between protein derived from animal sources compared to plant derived protein. In addition to containing protein, plants store phosphate as phytate (Figure 23b.1). Phosphate is stored as phytate in unrefined cereals, oil seeds, and legumes that requires enzymatic or physical action to release phosphate bound to phytate. Bioavailability of phytate-phosphorus is low unless foods are processed using home-based methods such as soaking, germination, or fermentation, or commercial methods such as canning and extrusion (Tefarra, 2021), all of which having the potential to improve phosphate availability from phytate. While these methods of processing improve phosphate availability from phytate, commercial processing leading to processed and ultra-processed foods may involve the addition of phosphate-containing additives that provide highly available sources of phosphate, such as sodium phosphate salts shown in Figure 23b-1 (Calvo & Uribarri, 2021). Examples of animal, plant, and additive sources of phosphate are shown in Table 23b.3, with the foods classified according to the NOVA system (Monteiro et al., 2017), which reflects their degree of processing. The NOVA system classifies foods into four groups, with the fourth group called “ultra-processed”. A recent cross-sectional study of the United States food supply found that 71% of packaged foods and beverages were ultra-processed and 60% of energy intake came from ultra-processed foods, an increase over past decades (Baldridge et al., 2019). High ultra-processed food consumption patterns are associated with increased risk of cardiovascular disease and mortality (Juul et al., 2021), chronic kidney disease (Cai et al., 2022), and various other serious chronic diseases. Specifically, ultra-processed foods such as cured meats containing added inorganic phosphates are associated with carotid intimal thickening (Itkonen et al., 2014), decreased renal function (Duong et al., 2022), and low HDL cholesterol (Fulgoni et al., 2022). Causality between phosphate additive use in ultra-processed foods and increased risk of chronic disease or mortality remains to be established. However, there is growing awareness that the use of phosphate additives in food processing increases the total phosphate availability and content of foods.| NOVA Food Classification Definitions | Representative
Foods (Prepared phosphate Content:mg P/100 g) | Main Forms of phosphate |
|---|---|---|
|
Group 1. Minimally Processed, Unprocessed Foods: Natural plant and animal foods and water processed by drying, crushing, grinding, fracturing, filtering, roasting, boiling non- alcoholic fermentation, past- eurizing, refrigeration, chilling, freezing, placing in container and vacuum packaged for storage |
Cooked oatmeal (99) Boiled lentils (180) Boiled black beans (140) Soy flour (674) Corn flakes breakfast- cereal (58) |
OPi from Plant-derived protein and phytate |
|
Baked chicken breasts (228) Baked tuna fillet (326) 2% Milk (92) Broiled beef steak (189) Boiled egg (126) |
OPi from Animal- derived protein | |
|
Group 2. Processed Culinary Ingredients Includes oils, butter, sugar, and salt that allows for preparing unprocessed foods at home |
Soy oil (0) Butter (24) Sugar (0) Salt (0) | ND |
|
Group 3. Processed Foods: Foods processed by various preservation or cooking methods or fermentation such as bread that usually contains 2 to 3 ingredients. |
Grilled Chicken Patty,
from frozen (208) Cheddar Cheese (473) Canned Tuna* (311) Canned Green Beans* (19) |
OPi from animal protein, plant protein, and phytate with use* of Pi additives |
|
Group 4. Ultra-processed Foods: Foods industrially formulated from substances derived from foods, additives, and ultra- processed products not usually used in home cooking such as hydrogenated oils, hydrolyzed proteins, added sugars and salt |
Fried chicken nuggets*(213) Fried Sausages** (174) Battered fish sticks*(171) Baked frozen pizza* (215) Processed Cheese* (982) Cheerios breakfast- cereal** (448) Pancakes from Mix* (334) Shop white bread** (109) |
OPi from Animal Protein with added **IPi and OPi from additives and isolates OPi from processed Plant protein having lower phytate but higher **IPi and OPi from additives and isolates |
23b.8 Abnormalities in serum phosphate
Phosphate balance, a proxy for assessing phosphate nutritional status, is best assessed by measuring fasting serum phosphate concentrations. Nevertheless, single fasting serum phosphate measures do not always reflect the body phosphate stores because acute shifts of phosphate between body compartments may temporarily affect serum phosphate without affecting total body phosphorus content.|
Paths to Acute Acquired Hypo- phosphatemia | Causative Mechanism |
|---|---|
| Acute Shift in Extra- cellular to Intra- cellular Distribution |
Refeeding syndrome Metabolic acidosis Glucose infusion and other carbohydrates Acute respiratory alkalosis Alcohol withdrawal Serious burns, surgical trauma Hyperthermia Hormonal or other agents : (insulin, glucagon, cortisol, catecholamines, fructose) Rapid cell proliferation or uptake (hungry bone syndrome, cancer) |
| Decreased Dietary Intake |
Severe dietary restriction and
malnutrition (renal failure) Anorexia Kwashiorkor (severe protein / calorie malnutrition) |
| Decreased Intestinal Absorption |
Vitamin D deficiency Antacid overuse Phosphate binder use Gastrointestinal malabsorption |
|
Increased Renal Excretion |
Primary hyperparathyroidism Secondary hyperparathyroidism (dietary phosphate excess and low calcium intake or vitamin D deficiency) Metabolic acidosis (volume expansion, Fanconi syndrome, tumor production of PTH-related peptide, neurofibromatosis; acute falciparum malaria, and various medications including bisphosphonates such as etidronate, pamidronate, zoledronic acid for post- menopausal osteoporosis) |
|
Duration of Hyperphosphatemia | Mechanism Associated with
Hyperphosphatemia |
|---|---|
|
Acute Hyperphosphatemia |
Acute kidney injury Increased intestinal absorption of excess dietary load phosphate-containing enemas Transcellular shifts from intra‑ to extracellular (hemolysis, rhab- domyolysis, acidosis, tumorlysis) Hyperthermia Heat stroke |
| Chronic Hyperphosphatemia |
Chronic kidney disease Hypoparathyroidism Pseudohypoparathyroidism Vitamin D intoxication Disorders of magnesium regulation (PTH regulation) Acromegaly |