
Gibson RS.
Principles of Nutritional
Assessment:
Food consumption of individuals
3rd Edition May 2024
Abstract
Quantitative methods for measuring food consumption of individuals consist of 24h recalls or estimated or weighed food records. These measure actual intakes for individuals over one day, or by increasing the number of measurement days, usual intakes of foods and nutrients. For retrospective information on usual intakes of foods or nutrients over a longer time period, a dietary history or food frequency questionnaire (FFQ) can be used. Each method has advantages and limitations.Technical improvements for measuring dietary intakes of individuals include telephone-assisted interviews, graduated portion-size photographs printed or digitally displayed. Web-based interviewer or self-administered 24h recalls that standardize the interview and data entry are being used in national food consumption surveys. For low-income countries, 24h recall data can be collected off-line using a mobile application and linked to a web databased application allowing access to food composition data. Several image-based methods utilizing camera-enabled cellular phones or smartphones, digital, wearable or digital video cameras are being tested, some relying on active image capture by users and others on passive image capture whereby pictures are taken automatically. Under development are wearable devices which objectively measure diet without relying on user-reported food intake.
Selection of the appropriate dietary method depends primarily on the study objectives. For average usual intake of a group, a single 24h recall or record is appropriate, whereas for the prevalence of inadequate intakes, replicate observations on each individual or at least a representative subsample are required. For assessing usual nutrient intakes for ranking within a group, multiple replicates of 24h recalls or 1d food records are essential, with an even larger number per individual for diet counselling, correlation or regression analysis. The number, selection, and spacing of the days depends on the within-in person day-to-day variation of the nutrient of interest and level of precision required. Alternatively, a semi-quantitative food frequency questionnaire or dietary history can provide data on usual nutrient intakes for ranking or diet counselling etc.
CITE AS:
Gibson RS. Principles of Nutritional Assessment:
Food consumption of individuals
https://nutritionalassessment.org/ individual/
Email: Rosalind.Gibson@Otago.AC.NZ
Licensed under CC-BY-4.0
3.1 Methods for measuring food consumption of individuals
This chapter describes methods commonly used for measuring the food consumption of individuals. Subsequent chapters discuss the factors associated with the reproducibility and validity of each of these methods (Chapters 5‑7) and the calculation and, subsequently, evaluation of nutrient intakes (Chapters 4 and 8b).Two groups of methods are used to measure the food consumption of individuals. The first group, known as quantitative daily consumption methods, consists of recalls or records designed to measure the quantity of the individual foods consumed over a one day period. By increasing the number of measurement days, quantitative estimates of the usual intakes of individuals can be obtained, using the same methods. The number, selection, and spacing of the days depend on the food intake, the nutrients of interest, the day-to-day variation in nutrient intake, and the level of precision required. Determination of the usual intake of individuals is particularly critical when relationships between diet and biological parameters or health or chronic disease are assessed. Estimates of usual intakes of individuals in a group or population are also needed to estimate the prevalence of inadequate intakes.
The second group of methods includes the dietary history and the food frequency questionnaire. Both obtain retrospective information on the patterns of food use during a longer, less precisely defined time period. Such methods can be used to assess the usual intake of foods or specific classes of foods. With modification , they can also provide data on usual nutrient intakes of individuals.
Quantitative daily consumption methods such as 24h recalls and records, when adjusted appropriately statistically to assess usual intakes, provide less-biased estimates of dietary intake than those such as food frequency questionnaires and dietary histories that are designed to generate data on usual intakes directly (National Cancer Institute, 2015).
The measurement of food consumption at the individual level is costly and time consuming. Hence, such studies should be planned with care (Thompson et al., 2015). Even with the advent of new technologies to measure dietary intakes (Section 3.2), challenges still remain. Consideration should be given to the cost-effective collection of additional data from the same individuals at the same time; such additional information may significantly enhance the interpretation of the dietary data. At a minimum, socioeconomic and health-related information, simple anthropometric measures, possibly a physical activity questionnaire, and biological samples for the determination of important biomarkers (Chapter 15) should be collected when time and resources permit (Buzzard and Sievert, 1994).
The accurate assessment of the food intake of infants is particularly difficult, especially when infants are receiving both breast milk and complementary foods (Piwoz et al., 1995). WHO (2023) has published guidelines that can be used to evaluate nutrient intakes of breastfed infants receiving complementary foods.
3.1.1 Twenty-four-hour recall method
In the 24h recall method, the respondent and, where necessary, their parents or caretakers are asked by the nutritionist, who has been trained in interviewing techniques, to recall the respondent's exact food intake during the previous 24h period or preceding day. Thus the method assesses the actual intake of individuals. However, a single 24h recall is not sufficient to describe an individual's usual intake of food and nutrients; multiple 24h recalls on the same individual over several days are required to achieve this objective (Section 3.1.2). Nevertheless, multiple single-day recalls on different individuals can give a valid measure of the usual intake of a group or population (Section 3.3.1). A multiple-pass interviewing technique is recommended for the 24h recall methods. The USDA has developed an automated multiple-pass method (AMPM) consisting of five steps to collect dietary data using the 24h recall method; these five steps are shown in Table 3.1.| USDA's Automated Multiple Pass Method | ||
|---|---|---|
Design | AMPM Step | Memory Cues |
|
Unstructured Respondents use their own strategy | Quick List ⇓Collects recalled foods |
Yesterday, midnight to midnight, day of week, activities, snacks and beverages, location |
|
Structured Questions for specific types of foods | Forgotten
Probes for categories |
Seven question: Beverages, alcoholic beverages; sweets; savory snacks; fruits, vegetables or cheese; breads or rolls; and one for anything else. |
|
Structured Times and names of eating occasions | Time &
Collects eating times |
Breakfast, lunch, dinner, snack |
|
Structured Standardized questions to collect details of each food Review foods for each eating occasion & intervals between each occasion | Detail Cycle⇓Collect food detailsand amounts. |
For breakfast you had a bagel & coffee Anything else? Did you have anything between your 7am breakfast and 10am snack? |
|
Unstructured Respondents use their own strategy | Final Probe⇓Anything else recalled |
Situations where foods may have been easily forgotten: in the car, at meetings, when shopping, cooking, or cleaning up? |
The first step in the AMPM is the Quick List where respondents list all food consumed in the previous 24h period. The second step, called Forgotten Foods, includes a series of questions that probes for categories of foods that are commonly forgotten. The third step, Time & Occasion, collects the time each food was eaten and the name of the eating occasion. The fourth step is the Detail Cycle which elicits descriptions of foods and amounts eaten, aided by the interactive use of the USDA Food Model Booklet and measuring guide (USDA 2002+); see Chapter 5 for more details. The Detail Cycle also includes questions that review each eating occasion and each interval between eating occasions. The fifth step is a final review question, the Final Probe, which provides the respondent a final opportunity to recall any foods that had not been reported previously during the interview. The AMPM has been validated by comparing reported energy intake in young children with total energy expenditure assessed using the doubly labeled water method (Johnson et al., 1996) and in an observational study in which actual intakes of energy, protein, carbohydrate, and fat were compared with recalled intakes in men (Conway et al., 2004).
A modification of the multiple-pass 24h recall consisting of four passes — termed an interactive 24h recall — has been developed to collect information on rural populations in low- and middle-income countries; details are given in the technical monograph by Gibson and Ferguson (2008).
In the first pass a complete list of all the foods and beverages consumed during the preceding day is obtained.In the second pass, a detailed description of each food and beverage consumed, including cooking methods and brand names (if possible) is collected. Standardized probe questions, specific for the population subgroup and setting, should be used to elicit specific details for each food item. For example, for milk products, probe questions should include the kind of dairy product, brand name (if appropriate), and percentage fat (as butterfat or milk fat). Further examples of probes that can be used to obtain detailed descriptions of specified foods are also provided in the monograph.
In the third pass, estimates of the amount of each food and beverage item consumed are obtained, generally in household measures, and entered either on the data sheet Appendix 3.1 or a computer-based data-entry form. Care must be taken to record whether any fortified foods or beverages have been consumed. Graduated photographs (Vossenaar et al., 2020), a set of measuring cups, spoons, and rulers, local household utensils (calibrated for use), play dough, or food models of various types (Chapter 5) can be used to assist the respondent in assessing portion sizes of food items consumed (Gibson and Ferguson 2008; Lazarte et al., 2012). See guidelines on portion-size estimation methods by Vossenaar et al. (2020). Vossenaar et al. (2022) also provide technical guidance on how to collect, compile, and use portion size estimation method conversion factors in a 24h recall. Information on the amount of any mixed dishes consumed by the respondents, the amount of each ingredient in the mixed dishes, and the total amount of each cooked mixed dish prepared must also be collected at this time. These details are usually recorded on a separate data sheet or computer-based data-entry “recipe form". Vossenaar et al. (2023) have published guidance on the use of standard and non-standard recipes in quantitative 24h dietary recall surveys.
In the fourth pass, the recall is reviewed to ensure that all items, including the use of vitamin and mineral supplements, have been recorded correctly. Methods for coding the completed 24h recalls and potential sources of coding errors are discussed in Chapter 5.
Additional modifications that can be used in the interactive 24h recall are listed in Table 3.2| Interactive 24-h recall modifications |
|---|
|
Provide group training on portion size estimation before the actual recall. |
|
Supply picture charts on the day before the recall for use as a checklist on the day the food is actually consumed, and for comparison with the recall to reduce memory lapses. |
|
Provide bowls and plates for use on the recall days to help the respondents visualize the amount of food consumed. |
|
Weigh the portion sizes of salted replicas of the actual foods consumed by the respondent. |
A major advantage of a 24h recall is that the respondent burden is small so that compliance is generally high. In addition, the method is quick and relatively inexpensive, and can be used equally well with both literate and illiterate respondents. Nevertheless, any 24h interview protocol must be standardized, pretested,and then piloted prior to use. Standardization is particularly important in large-scale national surveys and for comparisons across countries (Slimani et al., 2000; Vossenaar et al., 2020). Adherence to the interview protocol and accuracy of food coding by the interviewers should be checked periodically during the survey, and the interviewers must be retrained if required to minimize interviewer bias (Chapter 5). Detailed suggestions on how to conduct the interview can be found in Hughes (1986) who stressed that leading questions and judgmental comments should be avoided. An indirect approach employing open-ended questions is recommended. This enables respondents to freely express their feelings so that answers are not biased. Piloting should be undertaken in an area near the study site, using respondents similar to those who will participate in the actual study.
When 24h recalls are used to characterize the average usual intake of a population group, the respondents should be representative of the population under study. In addition, the survey should be conducted in such a way that all days of the week are equally represented. In this way, any day-of-the-week effects on food or nutrient intakes will be taken into account (Chapter 6). Seasonality must also be considered as it affects food availability.
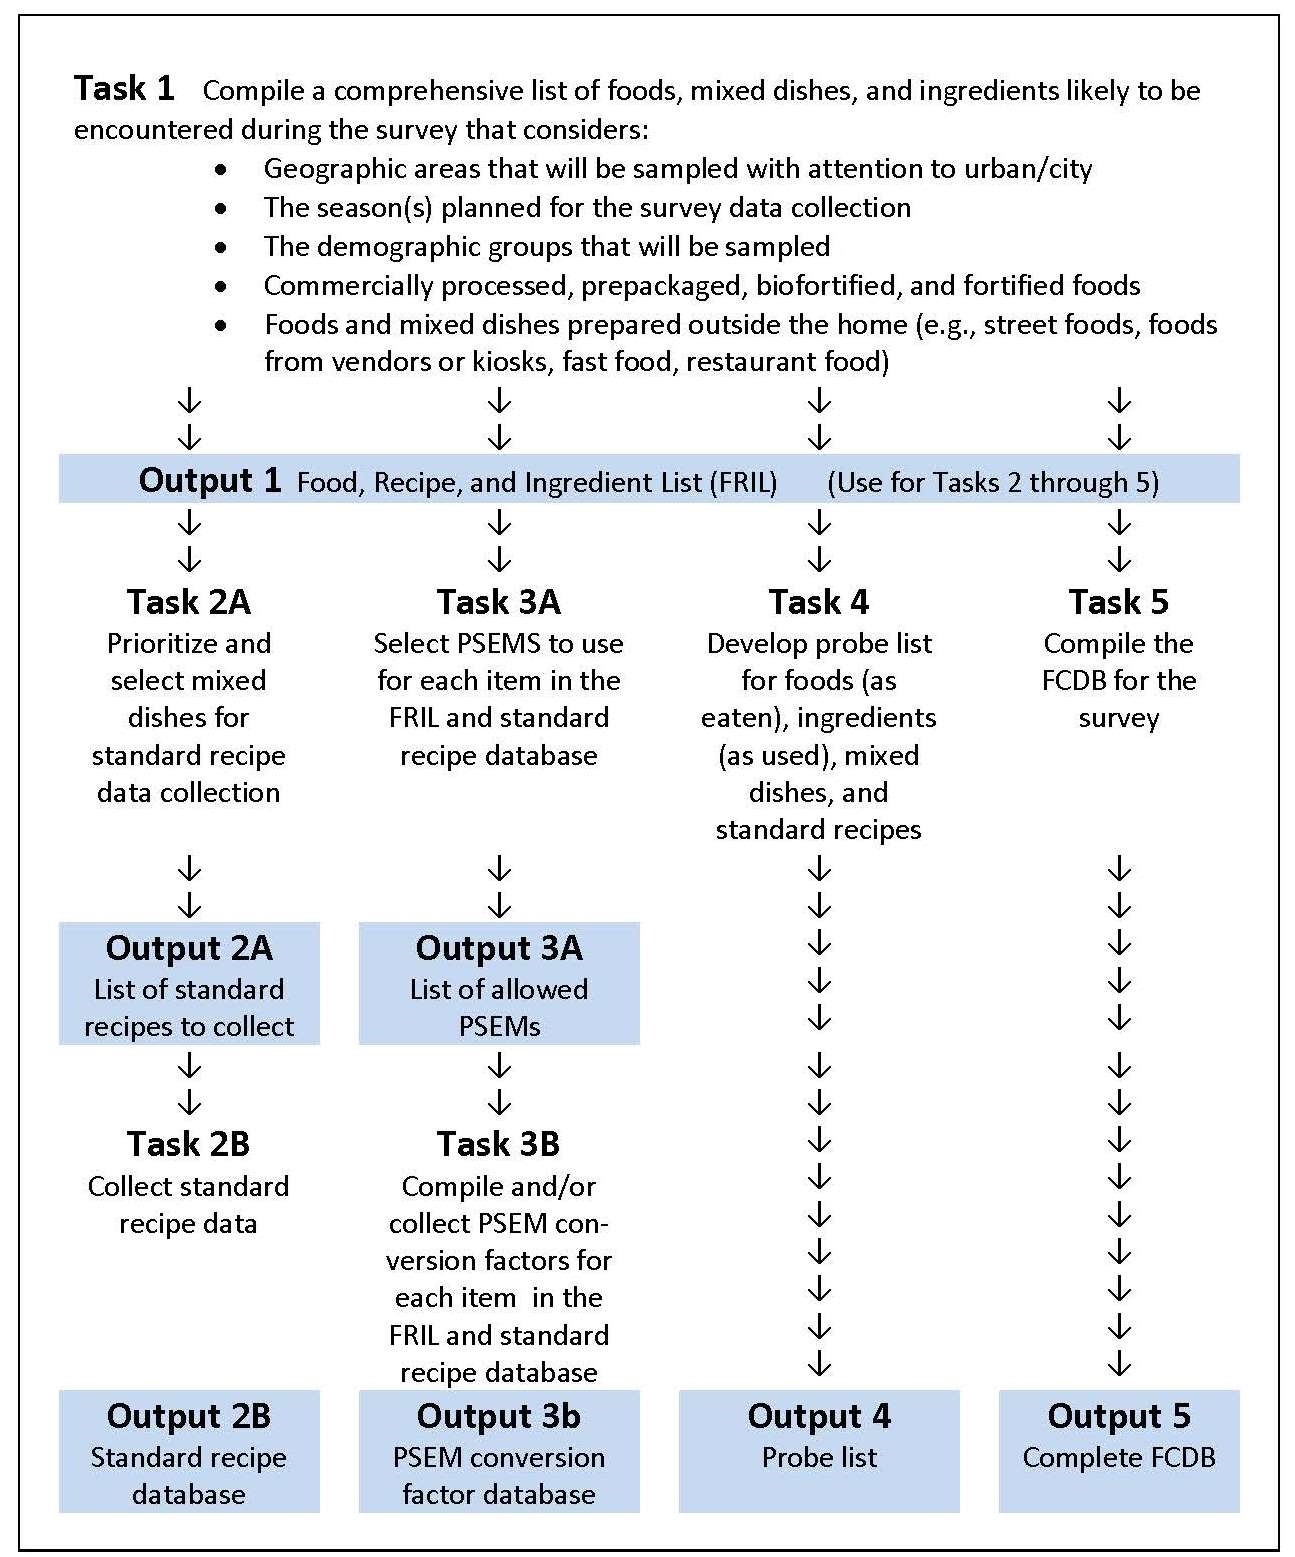
Guidelines on how to plan, design, and conduct large-scale 24h recall
dietary surveys in low-and middle-income countries have been
developed by the Intake Center for Dietary Assessment
(Vossenaar et al., 2020;
Deitchler et al., 2020),
An outline of the main tasks
that must be completed prior to the conduct of a large-scale
24h recall survey is presented in
Figure 3.1.
Intake.org also provide recommended specifications for dietary scales and procedures to test their accuracy and precision
(Vossenaar et al., 2020).
The US National Cancer Institute have developed an Automated Self-Administered 24h recall (ASA24) based on the US AMPR method which is suitable for large-scale epidemiological studies (Subar et al., 2012). The ASA24 web-based system was tested for use with children and adults in Canada (Kirkpatrick et al., 2017). Overall participants were receptive to completing ASA24, although the ASA24 interface and the steps in completing the recalls were not necessarily intuitive, especially for younger children and elderly adults. The investigators emphasized the importance of piloting protocols using online tools and the potential need for tailored resources to support certain age groups.
In general, recall interviews can be conducted on children aged > 12y (Deitchler et al., 2020), and on most adults, except for persons with poor memories (e.g., some elderly). Parents are typically relied upon as proxy reporters for capturing dietary intake for children under five years of age. Children aged from 5–12y should be interviewed along with their primary caretaker, usually the mother, an approach termed assisted reporting. It may be necessary to interview several people if the children are at school, day-care, or play in the homes of friends, to ensure that all foods eaten away from home are reported. Recipe data for school or day-care meals may be required to supplement the food intake data collected in the home. In a study of Canadian preschool children 2–5y in which parents used the online self-administered 24h recall (ASA24), they were able to report the food and beverages that their child had consumed with reasonable accuracy but the accuracy of portion size estimates was low (Wallace et al., 2018).
In the end, the success of the 24h recall, irrespective of the method applied, depends on the respondent's memory, their ability to convey accurate estimates of portion sizes consumed, the degree of motivation of the respondent, and the persistence of the interviewer (Acheson et al., 1980).
3.1.2 Repeated 24h recalls
Twenty-four-hour recalls can be repeated to estimate the average food intake of individuals over a longer time period (i.e., usual food intake). The number of 24h recalls required to estimate the usual nutrient intake of individuals depends on the day-to-day variation in food intake within one individual (i.e., within-person variation ). In turn, this variation is affected by the nutrient under study, the study population, and seasonal variations in intake.Repeated 24h recalls were recommended as part of a system for measuring food consumption patterns in the United States to account for within-person variability as early as 1981 (NRC, 1981). In the US NHANES 2011–2014, food intakes on two non-consecutive days were recorded, on the first day through using computer-assisted personal recall interviews (CAPI), and on the second day via a computer-assisted systematic telephone interview (CATI), using the AMPR on both occasions (Amoutzopoulos et al., 2018). The second recall interviews were not conducted on all respondents, but instead were repeated on a randomly selected subsample of the population. Tooze (2020) recommends that the repeated 24h recalls should be performed on non-consecutive days 3–10d apart, and when only a random subsample of the population is used, repeated on at least 50 individuals per stratum. Moreover, when episodically consumed foods, food groups or nutrients are of particular interest, then more replicates per person should be collected rather than increasing the sample size from which two replicates are obtained (Tooze, 2020).
Repeated 24h recalls assisted by interviewers were also used for the Dutch National Food Consumption Survey (DNFCS) (van Rossum et al. 2016) and the French Nutrition and Health Survey (Castetebon et al., 2009). Several research groups in the UK have incorporated new technologies to collect 24h recalls, including the two web-based methods, myfood24 (Carter et al., 2015) and INTAKE24 (Simpson et al., 2017); see Section 3.2.3 for more details.
3.1.3 Estimated food records
For the estimated food record, also referred to as a food diary by some researchers, the respondent is asked to record in household measures, at the time of consumption, all foods and beverages eaten (including snacks), for a specified time period. Detailed descriptions of all foods and beverages (including brand names) and their method of preparation and cooking should also be recorded. For mixed dishes such as Spaghetti Bolognese, the amount of each raw ingredient used in the recipe, the final weight of the mixed dish, and the amount consumed by the respondent should be recorded, wherever possible. The information is recorded on a form similar to that shown in Appendix 3-1 , except that household measures are used for food amounts. Usually, the respondent, parent, or caretaker completes the food record, although in low or middle-income countries a local field investigator may perform this task (Dufour et al., 1999). Reactivity, defined as a change in behavior due to awareness that behavior is being or will be measured, may be an issue with this method. The respondent has the opportunity to modify his or her “usual” diet, potentially in a more socially desirable manner or to simplify the recording task (Thompson et al., 2015) (Chapter 5).Food portion sizes can be estimated by the respondent in a variety of ways. Standard household measuring cups and spoons should be used if possible, supplemented by measurements with a ruler (for meat and cake) and counts (for eggs and bread slices). Unfortunately, errors may arise because the respondent may fail to quantify portion sizes correctly. Additional errors may also arise during the conversion of volumes to weights (Chapter 5), although this latter step is usually completed by the investigator. Details on how to convert portion sizes to weight equivalents are given in Gibson and Ferguson (2008) and Vossenaar et al. (2022).
The number of days included in an estimated record varies, depending on the study objective. When the objective is to obtain an average intake for a group, then only one day per person is required, provided all days of the week are equally represented in the final sample. However, when estimates of usual intakes of each person are required, then the number, selection, and spacing of the days required per person depends on the factors described for the repeated 24h recall (Section 3.1.2). Weekend days should always be proportionately included in the dietary survey period for each person, to account for potential day-of-the-week effects on food and nutrient intakes. This problem is discussed in more detail in Chapter 6.The European Prospective Investigation of Cancer (EPIC) study in Norfolk, U.K. collected food and nutrient intakes from 2117 men and women using a 7d estimated food diary. EPIC was a large multicenter prospective study aimed at investigating the relationship between nutrition and various life-style factors and the etiology of cancer and other chronic diseases. The study involved 23 regional centers located in ten countries, and involved a total cohort of about 480,000 subjects. The respondents of the EPIC study in Norfolk were provided with a “diet diary” — a 45-page colored booklet in which they were asked to record the description, preparation, and amounts of foods eaten over seven consecutive days. Food portion sizes were estimated by the respondents in terms of household measures, with the help of 17 sets of color photographs of small, medium, and large portions of the different foods. See Vossenaar et al. (2020) for guidance on the development of food photographs for portion size estimation. Details on the EPIC study in Norfolk Details are given in (Bingham et al., 2001). The Danish National Survey of Diet and Physical Activity (4–75y) also used a seven-day estimated food diary with a paper format (Pedersen et al., 2015).
A four-day estimated food diary, recorded using a paper form, is used by the U.K. National Diet and Nutrition Survey rolling program. This is a continuous cross-sectional survey designed to collect detailed information on food and nutrient intakes and nutritional status for a range of ages and across the social strata in the UK. The field work for this rolling program began in 2008 and is on-going with about 1000 people surveyed per year (Ziauddeen et al., 2018).
3.1.4 Weighed food records
Weighed food records are more frequently used in the United Kingdom and Europe because weighing scales are often used for food preparation in these regions. In the earlier British National Diet and Nutrition Surveys of adults and children (Ashwell et al., 2006), seven-day weighed food records were used. However, when the rolling program was introduced in 2008, the seven-day weighed food records were replaced by a four-day estimated food diary due to concerns about respondent burden.A weighed food record is the most precise method available for estimating usual food and nutrient intakes of individuals. It is the preferred method when diet counseling or correlation of intakes with biological parameters are involved. In a weighed record, the subject, parent, or caretaker is instructed to weigh all foods and beverages consumed by the subject during a specified time period. Details of methods of food preparation, description of foods, and brand names (if known) should also be recorded. For mixed dishes such as Spaghetti Bolognese, the weight of the portion consumed should be recorded, along with the weights and description of all the raw ingredients, including flavors and spices used in the recipe, as well as the final total weight of the mixed dish. The method of recording is similar to that shown for a 24h recall (Table 3.1), with the weight of the food items being recorded under "Amount."
If occasional meals are eaten away from home, respondents are generally requested to record descriptions of the amounts of food eaten. The nutritionist can then buy and weigh a duplicate portion of each recorded food item, where possible, to assess the probable weight consumed. Alternatively, if appropriate, the nutritionist can telephone a restaurant to obtain details of the portion sizes consumed.
As with the estimated record, the number, spacing, and selection of days necessary to characterize the usual nutrient intakes of an individual using the weighed record depend on the within-person variation in food intake, which, in turn, depends on the nutrient of interest, the study population, and any seasonal variation of intake. Again, week-end days should be proportionately included to account for any weekend effect on the nutrient intake. If a weighed food record method is to be used, respondents must be motivated, numerate, and literate. Reactivity may be an issue with this method, and interfere with the assessment of usual dietary intake. Respondents may change their usual eating pattern to simplify the weighing process or, alternatively, to impress the investigator (Cameron and van Staveren, 1988; Thompson et al., 2015) (Chapter 7). In addition, respondent burden for a weighed food record is higher than for an estimated record or for a 24h recall, so individuals may be less willing to cooperate. Reproducibility, however, is greater in the weighed record than in the estimated record method because the portion sizes are weighed, although significant underreporting (Chapter 5) may still occur.
3.1.5 Dietary history
The dietary history method (Burke, 1947) attempts to estimate the usual food intake and meal pattern of individuals over a relatively long period of time — often a month. This interview method was originally designed to be carried out by a nutritionist trained in interviewing techniques. More recently, computerized versions have been developed which provide standardized methods for data collection and probing, and minimize potential interviewer bias in responses (Kohlmeier et al., 1997).Initially, the dietary history had three components. The first component was an interview about the usual overall eating pattern of the subject, both at mealtimes and between meals. Such information included detailed descriptions of foods, their frequency of consumption, and usual portion sizes in common household measures. “What do you usually eat for breakfast?” is a typical question that might have been included in the interview.
The second component served as a crosscheck and consisted of a questionnaire on the frequency of consumption of specific food items. This part was used to verify and clarify the information on the kinds and amounts of foods given as the usual intake in the first component. Questions asked related to specific foods, such as: "Do you like or dislike milk." A 24h recall of actual intake may also have been included at this stage.
In the third component, subjects recorded their food intake at home for three days. Portion sizes at this stage were estimated using a variety of techniques, including standard measuring cups and spoons, common utensils, commercial plastic food models, photographs, or real foods. Today, the original dietary history method is seldom used in this three-part format, the third component being commonly omitted.
The time periods covered by the dietary history method vary. The maximum time period that can be used has not been definitely established. When shorter time frames (i.e., one month) are used, reproducibility and validity are apparently higher than for longer periods (see Chapter 7). Measurements of food intake over one-year periods are probably unrealistic unless seasonal variations in food intakes are taken into account.
Dutch investigators used a three-part dietary history method covering one month to record usual food consumption on weekdays, Saturdays, and Sundays separately (van Staveren et al., 1985). This approach takes into account the potential effect of weekends on nutrient intake. The portion size of foods most frequently consumed in this study were weighed by a dietitian in the home. A weighted daily average intake was then calculated from the data, using the following formula:
\[\small ((5 × \mbox{Weekday}) + \mbox{Saturday} + \mbox{Sunday}) / 7 \]A modified version of this dietary history method was adopted in the Survey in Europe on Nutrition in the Elderly: A Concerted Action (SENECA). This multicenter survey was designed to examine cross-cultural variations in the nutrition, lifestyle, health, and performance of elderly Europeans (Euronut - SENECA, 1991). The method involved the completion of a three-day estimated record, followed by an interview during which respondents were questioned about their usual dietary intake over the past month. Portions of the most commonly eaten foods were weighed by the interviewer (van Staveren et al., 1996).
The recording of a dietary history can be very labor intensive, with interviews taking up to 2h per respondent (Slattery et al., 2000). Several investigators have reported that the dietary history tends to overestimate nutrient intakes, when compared with results from weighed records. Nes et al. (1991), for example, used the dietary history developed for the SENECA study and showed that the method generated consistently higher intakes of energy and nutrients than three-day weighed records. Livingstone and Robson (2000) reported similar findings in a study of children and adolescents, but claimed that the results obtained from the dietary history were more representative of habitual intake than those obtained from seven-day weighed records. In general, because dietary histories, unlike food frequency questionnaires, do not limit the variability in the responses, they overcome many of the limitations of a food frequency questionnaire. However, the absence of a standardized format for the dietary history method limits comparison of its usefulness across studies (Thompson et al., 2015).
3.1.6 Food frequency questionnaire
The food frequency questionnaire, sometimes referred to as a diet history questionnaire, aims to assess the usual frequency with which food items or food groups are consumed during a specified time period. It was originally designed to provide descriptive qualitative information about usual food-consumption patterns. With the addition of portion-size estimates and the introduction of improved computerized self-administered questionnaires, the method has become semi-quantitative, allowing the derivation of energy and selected nutrient intakes (Willett et al., 1985; Block et al., 1986).In its simplest form, the questionnaire consists of a list of foods and an associated set of frequency-of-use response categories ( Appendix 3-2 ). The list of foods may focus on specific groups of foods, particular foods, or foods consumed periodically in association with special events or seasons. Alternatively, the food list may be extensive to enable estimates of total food intake and dietary diversity to be made. The frequency-of-use response categories may be daily, weekly, monthly, or yearly, depending on the study objective.
Specific combinations of foods can be used as predictors for intakes of certain nutrients or non-nutrients, provided that the dietary components are concentrated in a relatively small number of foods or specific food groups. Examples include the frequency of consumption of fresh fruits and fruit juices as predictors of vitamin C intake (Tsugane et al., 1998), green leafy vegetables and carrots (O'Neill et al., 2001), or fruit and vegetable intake as predictors of carotenoid intakes (Whitton et al., 2017), whole grain cereals, legumes, nuts, fruits, and vegetables as predictors of dietary fiber intakes (Merchant et al., 2003), and dairy products as predictors of calcium intakes (Barr et al., 2001; Horiuchi et al., 2019). The method can also be used to assess the intake of fats and cholesterol (Feunekes et al., 1993; Eng and Moy, 2011; Riordan et al., 2018), artificial sweeteners (Dewinter et al., 2016), certain contaminants present in specific foods (MacIntosh et al., 1997; Filippini et al., 2018), alcohol (Bazal et al., 2019), and condiments (Leyvraz et al., 2018).
The food frequency questionnaires should feature simple, well-defined foods and food categories. Open-ended questions should be avoided as preformatted lists of food categories act as a memory prompt. The method may use a standardized interview, a self-administered machine-readable printed questionnaire, or a computer-administered questionnaire. Most questionnaires usually list 80 to 120 individual items and take from 15–30 minutes to complete (see abbreviated example given in Appendix 3.2). Hence, the food frequency questionnaire imposes less burden on respondents than most of the other dietary assessment methods. The results are easy to collect and process and are generally taken to represent usual intakes over an extended period of time, and hence are not affected by day-to-day variability. As food frequency questionnaires are designed to provide retrospective information about diet, they are often used in retrospective case-control studies (Schink et al., 2019). However, their validity and feasibility for estimating food intakes in the remote past has not always been clearly established (van Staveren et al., 1986; Dwyer and Coleman, 1997; Ambrosini et al., 2003; Barrett et al., 2019).
Food scores can be calculated from qualitative food frequency data and the frequency of consumption of certain food groups (Gil et al., 2015). The 2015–2020 US Dietary Guidelines for Americans or an equivalent standard such as the WHO Healthy Diet, list the optimum number of servings of the major food groups per person per day, and serve as a basis for the scores. The scores can then be examined in relation to psychosocial influences (e.g., level of education, income), as well as vital statistics, season, geographic distribution, and biomarkers of dietary patterns (Playdon et al., 2017).
WHO has issued guidelines on a Healthy Diet (WHO, 2020). A (Healthy Eating Index) (HEI‑2015) has been developed by the USDA, that measures alignment of US diets with the 2015‑2020 Dietary Guidelines for Americans. The HEI‑2015 has 13 dietary components in total, of which nine are “adequacy” components (those recommended for inclusion in a healthy diet) and four “moderation” components that should be consumed sparingly. These dietary components are listed in Table 3.3.| HEI–20151 Components & Scoring Standards | |||
|---|---|---|---|
| Component | Max. points | Standard for max. score (per 1,000 kcal) | Standard for min. score (0) |
| Adequacy | |||
| Total Fruits2 | 5 | ≥ 0.8 cup equiv. | No Fruit |
| Whole Fruits3 | 5 | ≥ 0.4 cup equiv. | No Whole Fruit |
| Total Vegetables4 | 5 | ≥ 1.1 cup equiv. | No Vegetables |
| Greens and Beans4 | 5 | ≥ 0.2 cup equiv. | No Dark Green Veg. or Legumes |
| Whole Grains | 10 | ≥ 1.5 oz equiv. | No Whole Grains |
| Dairy5 | 10 | ≥ 1.3 cup equiv. | No Dairy |
| Total Protein Foods6 | 5 | ≥ 2.5 oz equiv. | No Protein Foods |
| Seafood and Plant Proteins6,7 | 5 | ≥ 0.8 oz equiv. | No Seafood or Plant Proteins |
| Fatty Acids8 | 10 | (PUFAs + MUFAs) /SFAs ≥ 2.5 | (PUFAs + MUFAs) /SFAs ≤ 1.2 |
| Moderation | |||
| Refined Grains | 10 | ≤ 1.8 oz equiv. | ≥ 4.3 oz equiv. |
| Sodium | 10 | ≤ 1.1 gram | ≥ 2.0 grams |
| Added Sugars | 10 | ≤ 6.5% of energy | ≥ 26% of energy |
| Saturated Fats | 10 | ≤ 8% of energy | ≥ 16% of energy |
Kant et al. ( 2000) used food frequency information to calculate a “Recommended Food Score” (RFS) to evaluate the consumption of foods considered to be consistent with the U.S dietary guidelines existing at that time. In a prospective study of diet quality and mortality in women from the United States, they showed that the RFS was inversely associated with all‑cause mortality. Since that time, the RFS has been used in Australia as a diet quality index for preschoolers (Burrows et al., 2014), and in Korea to investigate links with physical performance among the elderly (Jeong et al., 2019), and depression, anxiety, and quality of life (Lee et al., 2019).
Many recent users of food frequency questionnaires have quantified portion sizes of food items of interest, often using photographs (Nelson et al., 1994; Amougou et al., 2016). Portion sizes can be ranked as small, medium, and large, preferably based on age and sex-specific portion size data generated from country-specific national nutrition surveys (Willet et al., 1985; Block et al., 1986; Bohlscheid-Thomas et al., 1997). Note that inclusion of information on portion sizes produces semi-quantitative food frequency data (Appendix 3-3 ). This can be converted to data on energy and nutrient intakes by multiplying the fractional portion size of each food consumed per day by its energy and nutrient content, obtained from appropriate food composition data. The results are then summed to obtain an estimate of an individual's total daily energy and nutrient intake.
Block et al. (1986) derived a food list for a food frequency questionnaire with portion sizes from the NHANES II results. Food items selected were based on the frequency of consumption of certain specific food items and which contributed significantly to the total population intake of energy and each of 17 nutrients. Serving sizes were estimated from observed portion size distributions in the NHANES II data. Medium serving sizes for each food were specified in the food frequency questionnaire, and the respondent indicated whether his or her usual serving size was small, medium, or large, as shown in Appendix 3.3. A specialized food composition database was developed for use with this food frequency questionnaire. A very similar approach has been used to design semiquantitative multi-ethnic food frequency questionnaires (Deurenberg-Yap et al., 2000; Beukers et al., 2015).An improvement to the Block food frequency questionnaire termed the Diet History Questionnaire (DHQ) has been developed. The DHQ consists of 124 food items, portion sizes, and dietary supplement questions and takes one hour to complete. Results of a comparative validity study showed that the performance of the DHQ is better than that of the food frequency questionnaires of both Block and Willett (Subar et al., 2001).
The semi-quantitative food frequency questionnaire has become a widely used tool in dietary assessment. Country-specific semiquantitative food frequency questionnaires containing between 130 and 300 food items were used in the EPIC study to estimate individual usual food intakes (Margetts and Pietinen, 1997). In the EPIC study in Norfolk, U.K. (Bingham et al., 2001) respondents (n = 23,003) estimated how frequently foods were eaten over the past year, from nine possible frequency-of-use response categories from a list of 130 foods. Reduced versions containing only 60 food items that require only 17 min to administer by an interviewer are available; even the full 98‑item Block questionnaire requires only 30‑35 min of interviewer time (Block et al., 1990). In some countries, a semi-quantitative food frequency questionnaire has been used in national nutrition surveys (e.g., 1995 Australia National Dietary Survey) (Williams, 2005).
More recently in Australia, an on-line suite of validated semi-quantitative food frequency questionnaires, the Australian Eating Surveys (AES) have been developed. The AES is a 120‑item food frequency questionnaire with fifteen supplementary questions, including food and sedentary behaviors and supplements, with the aim of capturing the usual dietary intakes of children, adolescents, and adults over the previous six months. The AES takes only 15‑20 min to complete on-line and can generate a personalized dietary feedback in real time as an incentive to encourage participation and enhance the response rate (Collins et al., 2014).
In many low-income countries no national food consumption surveys have been conducted so the key information needed to develop a food frequency questionnaire is often not available. Such information includes a listing of foods commonly consumed in the study population, details on the way the foods are typically prepared or consumed, and the usual range of portion sizes consumed. In response to this need, Hotz and Abdelrahman (2019) have developed some simple methods to obtain food listing and portion size distribution estimates for use in semi-quantitative food frequency questionnaires.
|
Odds Ratios (95% CIs) for poor Subjective
Cognitive Function (SCF), compared with good function, associated with total vegetable, fruit, and fruit juice intakes | |||||
|---|---|---|---|---|---|
| Quintile of intake (n = 27,842 men) | Q1 | Q2 | Q3 | Q4 | Q5 |
| Total vegetable intake Median, servings/d | 1.7 | 2.5 | 3.2 | 4.1 | 5.7 |
| Odds Ratio 95% Confidence Interval | Ref | 0.92 (0.79, 1.08) | 0.85 (0.73, 0.99) | 0.71 (0.60, 0.83) | 0.62 (0.52, 0.74) |
| Total fruit intake Median, servings/d | 0.5 | 1.1 | 1.5 | 2.0 | 3.1 |
| Odds Ratio 95% Confidence Interval | Ref | 1.00 (0.85, 1.18) | 0.96 (0.81, 1.13) | 0.81 (0.68, 0.96) | 0.79 (0.66, 0.94) |
| Total fruit juice intake Median, servings/d | 0.1 | 0.4 | 0.7 | 1.0 | 1.5 |
| Odds Ratio 95% Confidence Interval | Ref | 0.78 (0.67, 0.91) | 0.81 (0.70, 0.94) | 0.66 (0.57, 0.77) | 0.65 (0.55, 0.76) |
Box 3.1 summarizes the five methods discussed above that can be used to assess the food consumption of individuals and their uses and limitations. For a more detailed review of the strengths and weaknesses of each of these methods for use in low- and middle-income countries, see (FAO, 2018).
24h recall. Subject or caretaker recalls food intake of previous 24h in an interview. Quantities estimated in household measures using food models as memory aids or to assist in quantifying portion sizes. Nutrient intakes calculated using food composition data.
- Uses and Limitations Useful for assessing average usual intakes of a large population, provided that the sample is truly representative and that the days of the week are adequately represented. Used for international comparisons of relationships of nutrient intakes to health and susceptibility to chronic disease. Inexpensive, easy, quick, with low respondent burden so that compliance is high. Large coverage possible; can be used with illiterate individuals. Element of surprise so less likely to modify eating pattern. Single 24h recalls likely to omit foods consumed infrequently. Relies on memory and hence unsatisfactory for the elderly and young children. Multiple replicate 24h recalls can be used to estimate the usual intakes of individuals.
- Uses and Limitations Used to assess actual or usual intakes of individuals, depending on number of measurement days. Data on usual intakes used for diet counseling and statistical analysis involving correlation and regression. Accuracy depends on the conscientiousness of subject and ability to estimate quantities. Reactivity may be an issue. Longer time frames result in a higher respondent burden and lower cooperation. Subjects must be literate unless a trained researcher conducts the estimated food record in the home.
- Uses and Limitations Used to assess actual or usual intakes of individuals, depending on the number of measurement days. Accurate but time consuming. Setting must permit weighing. Subjects may change their usual eating pattern to simplify weighing or to impress investigator — termed — reactivity. Requires motivated, and willing participants. Expensive. For illiterate participants, weighed food records can be conducted by a trained research assistant in the home.
- Uses and Limitations. Used to describe usual food or nutrient intakes over a relatively long time period, which can be used to estimate prevalence of inadequate intakes. Such information is used for national food policy development, for food fortification planning, and to identify food patterns associated with inadequate intakes. Labor-intensive, time-consuming, and results depend on skill of interviewer. The absence of a standardized format limits comparison of its usefulness across studies.
- Uses and Limitations Designed to obtain qualitative, descriptive data on usual intakes of foods, classes of foods, or nutrients (if semi-quantitative) over a long time period. Useful in epidemiological studies for ranking subjects into broad categories of low, medium, and high intakes of specific foods, food components, or nutrients, for comparison with the prevalence or mortality statistics of a specific disease. Can also identify food patterns associated with inadequate intakes of specific nutrients. Method is rapid, with low respondent burden and high response rate, but accuracy is lower than for other methods.
3.2 Technical improvements in food consumption measurements
The increasing evidence of the relationship between diet and chronic disease has led to a number of technical advances in measurements of food consumption for individuals. They include the use of the telephones in surveys, digital photographs of food portions displayed on a computer/tablet or captured with a cell-phone camera, as well as web-based tools, mobile apps, and image-based assessment. These innovative technologies aim to improve the speed, accuracy, and participation, and reduce reporting burden, bias, and the cost of collecting and analyzing dietary intake data during large scale epidemiological studies as well as national surveys. A summary of the strengths and limitations of these innovative technologies designed to improve dietary assessment methods is shown in Table 3.5.| All innovative technologies used in dietary assessment | |
|---|---|
| Strengths | Limitations |
|
Costs for data collection can be lower (less need for person-to-person interaction) |
Larger up-front investments (i.e. purchase of mobile phones, cameras, computers, software development, etc.) |
|
Convenient for users, good acceptability, may improve compliance | Risk of losing devices |
| Do not rely on respondent's memory |
Risk of technical problems (i.e. low battery, loss of Internet connection) could impede data collection |
|
Record of qualitative information (e.g. date and time of recording) |
A backup method is required to collect information, if technical problems occur |
|
Significantly cuts down data processing time | |
| Personal Digital Assistant (PDA) | |
| Strengths | Limitations |
|
Is portable and can be easily carried by study participants |
Face-to-face training of the participants is required |
|
Facilitates real-time data collection, entry and coding |
Low level of dietary data details because of pre-coded food listings |
|
It is possible to set an alarm within the PDA to alert participants to record their food intake |
Increases the respondent burden compared with pen and paper records, due to the extensive list of foods (depending on each PDA) |
|
Can be programmed to allow partic- ipants strict access to the dietary intake software only |
Reports of difficulty using the search function and inability to find certain foods |
| Image-assisted methods i.e. digital photographs | |
| Strengths | Limitations |
| Easy to use |
Participants may forget to take some images |
|
Suitable for low literacy populations (if the technologies are easy-to-use, e.g. digital cameras) |
Not all information can be captured with a single photograph/image |
|
Quality of digital cameras keeps improving and pictures with higher resolutions can help improve the accuracy of analysis |
Difficulties in estimating portion size of food consumed from common mixed dishes |
|
Suitable for subjects with memory impairments and for children | Lack of details about cooking methods |
|
Lower under-reporting compared with some traditional methods |
Probably more limited accuracy for countries with a wide range of mixed dishes (e.g. Asia) Still needs a written record of foods obscured in photos, and when details of ingredients are required |
| Image-assisted methods i.e. mobile-based technologies | |
| Strengths | Limitations |
|
Possible higher quality control of data because of shorter delays and real-time responses |
It is costly and time-consuming to develop the application as an interface, and the software for automated portion size estimation |
| Possibility of sending reminders |
Certain types of foods, such as mixed dishes (soups, stews, casseroles, etc.) can be difficult to analyse with automated image analysis |
|
Internet access would allow respondents to send instant photos, thus minimizing systematic mistakes |
Requires certain level of literacy Requires network/Internet access (for real-time data collection) |
| Interactive computer and web-based technologies | |
| Strengths | Limitations |
|
Efficiency in terms of recording information and data processing (i.e. reduced costs and interviewer workload) |
Some imaging algorithms presently fail to identify foods correctly and to accurately estimate the quantity of food in the computerized images |
| Increased levels of quality control |
Need adaptation of the software to local settings |
|
Include interactive visual and audible aids |
Require high levels of literacy and computer skills from the participants |
|
Suitable for large, geographically dispersed samples; can include different countries/languages (web-based) |
Possibility of collecting less food details (i.e. ingredients, methods of preparation, etc.) |
|
Data processing can be finalized at any time and location (web-based) Can provide personalized dietary feedback (web-based) Possibility of sending interactive reminders (web-based) | Require Internet access (web-based) |
3.2.1 Telephone
A telephone survey that is well-designed and carefully-administered appears to be a promising method of obtaining dietary information. In particular, telephoned 24h recalls are being increasingly used. The USDA has conducted several studies to examine the feasibility of using telephone follow-up surveys instead of mail follow-up for 24h recalls. Results have been promising: response rates for telephone follow-up were much greater than those for mail follow-up. Casey et al. (1999) carried out a validation study in which the results of 24h recalls conducted over the telephone were compared with in-person recalls collected in the 1994-1996 USDA Continuing Survey of Food Intakes by Individuals; strong correlations were reported. As a result, since 2002 NHANES have used the telephone to administer the second recall day 3–10d later using the AMPR method (Hennigar et al., 2018).Several other large-scale telephone dietary surveys have been used in the United States, some of which have used a food frequency instrument rather than a 24h recall. Lyu et al. (1998) successfully showed that agreement between telephone and face-to-face interviews of a semi-quantitative food frequency questionnaire in Hawaii made up of 115 food items was good and unaffected by age, gender, ethnicity, or education of the respondents. These investigators did recommend mailing photographs of foods in three portion sizes in advance, to help respondents estimate amounts eaten more accurately.
Many of the smaller telephone dietary studies have been conducted on adult women (Casey et al. 1999; Tran et al., 2000; Yanek et al., 2000). Very few have been carried out on adolescents and adult men (Bogle et al., 2001). In college students, food intakes by telephoned recalls have been compared against actual intakes determined surreptitiously in the college cafeteria (Krantzler et al., 1982). More studies are needed, however, among certain life-stage groups, to establish the validity of 24h recalls or food frequency questionnaires administered over the telephone. Under-reporting of self-reported food intakes may still occur in telephone recalls, as they do with in-person recalls; this was observed, for example, when total energy intakes derived from telephone-administered 24h recalls were compared with total energy expenditure measured by doubly labeled water (Tran et al., 2000) (see Chapter 7).
Telephone surveys do have several advantages. These include their ability to reach a large number of persons at perhaps less than half the cost of face-to-face surveys. As well, with the advent of computer-assisted telephone interviewing, the interviews can be readily standardized, queries can be clarified, and responses can be coded immediately, during an interviewing time that is much shorter than a face-to-face interview. As a result, the response rate is enhanced.
Potential interviewer biases can be eliminated by using computer-assisted telephone interviewing, an approach used with the AMPR in the NHANES surveys. However, other sources of bias may occur with telephone surveys; these may arise from noncoverage and nonresponse. In the United States, although over 87% of the population owns a telephone, subgroups such as the poor, certain minorities, and the` elderly still have fewer telephones than the general population. Such differential coverage can introduce bias in national surveys unless alternative compensating strategies are employed. Strategies may include using supplementary face-to-face or mail interviews for persons without telephones; statistical adjustments employing weighting for sex, age, race, and income; selective over-sampling of the non-telephone users; and random-digit dialing to contact those with unlisted numbers. Nonresponse is also a source of potential bias that influences telephone surveys. This is especially a problem among certain subgroups such as the ethnic minorities for whom language barriers may be considerable, the elderly who may have hearing difficulties, and persons with less education.
Despite these limitations, telephone dietary surveys are a practical, economical, and valid alternative to the conventional face-to-face methods for large-scale epidemiological studies and nutrition surveys and for developing and evaluating community-based nutrition interventions in higher income countries.
3.2.2 Portion size estimation aids
Errors in quantifying the portions of food consumed are often the largest error in most food consumption surveys, unless weighed food records are used. As a result, several types of portion-size measurement aids (PSMAs) have been developed in an effort to enhance the accuracy of portion size estimates (see Chapter 5 for more details). PSMAs can be divided into two categories: (1) non-photographic aids and (2) photographic aids. Canada was one of the first countries to use non-photographic aids in its National Nutrition Survey in 1973. The aids consisted of a collection of three-dimensional graduated food models of various volumes and surface areas prepared from paper-mache, wood, or hardboard. A range of graduated food models was used to prevent the tendency to generate a “direct” response. The latter phenomenon is observed when plastic food models representing only “average” portion sizes are used (Samuelson, 1970). The Canadian surface-area models were accompanied by standard thickness indicators made of hardboard squares. These were used during the 24h recalls to assist in assessing the overall size and thickness of foods such as cheese, cold meats, cakes and cookies. Use of thickness indicators is critical for assessing portion sizes of intact cuts of meat, especially when irregular in shape. Since 1973, graduated food models (Figure 3.2)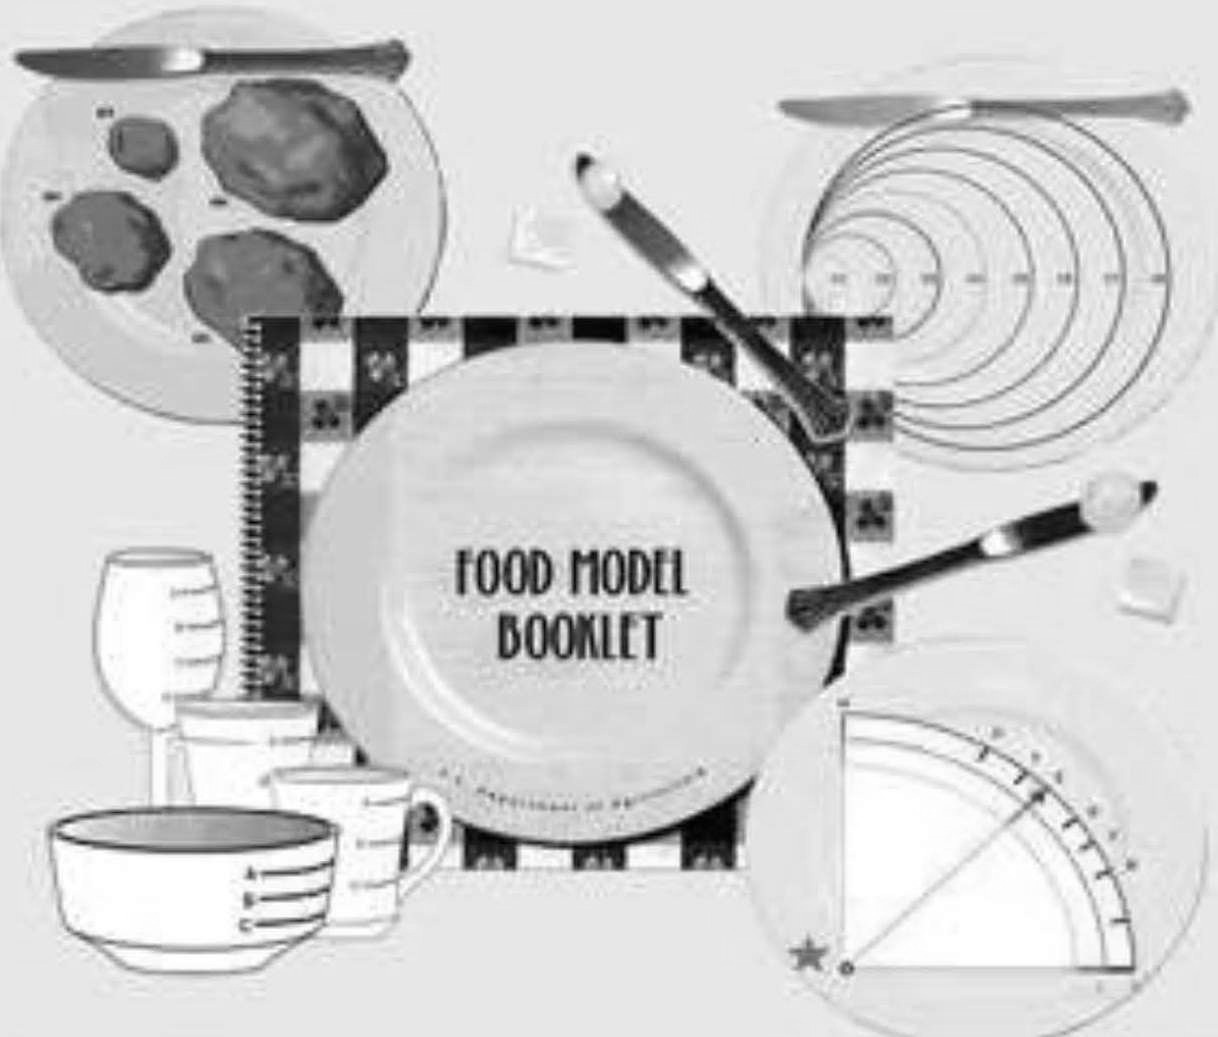
Practical guidelines on how to develop a photographic atlas are given by Nelson and Haraldsdottir (1998) and Vossenaar et al. (2020). Factors that must be considered in relation to the format of the photographs include size of the image, number and range of portions sizes depicted, and the interval between portion sizes. In the EPIC study, for example, there was a 25% difference between portion sizes to allow a real visual perception of differences in size (Vilela et al., 2018). Nelson et al. (1994) used portion weights from the British Adult Dietary Survey ranging from the 5th to the 95th percentile for a series of eight photographs for each food. Other important factors that should be standardized include the order of presentation of the photographs, labels used, angle at which the photograph was taken, background and use of reference objects for scale, color versus black and white, and use of one versus several foods on a plate.
Increasingly digital photos of food portions with multiple images displayed on a computer or a tablet are replacing printed photos to reduce the cost of printing atlases and their transportation to different interview sites. Nichelle et al. (2019) compared the accuracy of three portion sizes (small, medium, large) from printed photographs in the Brazilian GloboDiet atlas with digital photos displayed on a computer screen for 20 foods selected from the Brazilian GloboDiet atlas. The mean error (difference between the estimated and true portions) was not significantly different between the printed and digital photos, with agreement on using the printed and digital photos being 91% and 90%, respectively.
During the development of the Internet-based, Automated, Self-Administered 24h recall (ASA24), Subar et al. (2012) investigated the best way to provide digital images as portion-size estimation aides. They compared the photographs said to represent portion sizes of foods consumed by the respondents on the previous day with the actual weights obtained by surreptitious weighing. The images were also varied by the angle in which the photographs were taken, the type of image, and the number and size of digital images presented in an effort to determine how best to present the digital images to facilitate accuracy. None of the photographs were labeled with portion-size information. Results indicated that accuracy was not affected by the type of image, whether the images were presented simultaneously vs. sequentially, or the size and number of images presented, although there was a tendency for eight rather than four images to be more accurate. Based on these results, aerial photographs are used for portion size estimation in the ASA24.
Alternatively, real-time images of foods and beverages consumed by the respondent, and captured passively, or actively with a cell-phone camera (Arab et al., 2011), digital camera (Lazarte et al., 2012), or wearable camera (Gemming et al., 2013), can be used as PSMAs during a 24h recall the following day. The active methods require the respondents to take pictures in the appropriate way (e.g., 45°angle, arms distance from the plate, with a size reference included for scale) before and after eating all meals, and to add accompanying notes. However, all of these tasks necessitate training the respondents. As a result, for low-literacy populations, the passive techniques are more suitable, where an individual wears a camera to capture photographs, thus requiring less involvement by the respondent.
In many food consumption surveys in both lower and higher income countries, a mixture of non-photographic and photographic aids have been used as PSMAs. A systematic review that included both non-photographic and photographic PSMAs concluded that culturally appropriate digital or hard-copy photographic PSMAs were more accurate than non-photographic food models and household utensils (Amoutzopoulos et al., 2020). The investigators also emphasized when selecting an appropriate tool for estimating portion sizes, both the setting and population under study must be considered. Most of the studies included in this review were from high income countries. In a study in rural Bolivia, however, the mean energy and nutrient intakes of 45 women (20–52y) obtained using an interviewer-administered atlas of graduated photos of local foods combined with digital food photographs taken by the respondents on the day prior to the 24h recall, were compared with those derived from a weighed record. No significant mean differences were reported in estimated and actual food amounts between the 24h recall using the food photo album and the digital photographs and weighed food records, except for a few foods (rice, potatoes, eggs, vegetables). For the latter foods, differences ranged from −5.4% for vegetables to −6.8% for rice. However, there was a slight underestimation in values between the two methods for some nutrients (Lazarte et al., 2012).
3.2.3 Web-based systems for dietary assessment
| Web-based 24-h dietary recall tools for dietary assessment | ||
|---|---|---|
| Author | Tool (Country) | Notes (All tools use photographs to aid portion size estimation) |
| (Cade, 2017), |
(myfood24),
(UK) | Large database with generic and branded food items; meal-based approach; simplified AMPM approach, |
|
(Bradley et al., 2016), |
(INTAKE24),
(UK) | Meal-based approach; based on AMPM approach; Multipass recall for subjects 11–24y. |
|
(Lassale et al., 2015), |
(France) | Web-based 24h diet record; Food portion pictures for 250 foods |
|
(Thompson et al., 2015), |
(
ASA24),
(USA) | Meal-based approach; uses the five steps of the
AMPM; questions about food preparation; available in English and Spanish; optional supplement module |
|
(Arab et al., 2015), | DietDay (USA) | Multiple steps similar to the AMPM approach;
questions about food preparation; recording of supplements; provides dietary feedback |
|
(Biltoft-Jensen et al., 2014), | WebDASC (Denmark) | Self-administered tool for children 8–11y; animated; guides response to six eating occasions; 1300 foods selected via category browse or search. |
|
(Vereecken et al., 2014). | CANAA-W (Belgium) | A feasibility study on 131 children and 53 parents; to refine the lay out and structure of the tool; and the list of food items included. |
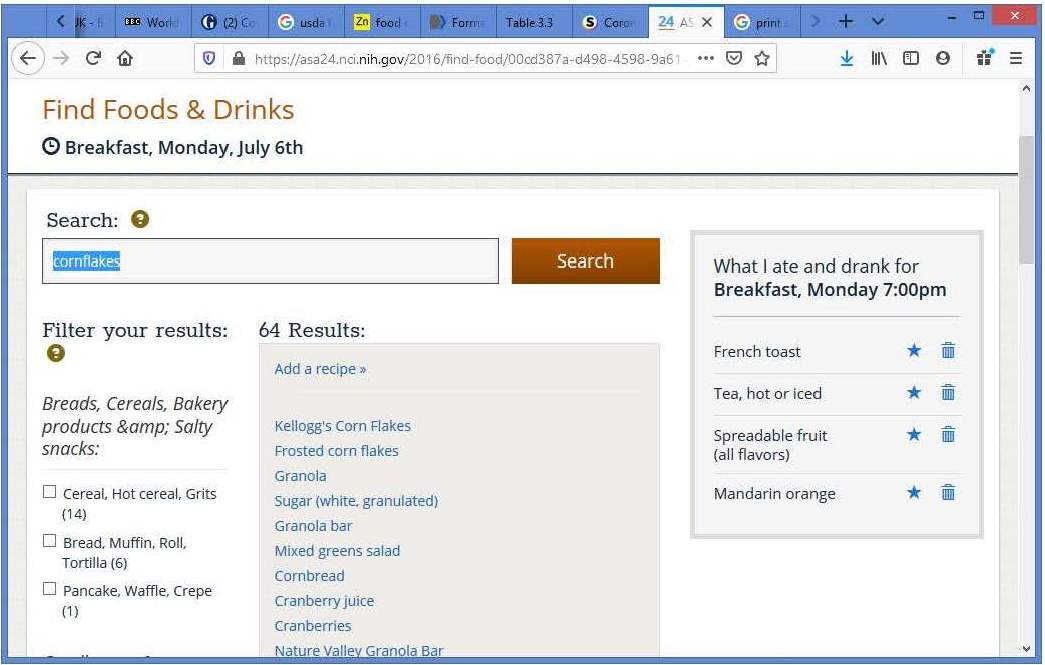
The use of automated 24h recall interviews in web-based systems standardizes the interviewing process so there is consistency in the format in relation to the questioning and sequence, food descriptors, and methods used to estimate food portion sizes. Some (e.g., ASA24; INTAKE24; myfood24) use a meal-based approach. Figure 3.3
Groupings of foods and recipes, as well as the level of detail used to describe foods varies across systems. In most of the applications, ingredients of mixed dishes are entered separately in either the raw or cooked form, with an option to select a generic mixed dish if the ingredients of the recipe are unknown. Some of these on-line systems use only food portion photographs to help respondents report the amount of each food consumed (e.g., ASA24; DietDay), whereas others (e.g., INTAKE24) use multiple options for portion size selection. These may include graduated photographs or images of actual foods, guide photographs for selected prepackaged items (e.g., snacks), with or without additional options such as photographs/pictures of household measures (glasses, cups, bowls, teaspoons etc.) Generally, additional automated prompts for potentially forgotten items are programmed and quality controls are implemented at each step of the interview procedure, with checks made on outlier values. Standardized algorithms are often used to calculate automatically grams of the food consumed, and the amounts of ingredients (either raw or cooked) consumed from a mixed dish. Some of the applications, especially for children, record the amounts served and leftovers rather than the amounts consumed. Most applications have a separate screen for describing and quantifying dietary supplements. Usually, at the end of the interview, a summary is displayed with the opportunity for the respondent to correct or edit information at each stage of the interview. Each web-based system is linked to an in-country food composition database, some of which include branded food items (e.g., ASA24, myfood24), with automated coding for those reported foods and beverages that are in the food composition database. Items not in the database are coded manually.
When developing web-based systems, the potential technology readiness of the user must be considered. Certain population groups, including older individuals with lower computer skills and technical experience, may have difficulty using a computerized assessment tool. Currently, only a few of these web-based 24h recall systems have undergone rigorous evaluation using either independent biomarkers (i.e., Intake24) (Foster et al., 2019), or measures of true intakes (i.e., ASA24) (Kirkpatrick et al., 2014), although for most when compared with the standard 24h recall method, agreement is generally close (Cade, 2017). More well-designed validation studies of web-based systems employing biomarker measures to investigate misreporting of dietary intakes, by age, educational level, BMI, and gender are needed before they can be applied in epidemiological studies involving multi-center sites (Illner et al., 2012).
In low-income countries where reliable internet access may be lacking, especially in rural areas, web-based methods are not feasible for assessing dietary intakes, especially when self-administered, due to the low literacy rates that often exist. To address these concerns in low-income countries, the International Dietary Data Expansion (INDDEX) Project has developed a dietary assessment platform called INDDEX24 (Coates et al., 2017). The platform consists of a mobile application for the collection of off-line individual-level dietary data using the 24h recall method with the AMPM, linked to a web database application so that the users can download the required country-specific food composition data. The dietary recall mobile application uses an open source mobile data collection platform (Commcare) so that it is accessible to researchers at no or low cost. The application is designed so that it is straightforward to use and contains a number of quality control features such as controls to prevent entry of implausible values, pre-defined portion-size estimation methods depending on the type of food reported, and real time calculation of the respondent's reported energy intake in order to identify possible under- and over-reported intakes (Burrows et al., 2014). The mobile app converts food portions reported in non-standard units into gram-weight equivalents by linking to context-specific portion size conversion factors housed within the web database (Coates et al., 2017). Both the performance and cost of a 24h recall using the INDDEX24 mobile app compared with a pen-and-paper 24h recall have been explored. See Rogers et al. (2022) and Adams et al. (2023) for further details.
3.2.4 Image-based methods of dietary assessment
These are defined as any method in which images are used for identifying foods, or for portion size estimation. Personal digital assistants (i.e., handheld computers) were used initially for these image-based methods, but have now been replaced by camera-enabled cellular phones or smartphones, digital, disposable, or 35mm cameras, wearable cameras, or digital video cameras. Many of these image-enabled devices rely on users manually taking photographs of foods (i.e., active image capture). Alternatively, for those methods termed “passive image capture”, pictures are automatically taken, usually at timed intervals (e.g., every 10 seconds) by the devices (predominantly wearable digital cameras), so that no intervention is required on the part of the user. The majority of tools that use active image capture have been designed for research purposes to enhance the accuracy of self-reported intakes. Fewer passive image capture methods exist and none is fully automated, most relying on specialists to manually estimate portion size (Gemming et al., 2015a).A few image-based methods are based on a combination of tools. Examples include: SmartPlate (SRI International, 2015), which consists of a camera and sensor-enabled dinner plate, the Diet Data Recorder System (DDSR), a three-part system comprised of a camera-enabled smartphone, laser module, and circuit module (Bell et al., 2017), and the Dietary Intake Monitoring System (DIMS). The latter is a five-part system with a digital camera, weighing scale, infrared thermometer, radio-frequency identification reader (RFID), and a user RFID transponder card (Ofei et al., 2014). Most of the image-based methods are portable. Exceptions are the DIMS which is mounted on a small cart and the SmartPlate which is dinner-plate size and hence less convenient to carry compared to the other smaller devices.
Image-based methods can be further subdivided into three groups: image-based food records, image-assisted food records, and image-assisted 24h recalls. Image-based food records are defined as methods in which images of foods captured during eating episodes serve as the entire basis for the dietary assessment, whereas in image-assisted food records, the images captured are used to enhance or supplement a traditional text-based food record (written or electronic). In image-assisted 24h recalls, the food images captured during eating episodes are used to aid self-reporting during the 24h recall. For more details of image-based methods, the reader is referred to the following reviews (Illner et al., 2012; Gemming et al., 2015a; Boushey et al., 2017).
Several studies have confirmed that image-based methods of dietary assessment are preferred over traditional dietary records, and can enhance self-reported dietary intake by revealing unreported foods and misreporting errors. However, study costs will be increased when respondents have to be provided with a suitable device (Gemming et al., 2015a). With the additional dietary information from the images, there is likely to be an increase in reported energy intake and a decrease in reporting errors, except when the methods are followed incorrectly so the images are of poor quality, or the user forgets to capture images before eating episodes. In addition, details of mixed dishes are difficult to extract from the images, some ingredients may be hidden, and cooking methods omitted. To avoid these problems, respondents should be trained to review the images after taking them, to take a second image if necessary, and to record descriptions of the mixed dishes, including lists of ingredients and quantities. Coding errors associated with image analysis, however, are likely to be less random and less problematic compared to the systematic bias observed when food type and portion size are self-reported.
Figure 3.4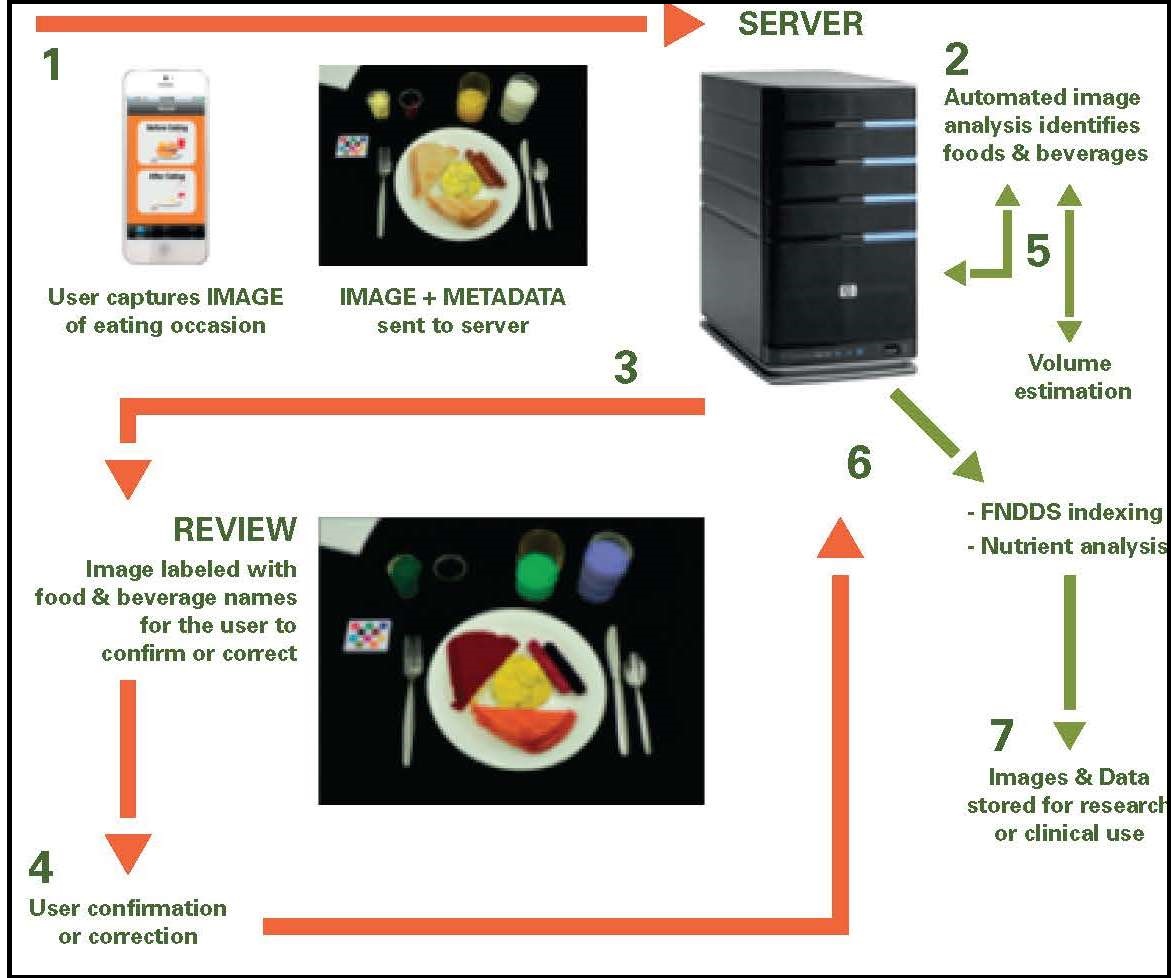
3.2.5 Wearable devices
Under development are wearable devices worn around the neck, wrist, ear, or attached to clothing and designed to objectively measure diet without relying on user-reported food intake (Fontana et al., 2015). Some (e.g., WearSens, worn around the neck) lack the ability to detect specific types of foods, and thus quantify nutrient intakes, while others (e.g., GoBe, worn as a wristband) only measure calories, fat, protein, and carbohydrate. Several chewing and bite-related wearable sensors are also being developed which aim to differentiate between food intake and non-food intake, with some aiming to estimate energy intake (e.g., BitBite) (Fontana et al., 2015). Discomfort has been reported by some users of these wearable devices which suggests that their format needs to be modified (Boushey et al., 2017). Privacy issues also need to be addressed when using wearable devices (Gemming et al., 2015a).3.3 Selecting an appropriate method
The method of choice for assessing food or nutrient intakes depends primarily on the objectives of the study. No method is devoid of random or systematic errors (Chapter 5), or prevents alterations in the food habits of the respondents. However, statistical techniques are now available which are designed to mitigate the impact of measurement errors on study results. See Freedman et al. (2011), Kirkpatrick et al. (2018), and Chapter 5. The US National Cancer Institute has developed a Dietary Assessment Primer (2020), a web resource to aid researchers choose the best available dietary assessment approach to achieve their research objective. Readers are advised to consult the primer before selecting a self-report dietary instrument. Box 3.2 provides guidance on the most appropriate methods for assessing food or nutrient intakes in relation to four possible levels of objectives.Level One: Mean nutrient intake of a group
- Preferred approach A single 24h recall, or single weighed or estimated food record, with large number of subjects and adequate representation of all days of the week
- Preferred approach Replicate observations on each individual or a subsample using 24h recalls or weighed or estimated one day food records with an adequate representation of all days of the week
- Preferred approach Multiple replicates of 24h recalls or food records or a semiquantitative food frequency questionnaire
- Preferred approach Even larger number of recalls or records for each individual. Alternatively, a semiquantitative food frequency questionnaire or a dietary history can be used.
Note that the number and selection of replicate 24h recalls, or weighed or estimated one day food records required to obtain level two, level three, or level four data, depends on the day-to-day variation within one individual (i.e., within-person variation ) of the nutrient of interest (Chapter 6). This variation depends on the nutrient, the study population, and the seasonal variations of intake. Generally, for nutrients found in high concentrations in only a few foods, such as vitamins A and D and cholesterol, the number of replicates needed is greater than for those found in a wide range of foods (e.g., protein). Nonconsecutive days should be selected for the replicates when possible, to enhance the statistical power of the information: day-to-day correlations between intakes often occur when food intake data are collected over consecutive days. The length of time needed between the observation days also depends on the nutrient (IOM, 2000; a 3–10d interval after the previous recall is recommended (Tooze, 2020).
Additional factors that should be considered when choosing a method for assessing the food consumption of individuals are the characteristics of the individuals within the study population, the respondent burden of the method, and the available resources. For instance, certain methods are unsuitable for elderly subjects with poor memories, for busy mothers with young children, or for illiterate individuals. Other methods require highly trained personnel and specialized laboratory and computing facilities, which may not be available. Generally, the more accurate methods are associated with higher costs, greater respondent burden, and lower response rates. Unfortunately, compromises often have to be made between the collection of precise data on usual nutrient intakes of individuals and a high response rate.
3.3.1 Determining the mean nutrient intake of a group: level one
Level one is the easiest objective to achieve and can be met by measuring the food intake of each subject in the group using a single 24h recall or a one day food record, provided the individuals are representative of the study population and all the days of the week are proportionately represented in the final sample. Data on mean usual nutrient intakes of a group can be used for international comparisons across countries of the relationship of nutrient intakes to health and disease. However, this method based on a single intake day per subject should never be used for reporting the distribution of intakes (i.e., as percentiles of intake) (Tooze, 2020). To calculate n, the number of subjects required in the group, an estimate of the between-person variation for the nutrient of interest is needed. This is usually obtained from the literature but may be determined during a pilot study.
As an example, assume the expected mean iron intake obtained
from the literature is 10mg/d, with an anticipated standard
deviation (s) of 3mg/d. Also assume that we want to be 95%
confident that the true mean lies between 9.2 to 10.8mg/d
(i.e., the confidence interval has limits which are 0.8mg/d on
either side of the mean). A 95% confidence interval is calculated
approximately as the mean ±2 × e, where e is the
standard error of the mean — a measure of the precision of the estimated mean. Hence , the required e = 0.8/2 = 0.4.
We can use the following formula to calculate n, the desired group size.
\[\small n = s^{2}_{b} /e^{2 } \]
where s2
b is the between-person variance of the nutrient of
interest, and e is the desired standard error — a measure of
precision required for the estimate of the mean intake of
the nutrient of interest.
Hence
\[\small n = 3^{2 } / 0.4^{2 } = 56.25 \]
and so 56 subjects are required.
Alternatively, if we wanted to be 99% confident that the true mean lies
between 9.2 and 10.8mg/d, then more subjects must be studied. A
99% confidence interval is calculated approximately as the
mean ±3 × e. Hence the required e = 0.8/3 = 0.27
Therefore
\[\small n = 3^{2 } / 0.27^{2 } = 123 \] and 123 subjects are required.
Clearly, the size of the group (n) necessary to characterize the group mean usual nutrient intake depends on the degree of precision required: more individuals must be studied to achieve higher precision. This calculation of the required group size should be repeated for each of the nutrients of interest, and the largest n (i.e., the worst case) should be used if possible.
If the study objective is to demonstrate a significant difference in the mean intakes of two groups, or a significant change in the mean intakes, based on unpaired or paired data, then alternative formulae must be applied; details are given in (Gibson and Ferguson, 2008).
3.3.2 Calculating the population percentage “at risk": level two
To determine the percentage of the population “at risk” of inadequate nutrient intakes, an estimate of the distribution of usual intakes of the individuals is required. This, in turn, requires that the food consumption of individuals be measured over more than one day. Hence, repeated 24h recalls, or replicate weighed or estimated one day food records are the methods of choice, again ensuring that all days of the week are proportionately represented in the final sample. Often, it is not feasible to carry out repeated observations on all the individuals, as in the case of a national dietary survey, and the recalls or records are repeated on a subsample of the individuals only.To achieve a level two objective, at least two independent measurements of food intake should be obtained on at least a representative random subsample of individuals in the survey. The U.S. Food and Nutrition Board (IOM, 2000) recommends that the replicate measurements should be independent and made on non-consecutive days 3–10d after the first recall or record. However, if the data can be collected only on consecutive days, then three daily measurements should be used. The random subsample should consist of at least 50 individuals per demographic group. Where possible, the demographic groups to be sampled should be defined according to the sex and life-stage groups used for the chosen Nutrient Reference Values (Deitchler et al., 2020),
Note that it is more important to have a minimum number of replicate observations in the subsample than a minimum proportion of replicate observations. Once the required number of replicate observations have been obtained, methods can be applied to correct for the measurement error associated with both day-to-day variability in intakes for a single person (termed within-person variation ) and the variation in intakes between individuals (termed between-person variation ) (see Chapter 6).
Four statistical methods are now available for estimating the distribution of usual intake. For more details, the reader is referred to (Tooze, 2020). Of the methods, the first was outlined by the National Research Council and later refined by Iowa State University (ISU) (Nusser et al., 1996) with software developed to use the ISU method. Note, this method does allow for a random sub-sample of repeated 24h recalls or food records, and has the capacity to adjust for season, day of the week, and/or sequence effects, but is not recommended for general use with episodically consumed foods, food groups, or nutrients (Tooze, 2020). The adjustment process provides estimates of the usual nutrient intakes for each specified age and gender-specific subgroup. An example comparing the adjusted distributions of usual zinc intakes (using the refined NRC approach of (Nusser et al., 1996) with the observed zinc intakes for New Zealand adult females aged 19–50y is shown in Figure 3.6.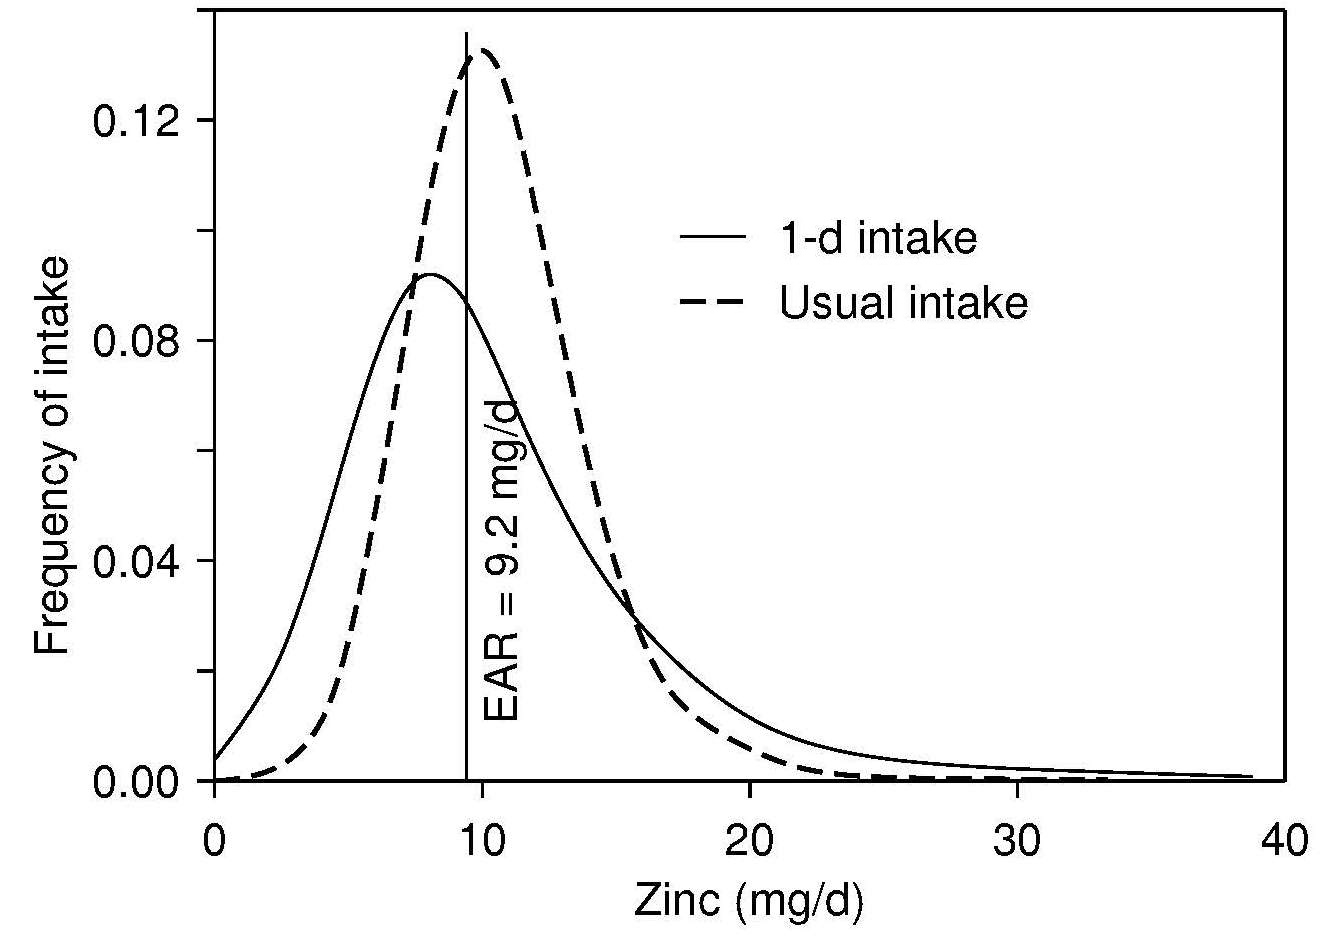
Later, the National Cancer Institute (NCI) (Tooze, 2020) developed a method which also adjusts for the same covariates (season, day of the week, and/or sequence), but also has the capability of incorporating covariates to identify estimates for sub-populations in the survey. In addition, the NCI method, unlike the ISU, can be used with episodically consumed foods, food groups, or nutrients.
The European Food Consumption Validation Project have developed the Multiple Source Method (Haubrock et al., 2011) (MSM) that can also be used for episodically consumed foods, food groups, or nutrients, although caution must be used when employing the program with models containing covariates. The Dutch National Food Consumption Survey 2007-2010 have developed a program called the Statistical Program to Assess Dietary Exposure (SPADE) , but this program currently requires 24h recalls on at least two-days for all respondents in the sample and is not recommended for use with episodically consumed foods, food groups, or nutrients.
All the methods described briefly above use varying approaches to yield an adjusted distribution of “usual" nutrient intakes that can then be used to predict the proportion of the population at risk of nutrient inadequacy using either the full probability approach, or the Estimated Average Requirement (EAR) cutpoint method; details are given in Chapter 8b. However, the choice of which “usual intake method” method to use depends on whether foods, food groups, or nutrients are episodically consumed, whether the probability of consumption and the consumption-day amount are correlated or not, and whether replicates of the 24h recalls or food records are available on all the population groups to be surveyed or only on a sub-sample (Souverein et al., 2011).
| Variable | Prevalence (%) "True" Observed | No. of repeated measurements needed | |
|---|---|---|---|
| Cholesterol > 300mg | 15 | 37 | 39 |
| Calcium > 800mg | 12 | 21 | 9 |
3.3.3 Ranking individuals by food or nutrient intake: level three
When the study objective is at level three and involves ranking individuals within a group, often for the purpose of linking dietary intakes with risk of chronic disease, the preferred approach is to obtain multiple observations on each individual. The number of days required to achieve the level three objective can be calculated from the ratio of the within- to the between-person variation in nutrient intakes (often termed the “variance ratio"); for more details see Chapter 6 . Sometimes an estimate of the variance ratio can be obtained from the literature, again preferably from an earlier study on a comparable group. Alternatively, a pilot study may be necessary to obtain this information.Several authors have developed equations for calculating the number of replicate days required to meet level three objectives (Black et al., 1983; Basiotis et al., 1987; Nelson et al., 1989). Black et al. (1983) suggest using the following formula for the number of days (n) of diet records needed:
\[\small n = (r^{2} /(1 − r^{2})) × (s^{2}_{w}/s^{2}_{b})\]
In this equation, r is the unobservable correlation between
the observed and true mean intakes of individuals over the
period of observation, and s2
w and s2
b are the observed
within‑ and between-person variances, respectively. This
equation should be used in association with Table 3.8 which
shows the proportion of individuals correctly and
incorrectly classified in the extreme fractions for
different values of the corrlation coefficient between the
observed and true intakes (r). The value of r chosen will
depend on the degree of misclassification that the
investigator is prepared to accept
(Table 3.8).
| Correctly and incorrectly classified into extreme fraction | ||||
|---|---|---|---|---|
| r | Thirds | Fourths | Fifths | |
| 0.75 | a b | 0.69 0.049 | 0.63 0.013 | 0.59 0.004 |
| 0.80 | a b | 0.72 0.033 | 0.68 0.006 | 0.65 0.002 |
| 0.85 | a b | 0.76 0.018 | 0.72 0.002 | 0.69 <0.001 |
| 0.90 | a b | 0.80 0.006 | 0.77 <0.001 | 0.75 <0.001 |
| 0.95 | a b | 0.86 <0.001 | 0.84 <0.001 | 0.83 <0.001 |
w / s2
b = 1.7, then the number of days (n) \[ \small n = (r^{2}/(1–r^{2}))× 1.7\] \[ \small n = 0.75^{2}/(1–0.75^{2}) × 1.7\] \[ \small n = \mbox{3 days}\]
The number of days needed to generate a given r increases as
the chosen r increases. If the size of the within-person
variation (s2
w ) in nutrient intake is small compared with
the size of the between-person (s2
b) variation , then fewer
replicate days are needed to meet level three objectives.
The U.S. subcommittee on criteria for dietary evaluation (NRC, 1986) recommended using independent days for replicating the measurements of one day nutrient intakes to reduce any effect of autocorrelation between intakes on adjacent days.
An alternative approach to achieving level three objectives is to use a semi-quantitative food frequency questionnaire. This approach is often used in epidemiological investigations to study associations between intakes and risk of disease and does not require a measurement of absolute nutrient intakes. Although this approach is much simpler, involving only a single interview with each subject, it is difficult to quantify the errors involved and to separate the effects of within- and between-person variance.
3.3.3 Determining usual intakes of nutrients of individuals: level four
Reliable estimates of usual food or nutrient intakes of individuals that can be used with confidence to meet a level four objective, involving correlation or regression analysis with individual biochemical measures, are the most difficult to obtain. Large numbers of measurement days for each individual are required using 24h recalls or estimated or weighed food records.
An estimate of the within-person variation for each nutrient
of interest should be obtained from the literature,
preferably from an earlier study on a comparable group or a
pilot study, as noted earlier. This estimate may be
expressed as the variance, s2
w ; standard deviation, sw; or
as the coefficient of variation (CVw) expressed as a
percentage:
\[\small CV_{w}= s_{w}/ (\mbox{mean intake}) × \mbox{100%}\]
This estimate can be used in the following equation to determine the number of days required per individual to estimate an individual's nutrient intake to within 20% of their true mean 95% of the time (Beaton et al., 1979).
\[\small n = (Z_{α}CV_{w} / D_{0})^{2}\]
where n = the number of days needed per individual, Zα = the normal deviate for the percentage of times the measured value should be within a specified limit (i.e., 1.96 in the example below), CVw = the within-person coefficient of variation (as a percentage), and D0 = the specified limit (as a percentage of long-term true usual intake) (i.e., 20% in the example given below).
The following example calculates the number of days required to estimate a Malawian woman's zinc intake using 24h recalls to within 20% of the true mean, 95% of the time. In this example, the CVw (i.e., 34%) for zinc intakes on Malawian women via 24h recalls is taken from the literature (IZiNCG, 2004). Thus if Zα = 1.96 and CVw = 34%. then:
\[\small n = (1.96 × 34\% / 20\%)^{2} = 11 d \]
If a pilot study is undertaken in which replicate 24h recalls are conducted, then the actual CVw for each nutrient of interest can be calculated. In this way, the estimate of the number of days required to measure the usual intake of each of the nutrients of interest in an individual, with a required degree of precision, can be defined. In general, considerably more days are required to obtain reliable estimates of intakes of individuals to meet the level four objective, compared with level three (i.e., relative ranking of subjects into groups) (Palaniappan et al., 2003).
Sometimes, dietary histories or semi-quantitative food frequency questionnaires are used to obtain this level four data on usual nutrient intakes for correlation with biomarkers (Jacques et al., 1993). Some investigators emphasize, however, that the accuracy of a semi-quantitative food frequency questionnaire is only equivalent to two to three repeat 24h recalls (Sempos et al., 1999).In some experimentally controlled studies such as balance studies, information on the actual nutrient intakes of an individual over a finite time period are required. For such data, weighed food records (Section3. 1.4), completed for the duration of the study period, are the recommended method. Nutrient intakes can then be calculated using food composition data. Alternatively, duplicate meals can be collected throughout the period for later analysis; details are given in Chapter 4.