
Leclercq C, Troubat N, and Gibson RS1,
Principles of Nutritional
Assessment: Food Available for
Consumption at National and
Household Levels
3rd Edition. August, 2024
Abstract
This chapter describes how National Food Balance Sheets (FBSs) and Household Surveys allow a quantitative assessment of food available for consumption at national and household levels, respectively. Data expressed as per capita food supply for human consumption can be used to estimate per capita available intake of foods as well as energy and nutrients through matching with food composition data. Food Balance Sheets are calculated from national food production, plus imports and food taken from stocks, with exports and food added to stocks subtracted to obtain an estimate of gross country's food supply. Both food diverted for non-human uses (e.g. animal feed, seed, non-food use) and the loss up to retail level are then subtracted from the gross country's food supply to obtain the net country's food supply (i.e. total food available for human consumption in a country at the retail level). FBSs are particularly important for low-income countries, where food consumption surveys at the household or individual-level are not performed regularly on a representative sample of the population. Unlike household surveys, data from FBS provide no information on the distribution of the food supply within the country (in terms of geographical areas or socio-economic groups) or according to seasons. Household food consumption is defined as the total amount of food and beverages available for consumption in a living space (household, family group or institution). It includes all food prepared, both consumed in the living space or outside. Food consumption by the household can be actually measured (i.e., in Household Food Consumption Surveys — HFCS), or assessed from food available for consumption (i.e., in Household Consumption and Expenditure Surveys — HCES). Several indicators are available based on FBS and HCES data to monitor and compare food insecurity at the global and national levels e.g., prevalence of undernourishment (PoU). However, data from FBS or household surveys (HCS or HCES) provide no information on the availability of food/nutrients by age, sex and physiological status. Additional interpretation of the data, in terms of dietary adequacy, presents challenges and uncertainties unless complemented with individual-level dietary intake data. Increasingly, global data bases based on information synthesized from FBS, HCES, and individual-level food consumption surveys are being used. Examples include the Global Dietary Database and the Institute for Health Metrics and Evaluation (IHME) initiative. These are aimed at modeling worldwide intakes of foods and nutrients by age, sex and physiological status. CITE AS: Leclercq C, Troubat N, and Gibson RS, Principles of Nutritional assessment: Food Available for consumption at the National and Household Levels.https://nutritionalassessment.org/food/
Email: Rosalind.Gibson@Otago.AC.NZ
Licensed under CC-BY-4.0
( PDF )
2.0 Introduction
This chapter considers survey methods suitable for a quantitative assessment of food available for consumption / consumed at national and household levels. Methods suitable for measuring food consumption at the individual level are discussed in Chapter 3. Methods designed to estimate the exposure to hazardous substances, although sometimes based on household food supply, and those providing only a qualitative assessment such as the household dietary diversity score, or capturing only part of the available food supply (e.g., using Universal Product Codes — UPCs), are not considered. The food available for human consumption by a population can be assessed through nationally representative surveys at the national level using Food balance Sheets (FBS), or alternatively at the household level using either Household Food Consumption Surveys (HFCS) or Household Consumption and Expenditure Surveys (HCES). The resulting data from all these surveys are expressed as per capita food supply for human consumption, and are used to estimate per capita available intake of foods, and energy and nutrients, when matched with appropriate food composition data. The term that should be used for data derived from most of these national and household surveys is either “food supply” or “food available for consumption” rather than “food consumption”. Only certain types of household surveys measure actual foods consumed. Data from FBSs provide no information on the distribution of the food available for consumption within the country (in terms of geographical areas, seasonality, or demographic characteristics), unlike the data generated from household surveys. However, household surveys (HCS or HCES) do not provide information on the availability of food/nutrients by age, sex, and physiological status. Moreover, the interpretation of the data from household surveys in terms of dietary adequacy presents challenges and uncertainties unless complemented with individual-level dietary intake data. Several indicators can be derived from FBS and HCES data to monitor and compare food insecurity at the global and national levels. These indicators can be based on the quantity of food available for consumption (e.g., prevalence of undernourishment (PoU) based on the energy supply per capita), as well as the food quality (e.g., Household Dietary Diversity Score).2.1 Food Balance Sheets
Food balance sheets are particularly important in countries where food consumption surveys at the household or individual level are not performed regularly on a representative sample of the population, as in some low-income countries. Several terms have been used to describe FBSs. These include “country's food supply”, “national food accounts”, “food moving into consumption”, “food consumption statistics”, “food disappearance data”, “food available for consumption” and “consumption level estimates”. Here, the term “country's food supply” is used. Food balance sheets present a comprehensive picture of the pattern of a country's food supply during a specified reference period: the calendar year, the agricultural year or the crop year (FAO, 2021c). The sources of the food supply and its utilization are reported for each food item potentially available for human consumption, and includes primary commodities such as ‘wheat, rice, fruit, vegetables, and processed commodities such as vegetable oils and butter. FBS data cannot be disaggregated to determine the distribution of a country's food supply spatially, seasonally, or by demographic characteristics. Both official and unofficial data are used for the compilation of FBSs; National statistical offices constitute an important data source. However, data measured directly on food availability at national level may be difficult to obtain (FAO, 2021a). Instead, FBS compilers often derive estimates of food availability by making certain adjustments based on other existing data sets that measure food production or consumption. For example, two official data sources that may assist in the estimation of a country's food supply availability are Industrial Output Surveys and Household Consumption and Expenditure Surveys (HCES). See Section 2.2 for the description of HCES surveys. The country's food supply is calculated from national food production, plus imports, plus food taken from stocks. Exports and food added to stocks are then subtracted to obtain a gross estimate of a country's food supply. The estimates of food diverted for non-human uses (e.g. animal feed, seed, non-food use) and of food loss are then subtracted from the gross country's food supply to obtain the net country's food supply, i.e. the total food available for human consumption in a country at the retail level (Figure 2.1, Nelson, 1984). Data on non-commercial food production and detailed information on processed foods are not available in Food Balance Sheets.
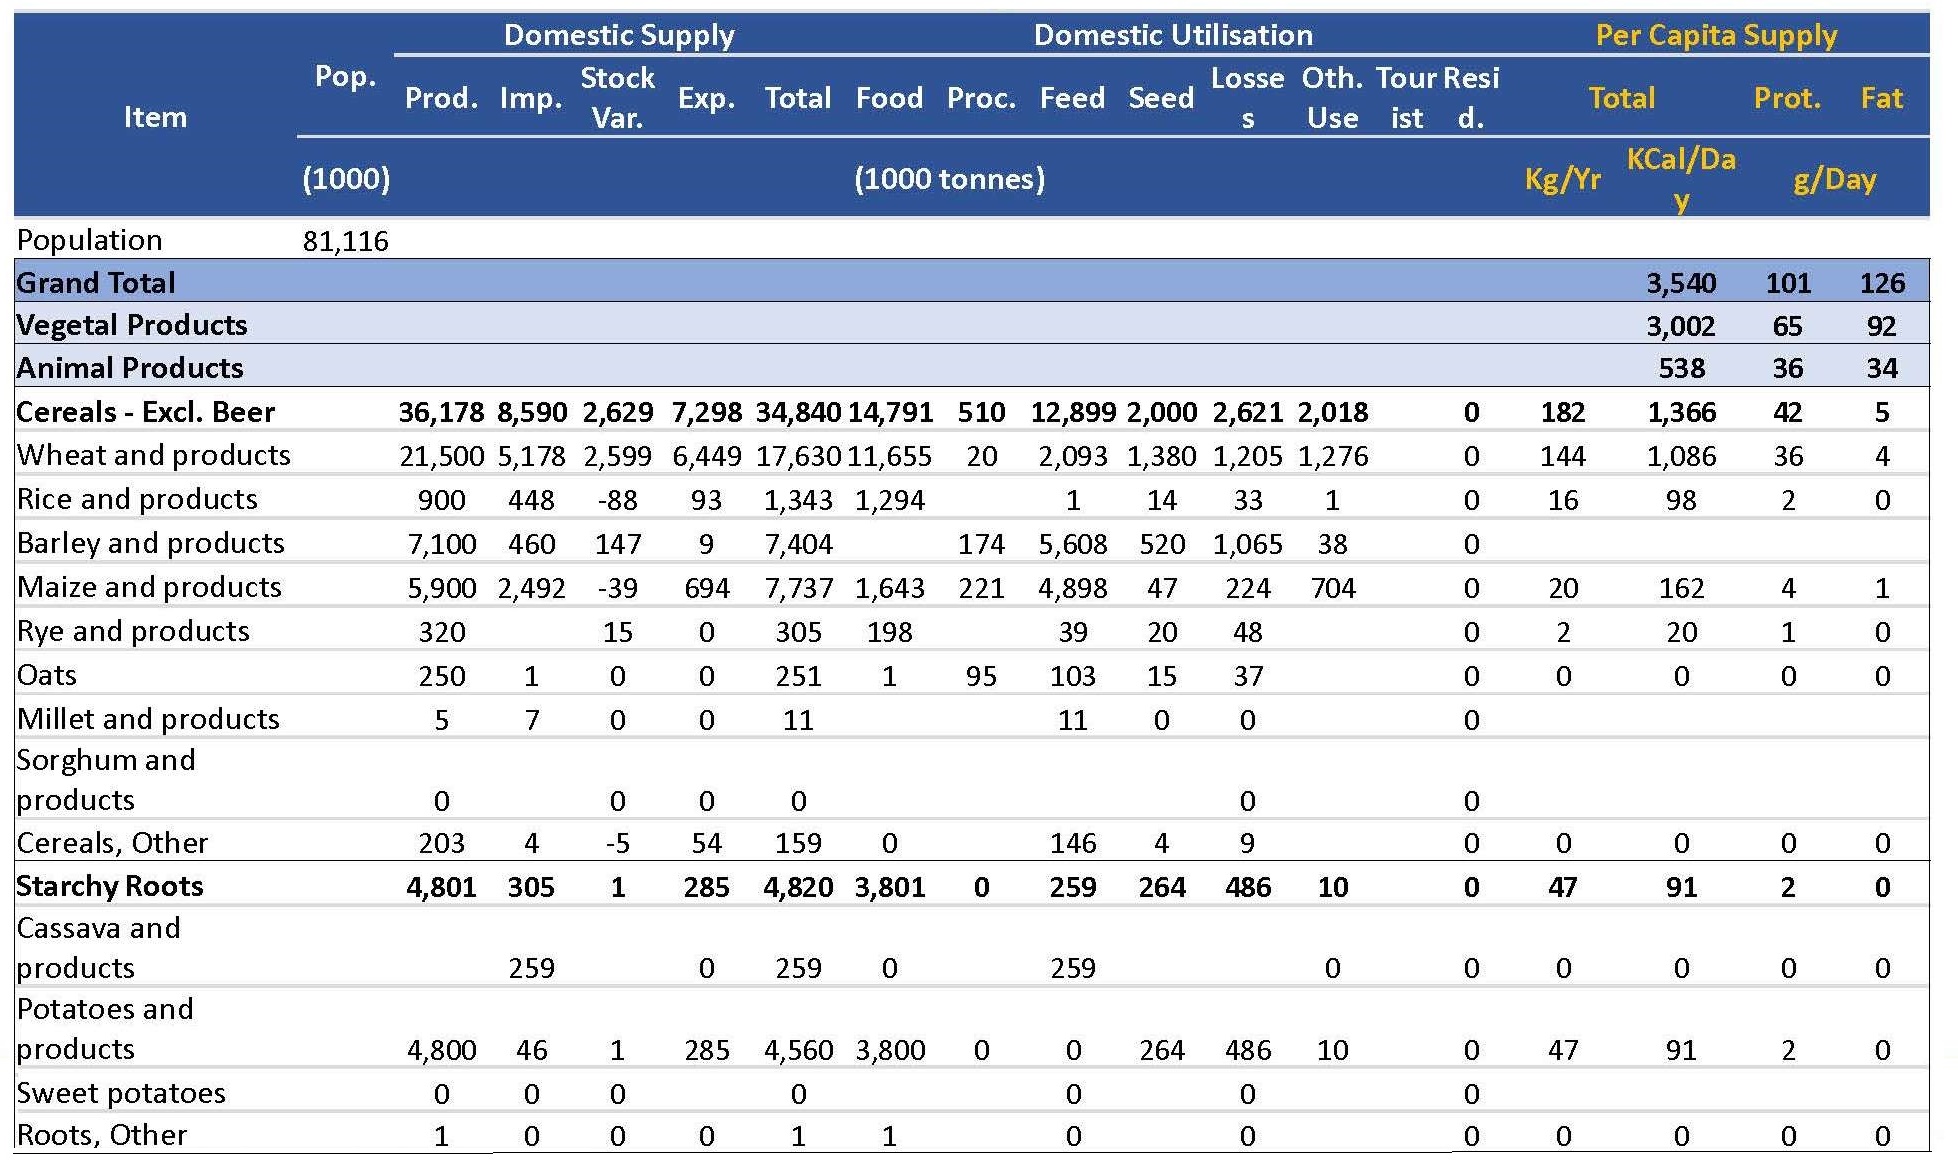
Abbreviations:
Pop, Population; Prod, Production, Imp, Imports; Exp, Exports; Proc, Processed commodities converted back to their original commodity equivalent; Oth. Use, Other Uses; Tour, Tourists; Resid, Residual. From
FAO, (2022a).
- Cereals - Excluding Beer
- Starchy Roots
- Sugar Crops
- Sugar & Sweeteners
- Pulses
- Treenuts
- Oilcrops
- Vegetable Oils
- Vegetables
- Fruits - Excluding Wine
- Stimulants
- Spices
- Alcoholic Beverages
- Meat
- Offals
- Animal fats
- Eggs
- Milk - Excluding Butter
- Fish, Seafood
- Aquatic Products, Other
- Miscellaneous
2.1.1 Uses of Food Balance Sheet data
Food Balance Sheet data are easily accessible and provide coverage of per capita food supply across countries and regions using a relatively consistent methodology compared to many other sources of data on food supply.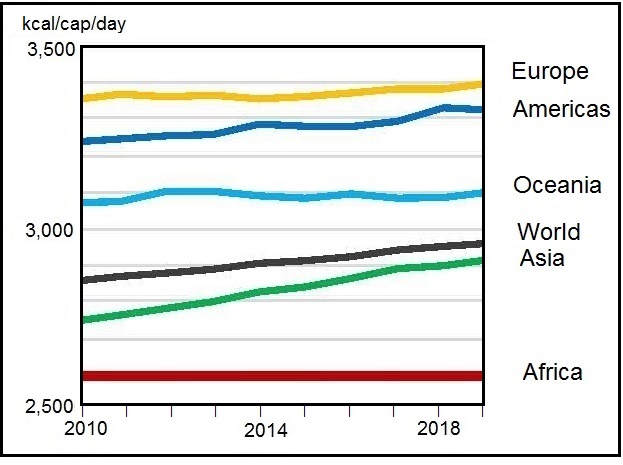
- Inter-country, regional or global comparison of food groups, nutrient availability and/or dietary trends
- Within-country analysis of food availability, nutrient availability and/or dietary trends
- Comparison of FBS with other national sources of dietary data
- Modeling studies in which FBS data are used as a guide to assess whether a proposed intervention is likely to make a difference to the health and nutrition of the population. As an example, Sheehy and Sharma (2011). investigated the possibility of increasing the folate supply in the European Union by replacing normal eggs with folate-enriched eggs
- Association between FBS dietary factors and mortality or health outcomes.
- Dietary Energy Supply (DES) (kcal/capita/day)*
- Average Dietary Energy Requirement*
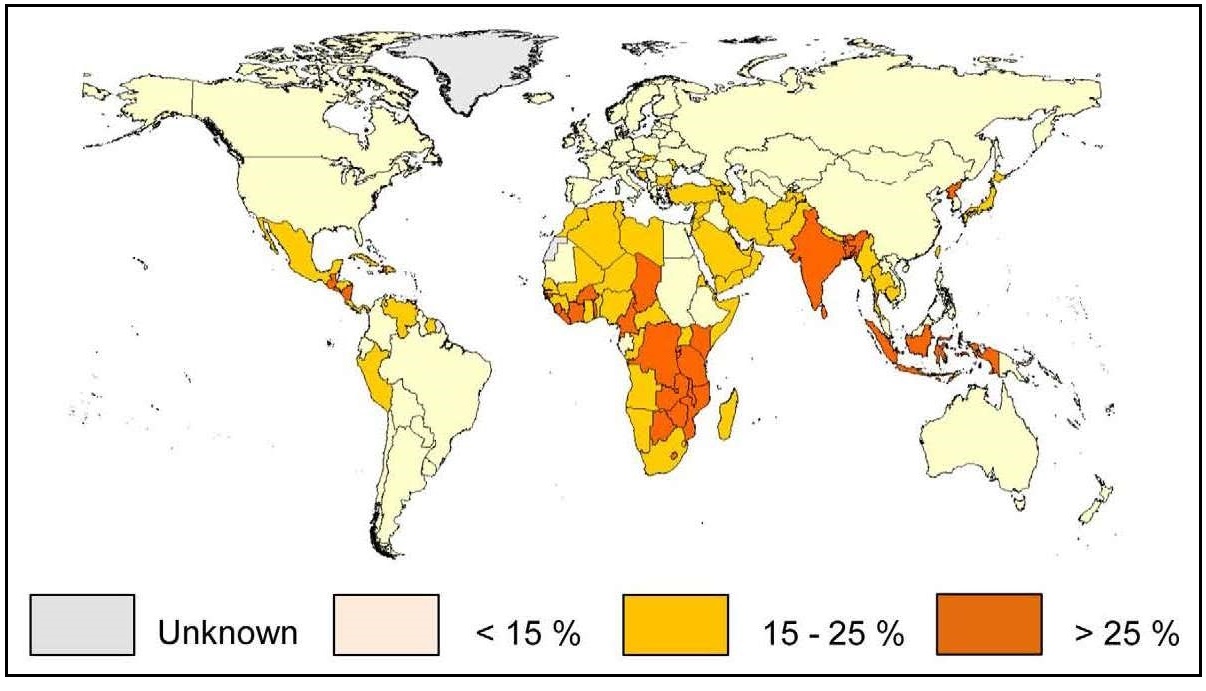
- Prevalence of Undernourishment (PoU)*
- Dietary energy available from cereals, roots, and tubers (kcal/capita/day), expressed as percent*
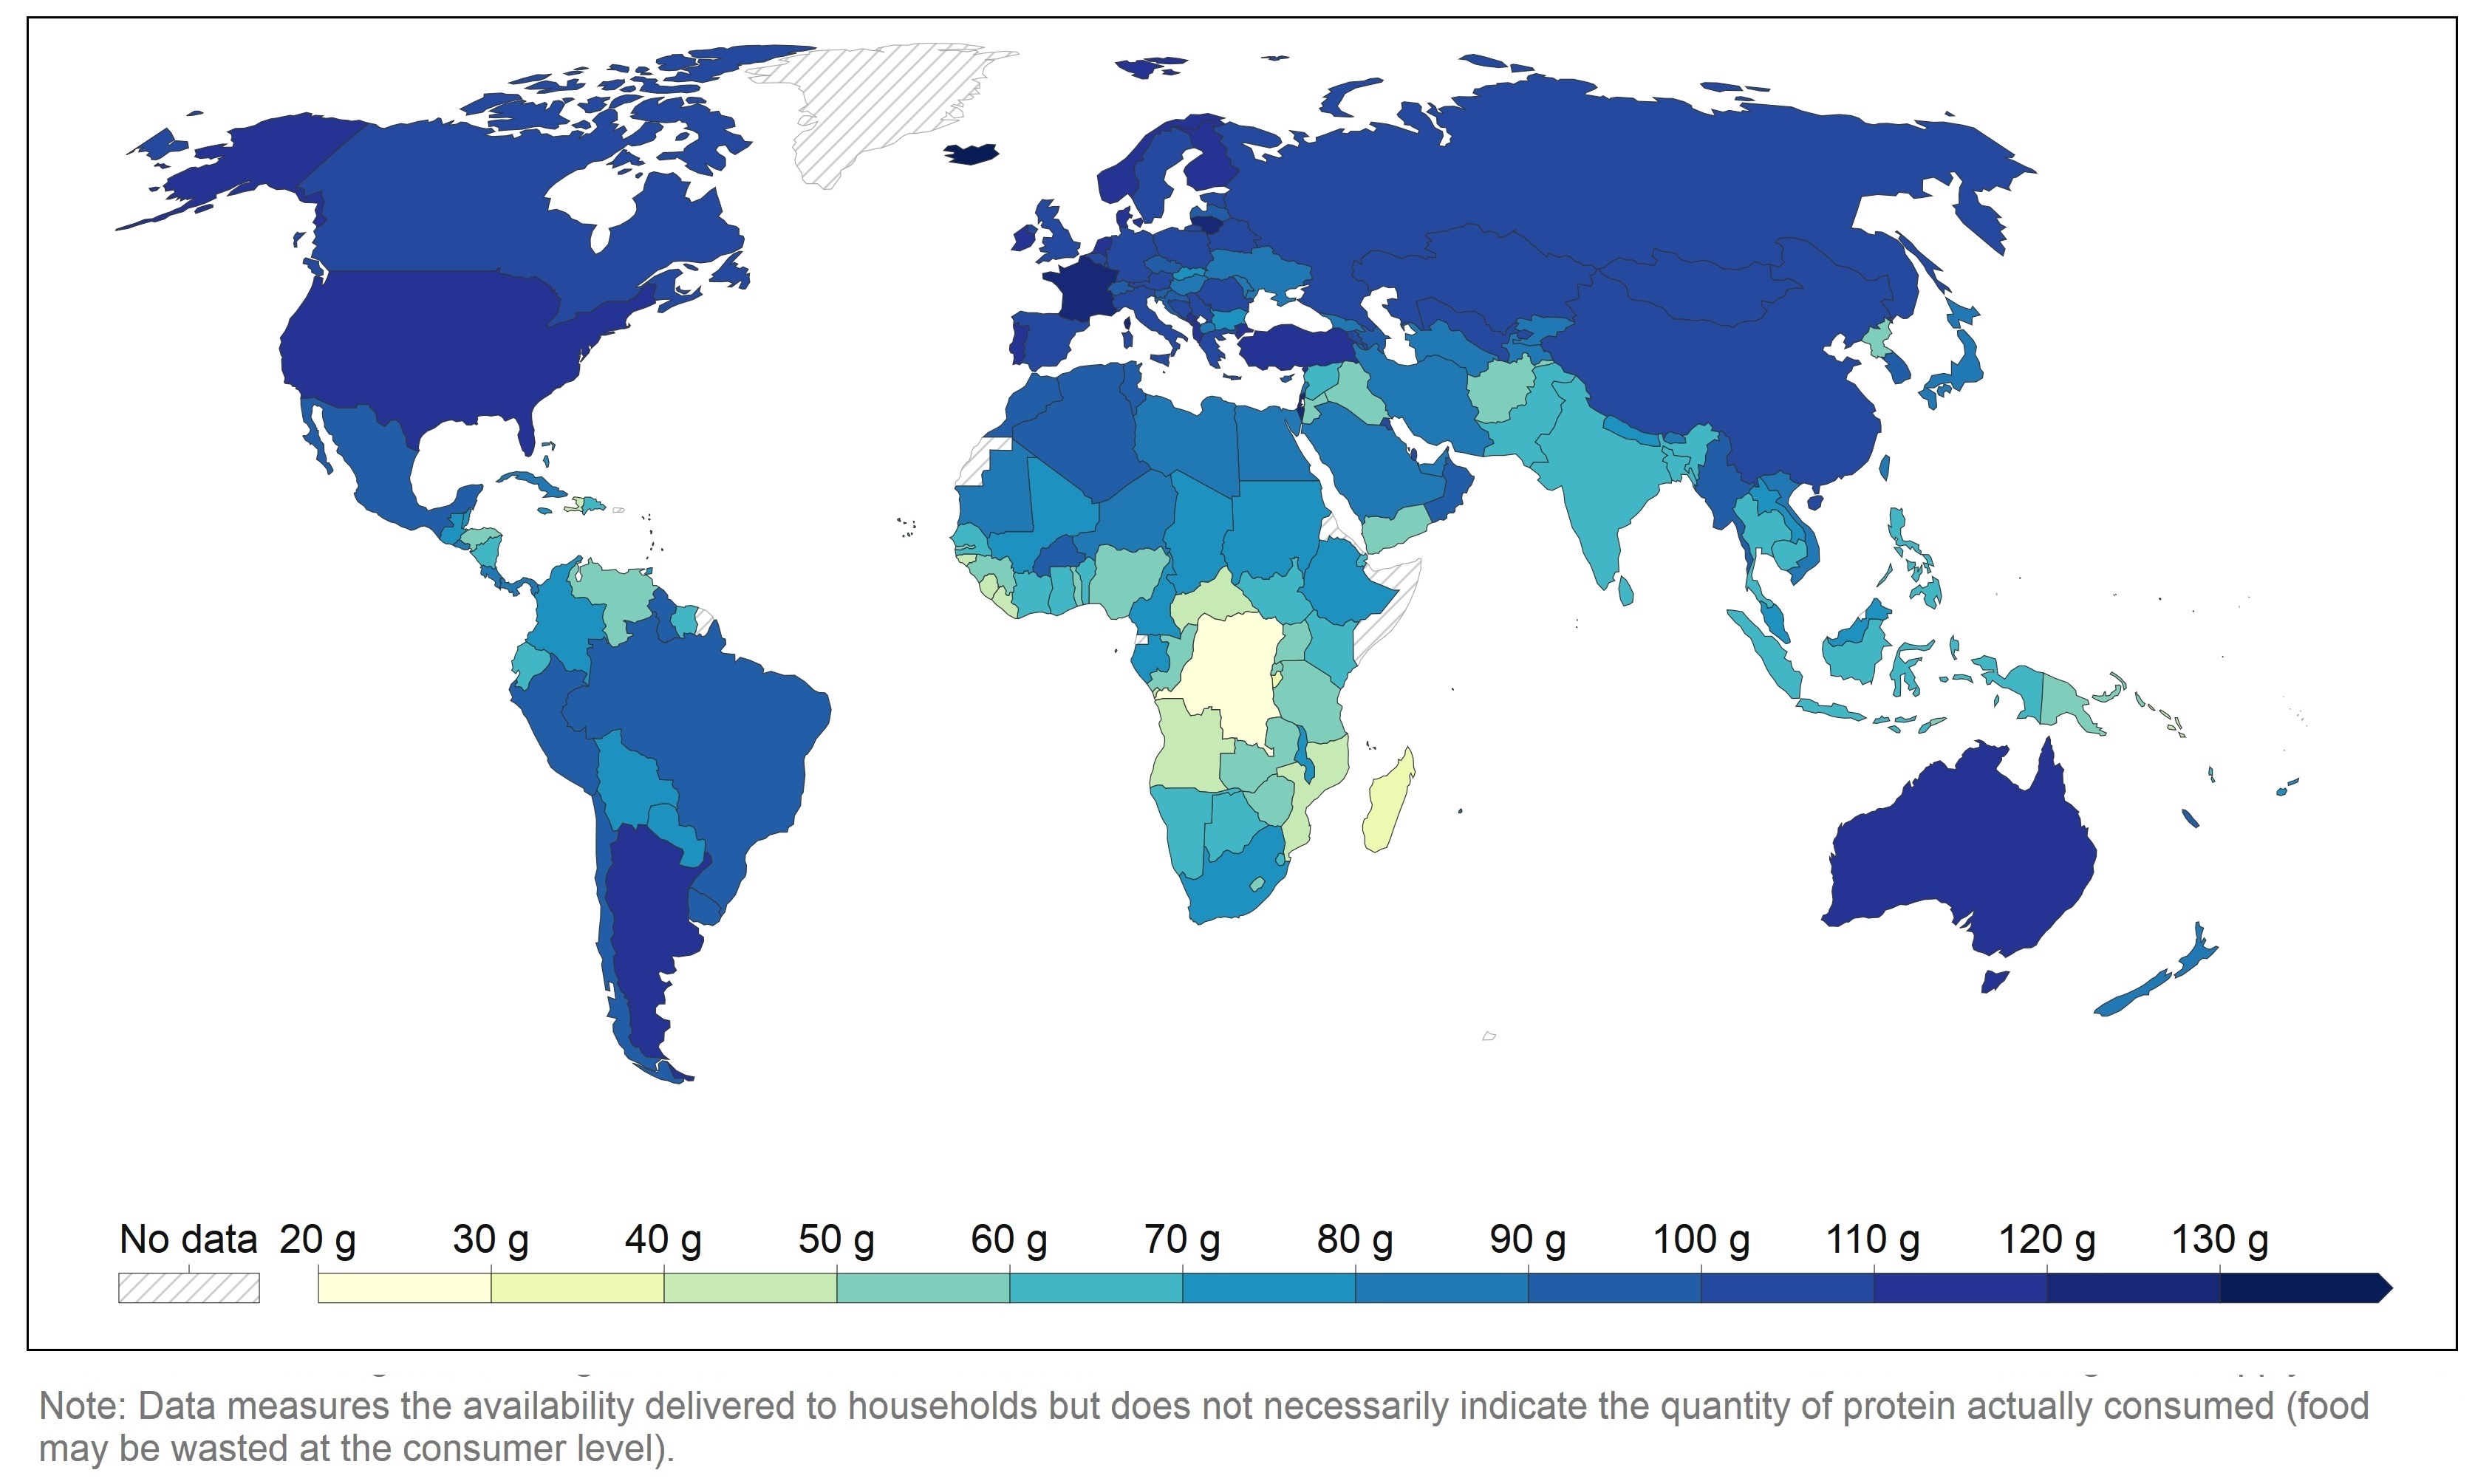
- Protein supply (g/capita/day), 3-year average*
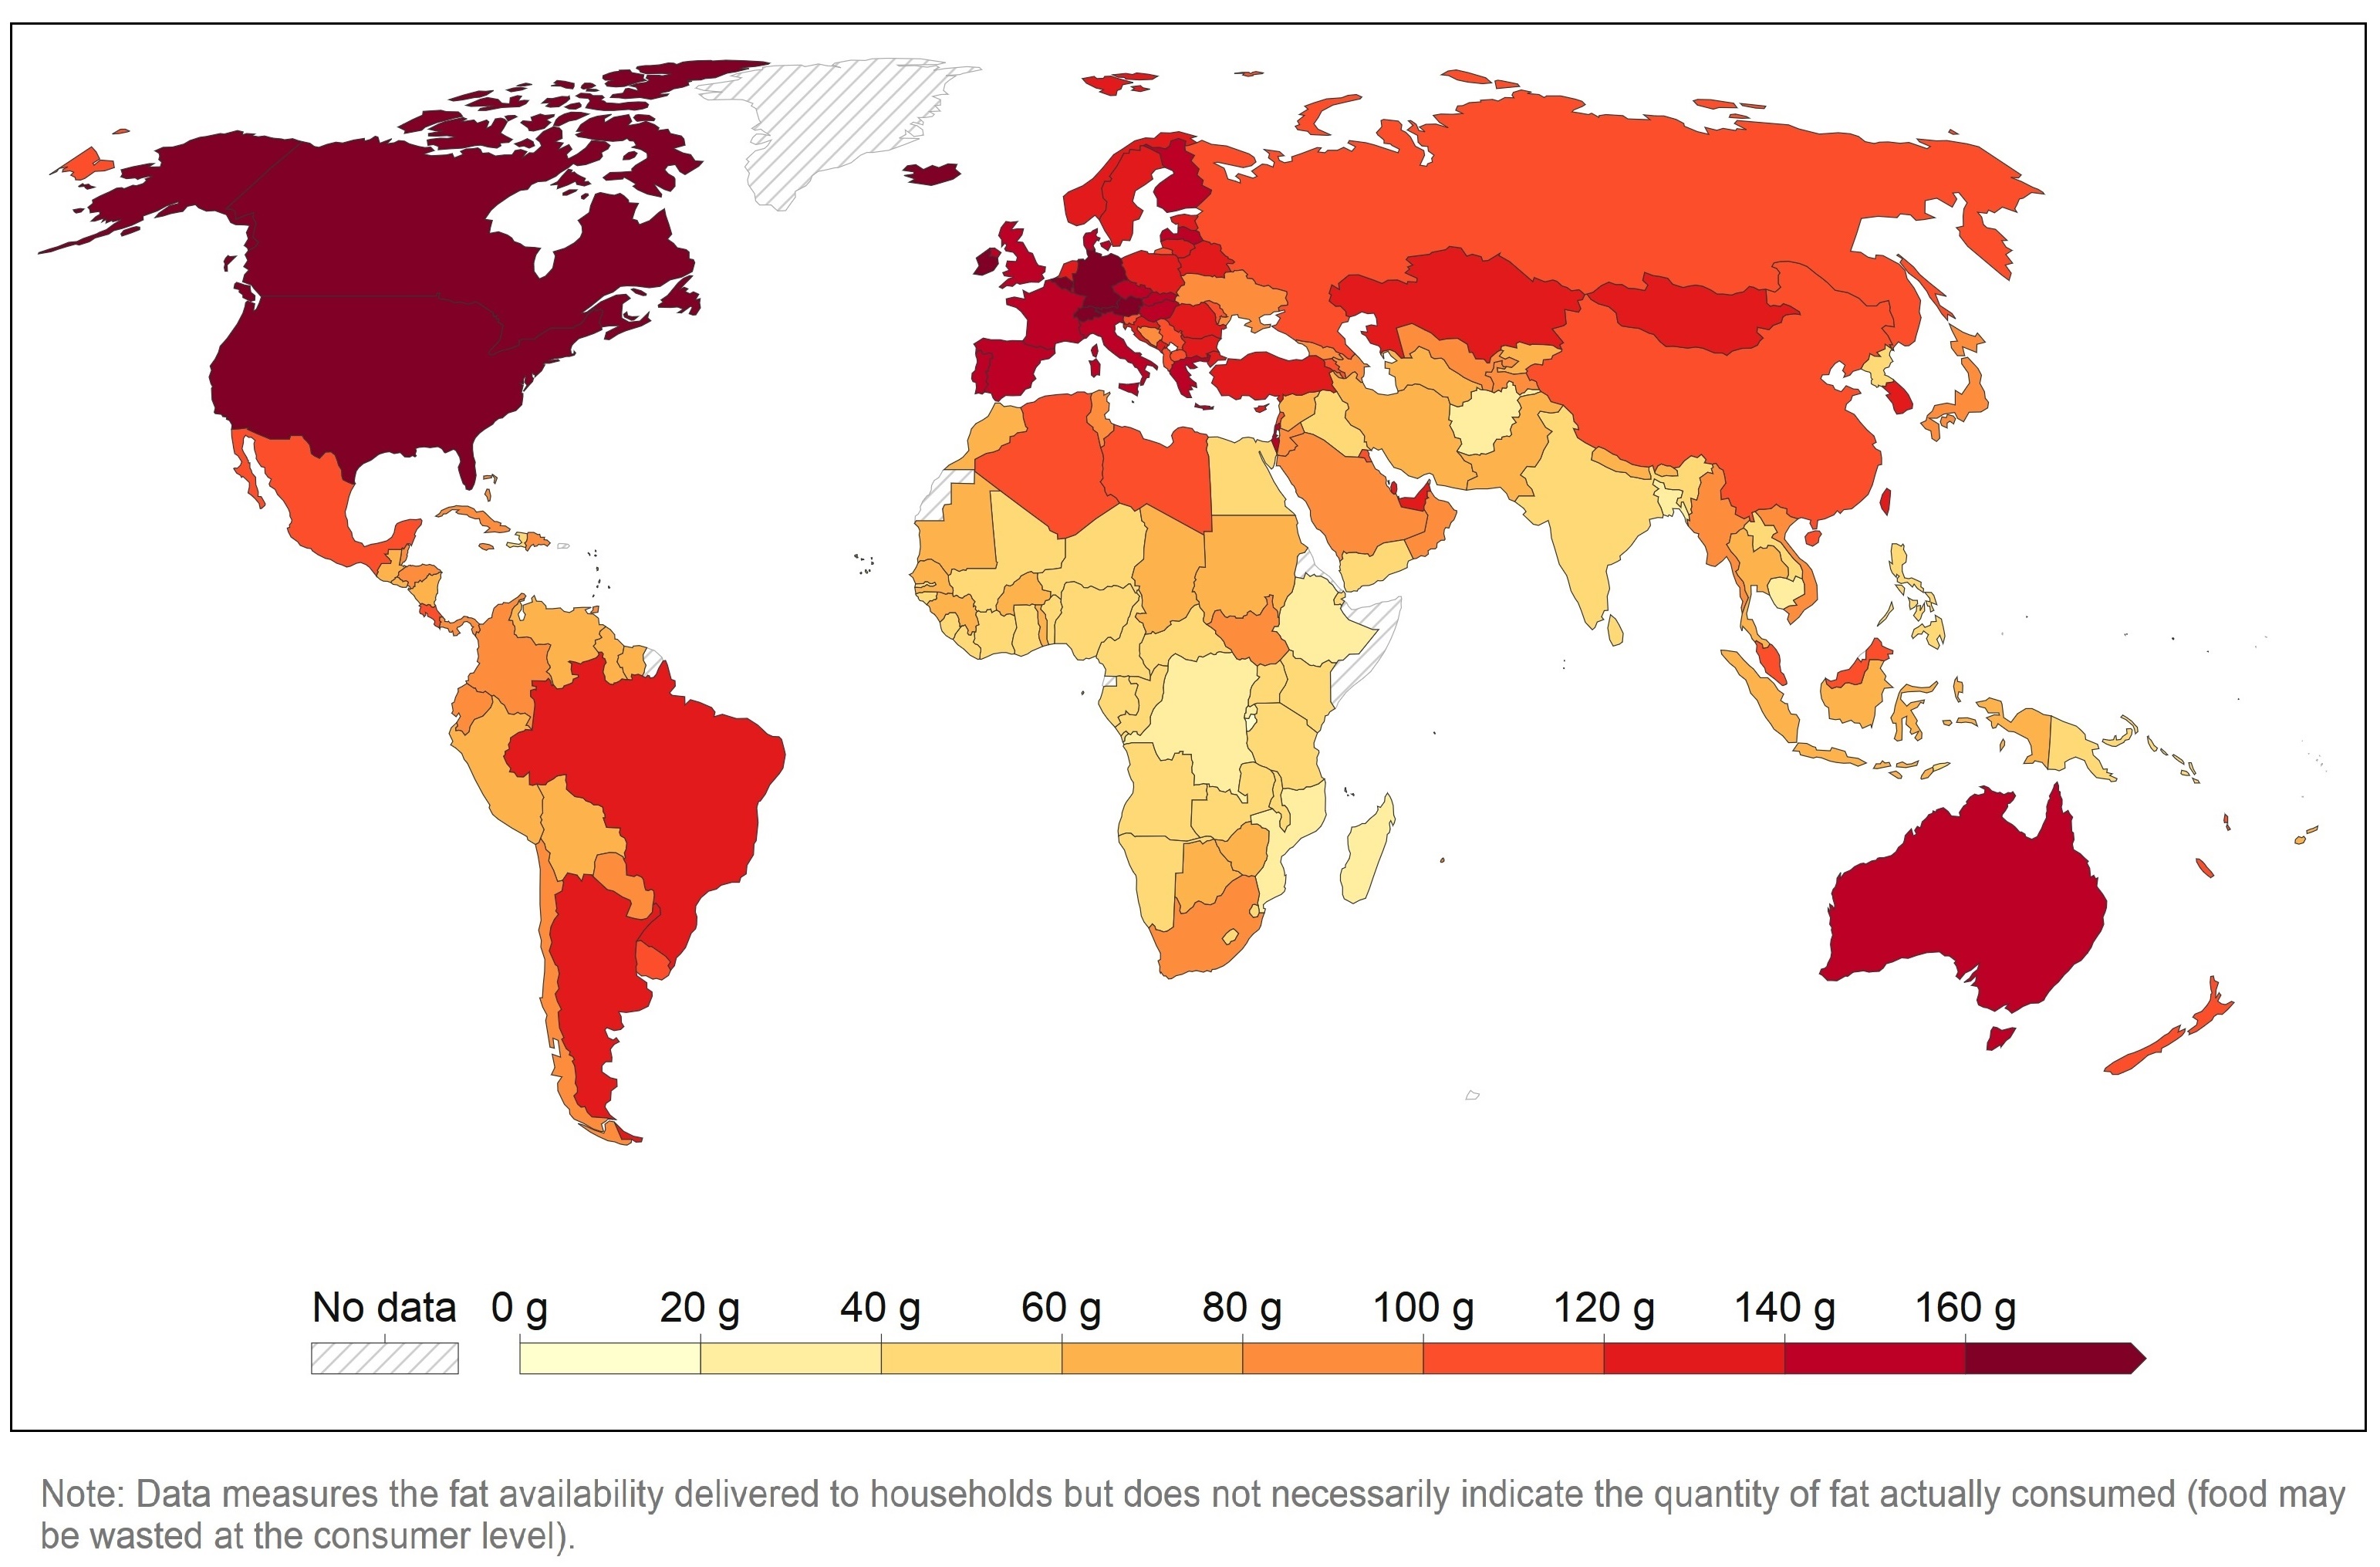
- Fat supply (g/capita/day), 3-year average*
- Supply of protein of animal origin (g/capita/day), 3-year average*
- Estimated prevalence of inadequate intakes of selected micronutrients at global and country-specific levels
2.1.1a Trends in global hunger
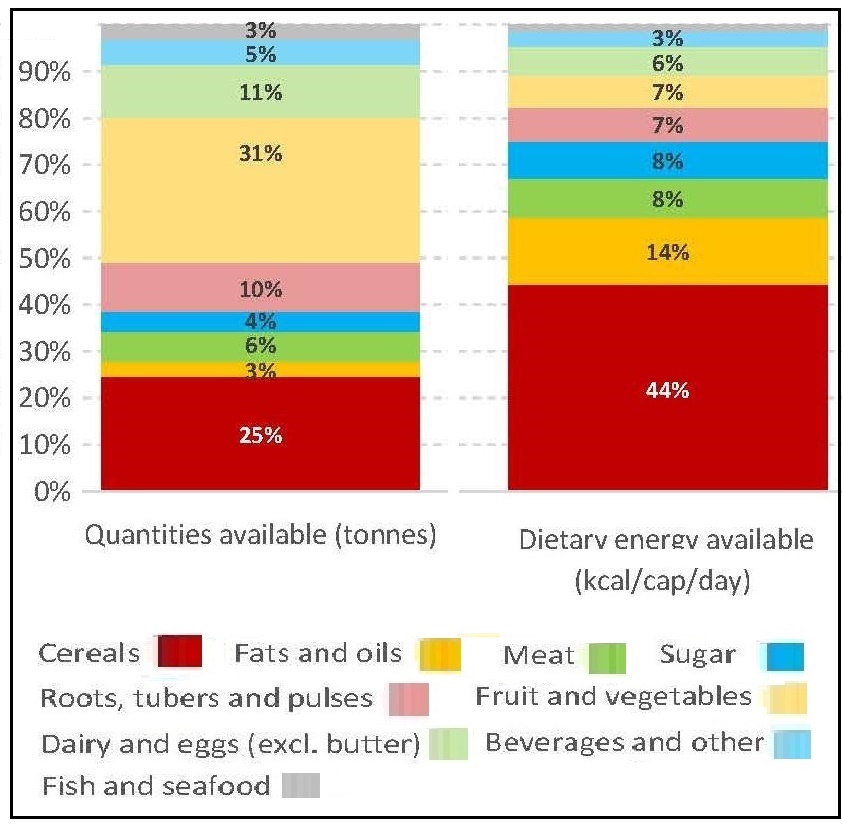
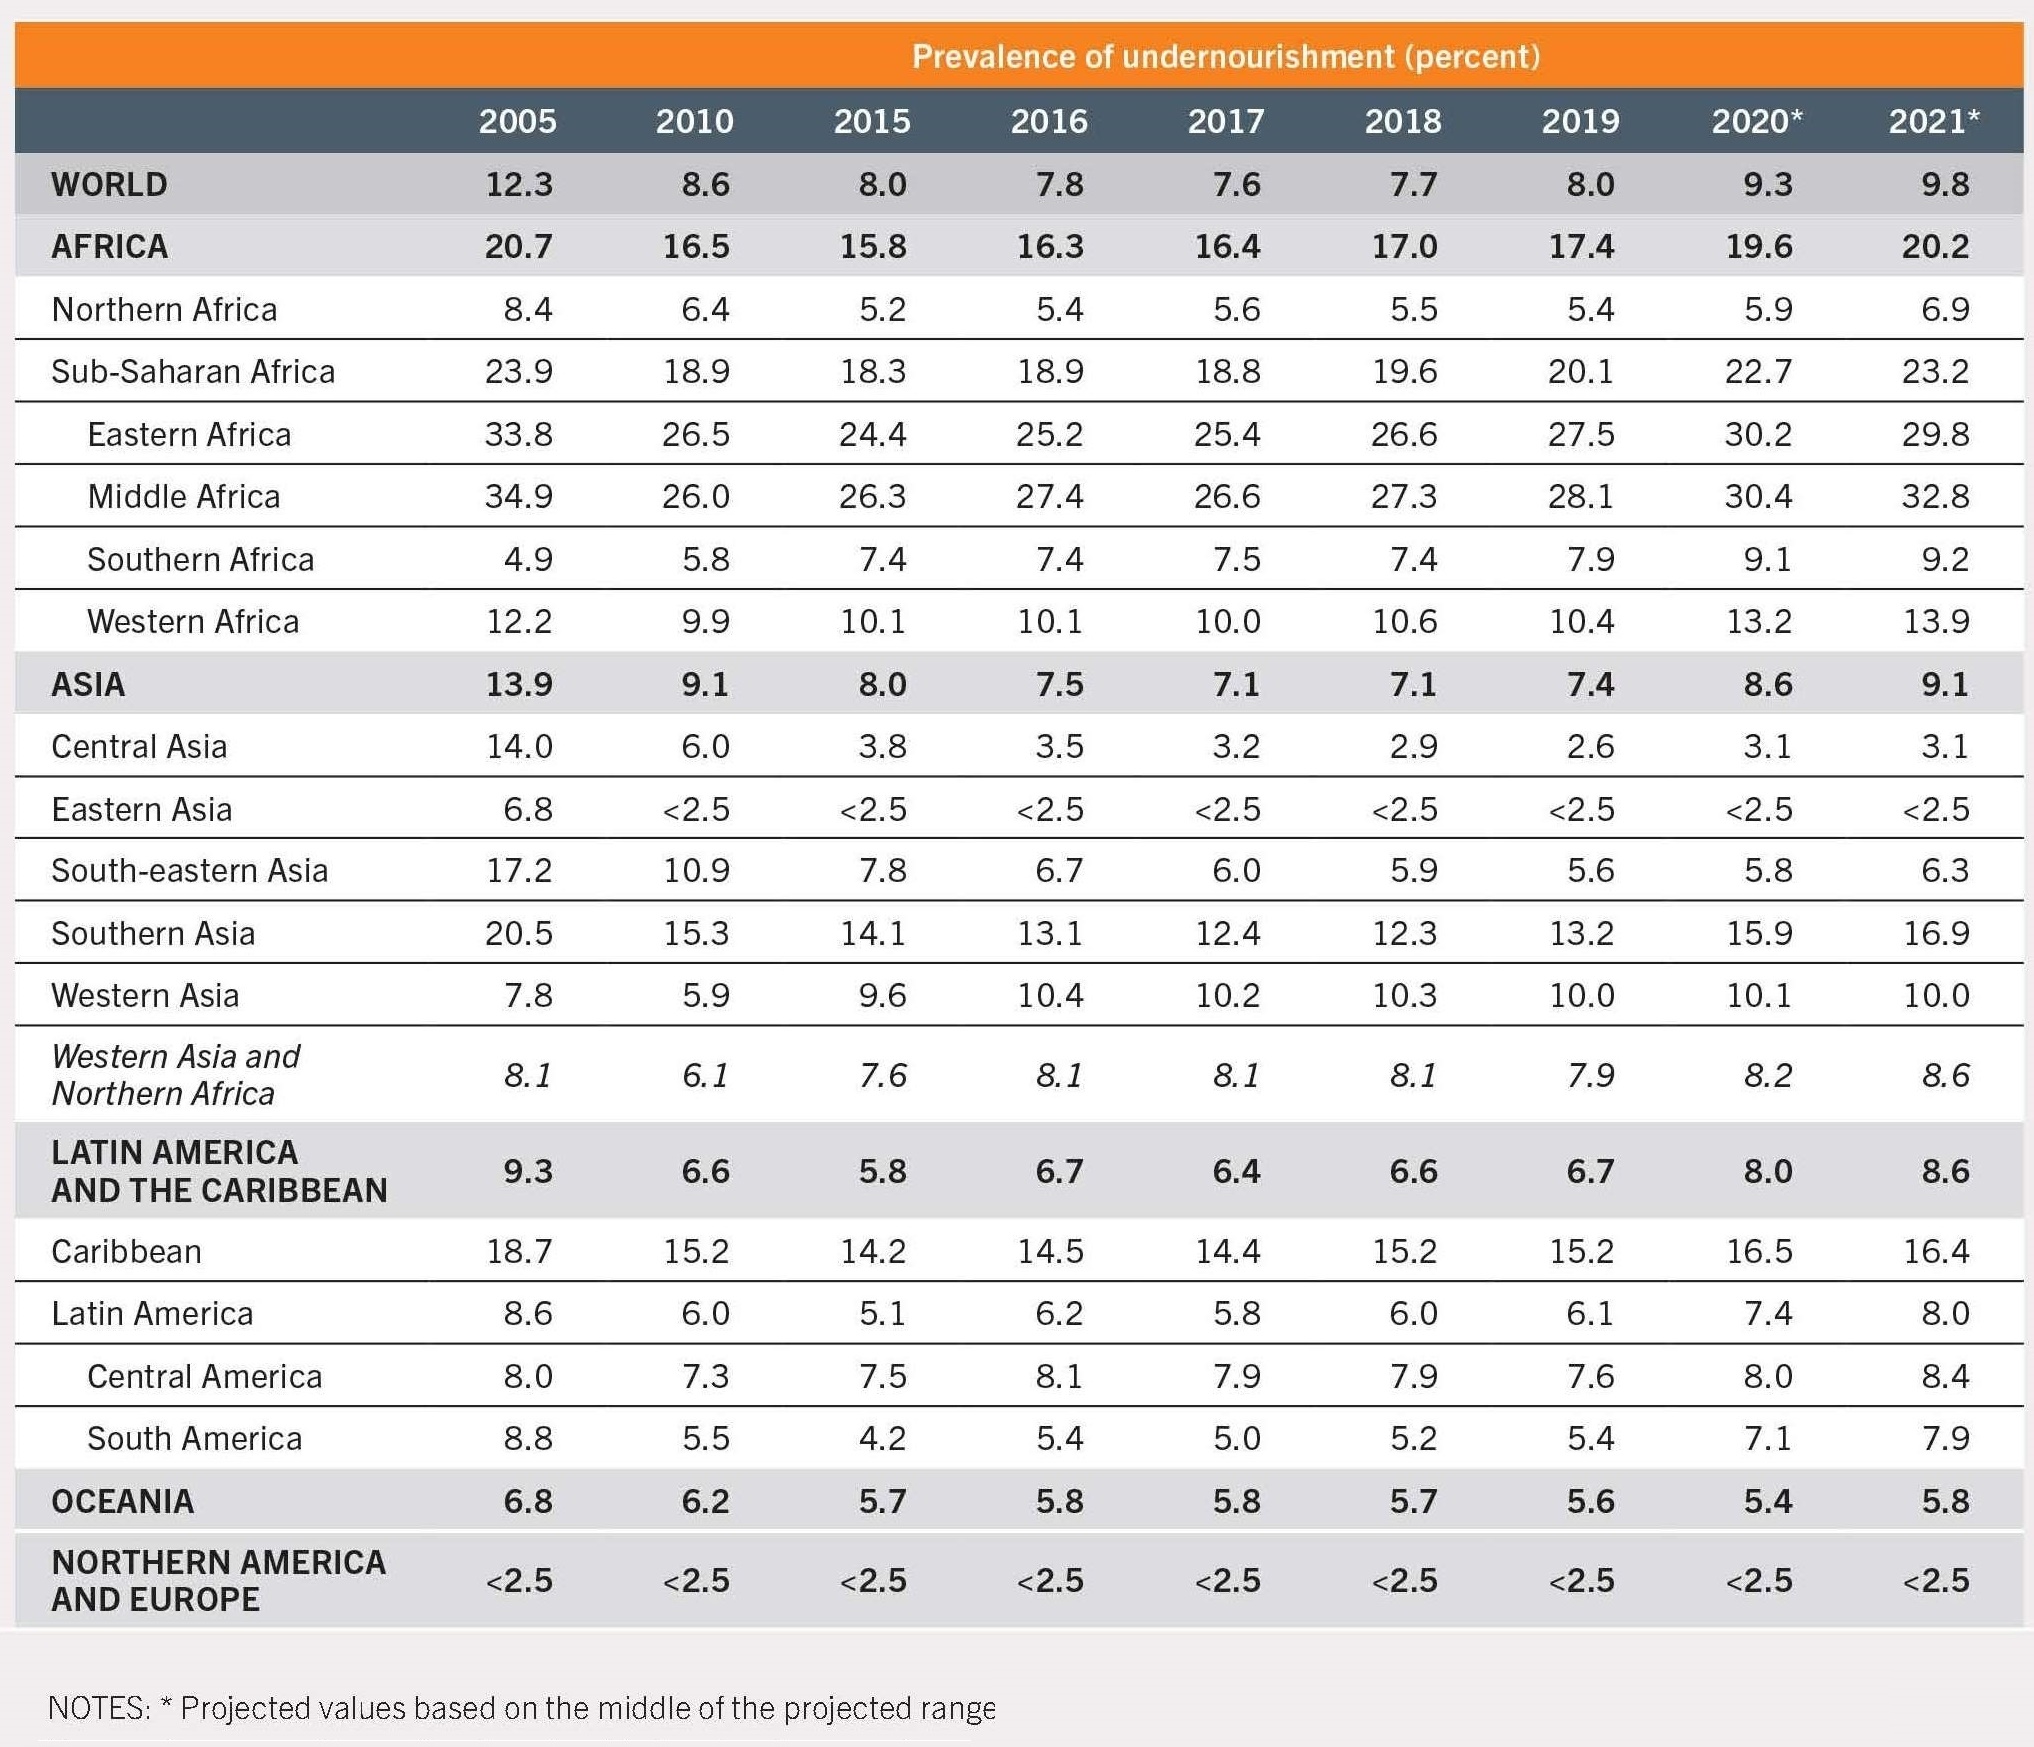
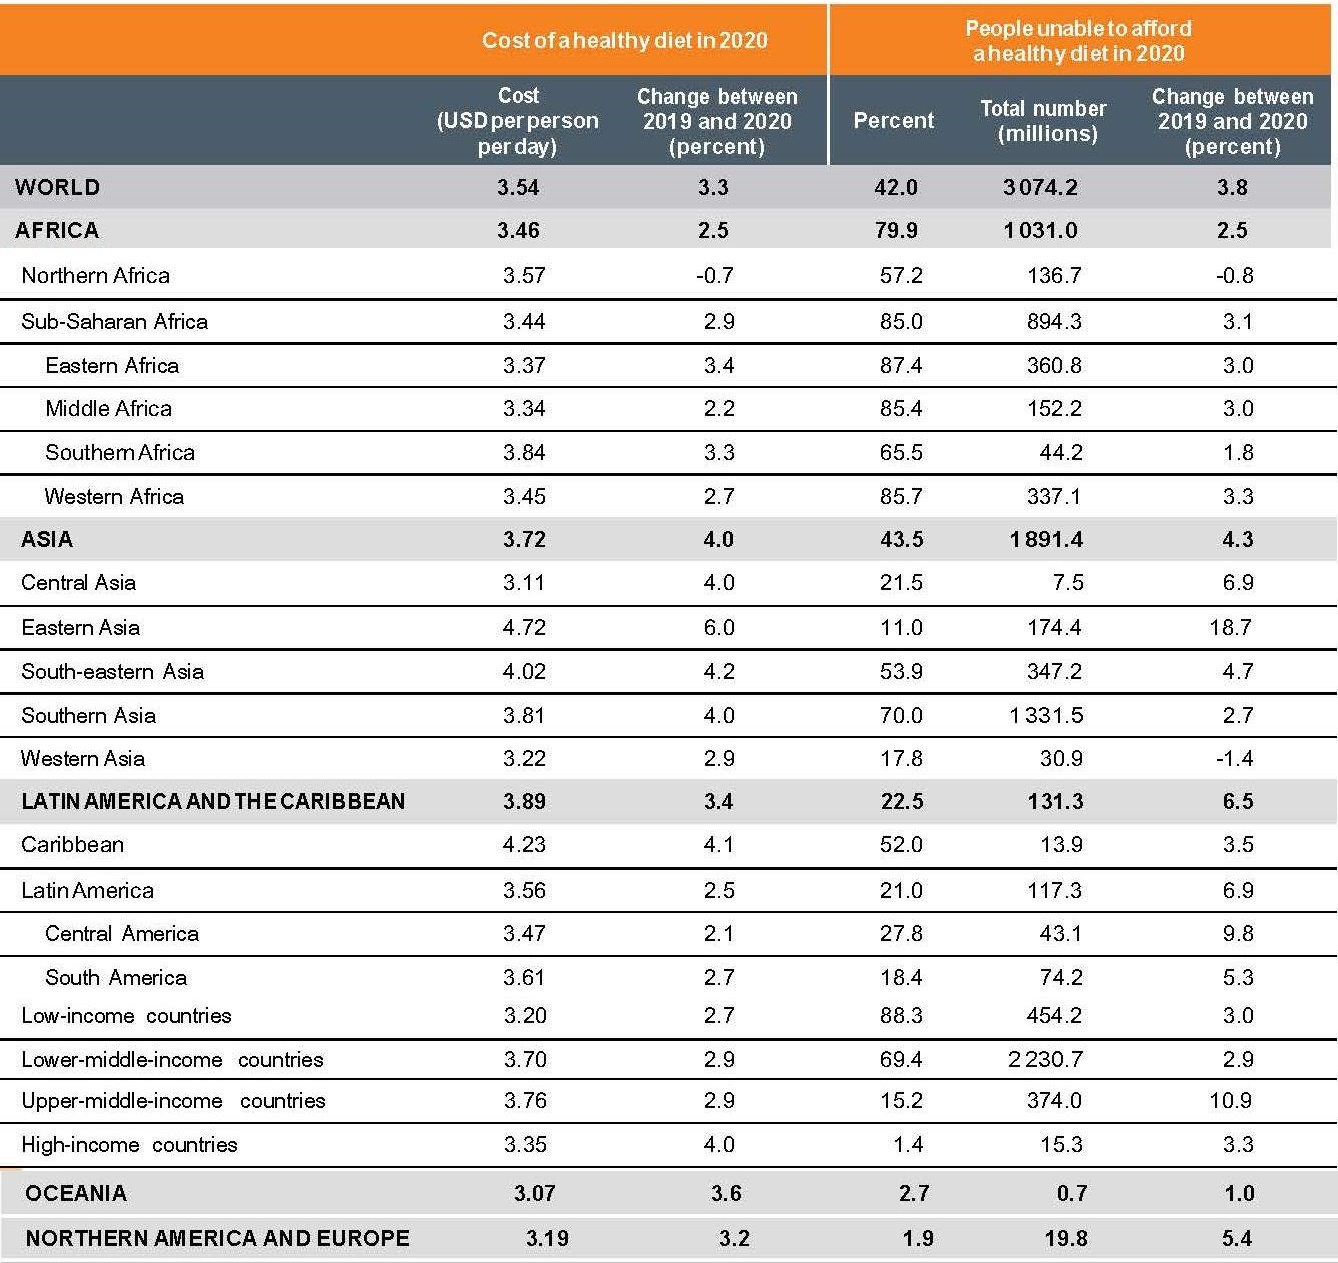
Ideally, the assessment of global hunger (and food security) should be based on national data on food consumption at the household (see Section 2.2) or the individual level (see Chapter 3). However, only a few countries conduct such surveys on an annual basis. Therefore, FBSs have a key role in the assessment of global hunger and food insecurity, published yearly in the report “The State of Food Security and Nutrition in the World” (SOFI) by FAO, IFAD, UNICEF, WFP and WHO (2022). This global monitoring report identifies countries in which food insecurity is most prevalent, monitors global hunger and food security trends over time, and provides projections of future global hunger and food insecurity. In this report, the per capita Dietary Energy Supply (DES) (Box 2.3 and Table 2.1) estimated from FBSs is used as a proxy for the average energy intake of the population. The per capita Dietary Energy Supply (DES) is available from FAOSTAT and calculated using an FAO global food composition database. The sum of the dietary energy content of the total food supply is then divided by the population size of the country and by 365 to calculate the per capita daily dietary energy supply (DES) available for human consumption (See Table 2.1 and Figure 2.2). However, DES does not yield any information on the affordability, access, or consumption of dietary energy by different population groups within a country, although the contribution of energy from individual food groups (Table 2.1) available for human consumption at the global level and within a country are calculated. Dietary Energy Supply is one of the three metrics used to estimate the prevalence of undernourishment (PoU), an indicator based on the percentage of individuals in the population who are in a condition of “undernourishment” (Table 2.2). PoU is one of the indicators of Sustainable Development Goal 2 (FAO, 2021e) and is defined by FAO as the condition of an individual whose habitual food consumption is insufficient to provide, on average, the amount of dietary energy required to maintain a normal, active, and healthy life. The national PoU estimates are reported as three-year moving averages, whereas the regional and global aggregates are reported as annual estimates. Table 2.2 highlights the regional disparities in PoU, with Africa having the highest burden of undernourishment as well as the region with the largest increase in the proportion of the population affected by undernourishment during 2005 to 2021. Disparities at the subregional levels also exist and are summarized in FAO, IFAD, UNICEF, WFP and WHO (2022). PoU, however, does not provide information on which specific individuals are undernourished or on the quality or diversity of the diet. The three metrics used to estimate PoU are:- Average dietary energy consumption (DEC). DEC is based on DES minus the incidence of caloric losses at retail distribution level
- Coefficient of Variation (CV) of energy intake. This is a measure of the level of inequalities in access to dietary energy consumption within a population
- Average minimum dietary energy requirement (MDER) per person for the national population in each of the covered countries. This represents the minimum amount of dietary energy per person that is considered adequate to ensure they maintain a minimum weight for health.
2.1.1b Food security indicators at national level
FAO (2006) has emphasized that “Food Security” is“a state in which all people, at all times, have physical and economic access to sufficient, safe and nutritious food to meet their dietary needs and food preferences for an active and healthy life”Five indicators present in the FAO “Suite of indicators of food security” are derived from 3y moving averages of FBS data and are shown in Box 2.3. Note that none of these indicators provide information on the affordability, accessibility, or consumption by different population groups including nutritionally vulnerable groups. For more details, see: FAO (2022). The average dietary energy supply (DES) adequacy is defined as the dietary energy supply as a percentage of the average dietary energy requirement. The latter is defined as the amount of dietary energy measured in kilocalories that is required by an individual to maintain body functions, health, and normal activity. The estimates of DES adequacy consider the age structure, sex, and height in each country. The dietary energy available from cereals, roots, and tubers (kcal/capita/day) (percent, 3y average) is an important nutritional indicator because items from these food groups are generally the least expensive. As a result, these staple foods are often a large part of the diet in low-income countries. Consequently, the nutrient density, dietary diversity, and micronutrient supply of these diets are low as described in detail in Chapter 8c.

2.1.1c Macronutrient availability at the national level
Macronutrients include carbohydrate, protein, and fats, and are the major source of energy in the diet. Macronutrient supply per capita can be estimated by combining supply data from FBSs expressed in g/capita/day with a food composition database for all primary and processed food products, as noted earlier. A common global food composition database is available from FAO and is used to estimate the nutrient supply data. The source of the nutrient composition data in this global database is not cited and any variation in the nutrient composition of food items across countries is not considered.
2.1.1d Micronutrient availability at national level
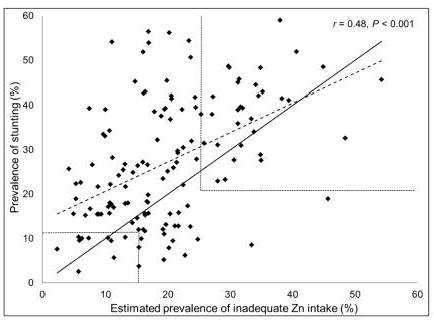
Efforts have been made by several investigators to use FBS for the assessment of the adequacy of micronutrient supply at the global level, in different regions of the world, and in individual countries. To accomplish this aim, FBS have been matched not only to energy, protein, and fat, but also to a full range of micronutrients. However, because the FAO FBS do not include data on the micronutrient supply per capita at the present time, investigators have compiled their own data on the micronutrient composition of the food commodities listed in the FAO FBS using data from food composition tables. As noted earlier, FAO FBS provide only national-level estimates per capita. This precludes the assessment of per capita micronutrient supply that takes into account age and sex and the differing micronutrient needs of the national population. However, by applying data from estimates on the age and sex distributions of the national population in each country, the theoretical population mean requirement for each micronutrient at the national level can be estimated. From this, the percentage of the population at risk of inadequacy has been calculated, defined as the proportion of the population with micronutrient intakes below the theoretical average micronutrient requirement of the population. The population distribution of intakes for each micronutrient is inferred based on the assumed mean per capita micronutrient intake and coefficients of variation (CV) for each micronutrient (taken from the literature). The latter takes into account inter-individual variation in micronutrient intakes arising from the inequities which affect access and availability of certain foods. This approach of assessing risk of inadequacy is related to the Estimated Average Requirement (EAR) cut-point method and described in Chapter 8b for a population. Several investigators have employed this approach to estimate risk of micronutrient inadequacy based on FBS data. Wuehler et al. (2005) were the first investigators to compare the adequacy of the food supply to meet the theoretical population mean requirement for zinc, based on FBS for 176 countries.
- Per capita nutrient supply expressed as a percentage of the theoretical mean population-adjusted nutrient requirements for each country;
- Percentage of the population that had an adequate usual intake, based on the assumed inter-person variability in micronutrient intakes obtained from the literature.
| Crops | Servingsb | Grams | Vit. A (µg RAE) | Vit. C (mg) | Ribofl. (mg) | Folate (µg) | Calcium (mg) | Zinc (mg) | % crop land |
|---|---|---|---|---|---|---|---|---|---|
| Barley | 0.50 | 23 | 0 | 0 | 0.07 | 4 | 8 | 0.6 | 1.8 |
| Broccoli | 0.50 | 39 | 30 | 25 | 0.05 | 42 | 16 | 0.2 | 1.0 |
| Cabbage | 0.50 | 38 | 2 | 14 | 0.01 | 11 | 18 | 0.1 | 0.4 |
| Carrots | 0.40 | 18 | 157 | 1 | 0.01 | 3 | 6 | 0.1 | 0.3 |
| Groundnuts | 0.50 | 14 | 0 | 0 | 0.02 | 27 | 10 | 0.5 | 3.8 |
| Okra | 0.50 | 40 | 6 | 7 | 0.02 | 18 | 31 | 0.2 | 0.8 |
| Pumpkin | 0.25 | 31 | 90 | 1 | 0.02 | 3 | 5 | 0.1 | 0.4 |
| Spinach | 0.25 | 23 | 118 | 2 | 0.05 | 33 | 31 | 0.2 | 0.6 |
| Total | 3.40 | 226 | 403 | 50 | 0.25 | 141 | 123 | 1.8 | 9.0 |
| %adequate intakes | — | — | 81 | %95 | %85 | %84 | <1% | %80 | — |
2.2. Household Surveys
Household surveys assess food available for consumption at the household level. This is defined as the total amount of food and beverages available for consumption in the household plus any foods prepared and consumed outside the household. Household surveys are of two types:- Household Food Consumption Surveys (HFCS). These were developed in the 1980s as an alternative to surveys at the individual level, and provide measurements of food consumption in the household.
- Household Consumption and Expenditure Surveys (HCES). In these surveys, food available for consumption is measured. These household surveys are widely used to inform on global food security and poverty, particularly in low‑ and middle-income economies. Such surveys can also be conducted in institutions such as those for institutionalized elderly.
2.2.1. Household Food Consumption Surveys (HFCS)
Household Food Consumption Surveys measure all food and beverages consumed within a household during a specified period. They require careful supervision by the interviewer and good cooperation of the respondents. In general, these surveys are more complicated and costly to undertake than HCES and hence were often conducted infrequently. Such surveys are rarely performed today. Instead, they have been replaced by surveys of food consumption at the individual level which are more informative, even if more costly (see Chapter 3). Two methods — weighed food records and household 24hr recalls — were used in the past to measure the household food consumption. Weighed household food records For this method, the food eaten by the household is recorded using weighed food records (also called food diaries). These are usually completed over at least a 1wk period, by either the householder or a fieldworker. During the survey period, the weight or volume of each food consumed at each meal is recorded, before subdivision into individual helpings USDA. Detailed descriptions of all foods, including brand names, and their method of preparation are recorded. For composite dishes, the amount of each raw ingredient used in the recipe and the final weight of the prepared composite dish is also recorded. In some surveys the plate waste from each meal is collected and separated so that waste for individual food items can be weighed and recorded. Generally however, kitchen and plate waste, and food fed to pets, is not accounted for in this method, and instead an arbitrary wastage factor is applied. Household 24-h recalls In this method, the household member responsible for the food preparation is interviewed to obtain information on both household composition and household food consumption over the previous 24h period. In the first stage of the interview, information is collected on the dishes and ingredients consumed, followed by details on the quantity, focusing particularly on those foods that are important sources of energy. A technical guide for measuring household food consumption using a 24h recall was developed by Swindale & Ohri-Vachaspati (1999). This guide provides detailed instructions and sample questionnaires that can be used to collect the data, quantify the portion sizes of food consumed, and analyze the results.2.2.2 Household Consumption and Expenditure Surveys
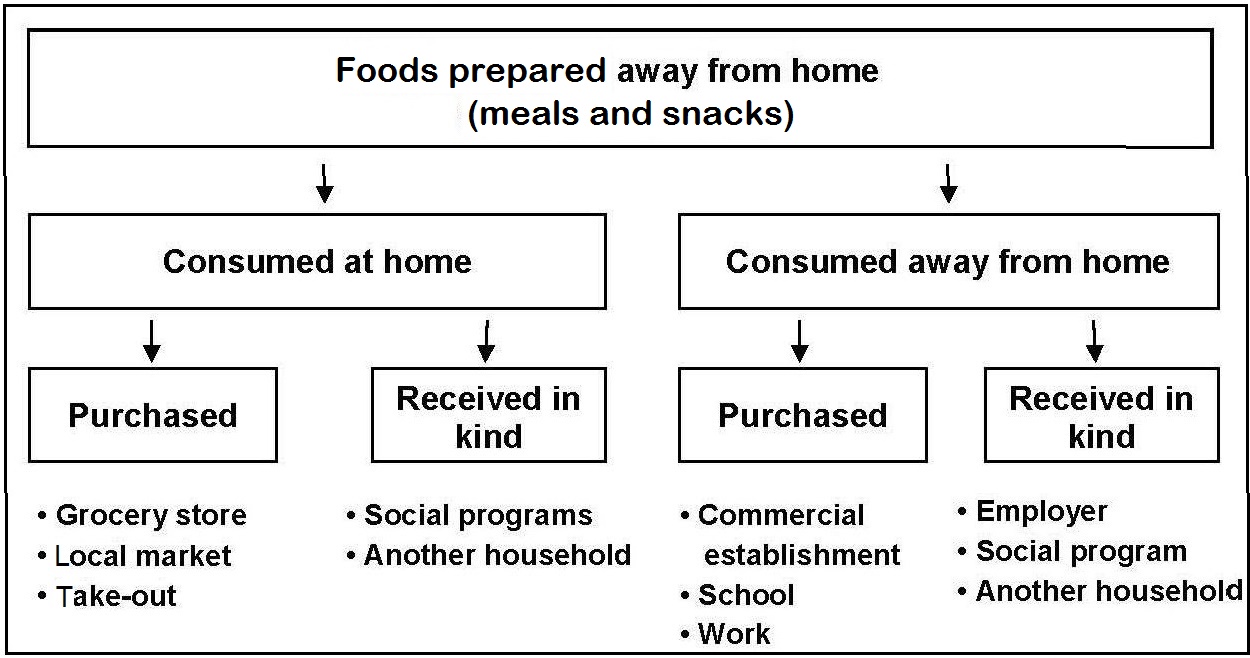
Household Consumption and Expenditure Surveys (HCES) are particularly important and typically performed within Household Expenditure Surveys (HES), i.e. economic surveys designed to inform national economic policy and usually implemented by national statistical agencies. HCES are less costly than HFCS and are widely used in low-income settings (FAO, 2023). They are usually conducted every 3‑5y. HCES refer to a heterogeneous group of complex surveys which include Household Income Expenditure Surveys (HIES), National Household Budget Surveys (NHBS), and Living Standards Measurement Surveys (LSMS). The latter (i.e, LSMS) are multi-topic surveys for which technical assistance is usually provided by the World Bank's Living Standard Measurement Study (LSMS) group. HCES were designed primarily to measure household food available for consumption in a reference period through the expenditure approach (i.e., the monetary value of the food). Over time, quantities of foods and beverages have also been collected in an effort to repurpose the surveys so they can serve other needs such as monitoring household-level food security. This has led to improvements in survey design to capture food data of a higher quality by including a more detailed food component module. For some HCES based on the concept of acquisition, data are collected on food entering the households acquired through purchases, own-production, and in‑kind, on the assumption that there were no major changes in household stocks during the survey period. An important limitation of this simplified methodology is related to the fact that some foods (e.g. grains) are not perishable and can be stored. Consequently, if the survey was conducted in a period of drawing-down stocks to meet current consumption, household consumption would be underestimated. On the contrary, if the survey was conducted in a period of accumulating stocks for later consumption, household consumption would be overestimated (Smith et al., 2014). As a result, use of these simplified HCES is no longer recommended. Alternatively, a combination of acquisition and consumption data can be collected in the HCES so that both food acquired through purchases and consumed from own-production and transfer are reported. Food consumption estimates generated from acquisition data or a combination of both acquisition and consumption data are usually referred to as “apparent consumption” or “food available for consumption” to distinguish it from actual consumption (Fiedler & Mwangi, 2016). Data collected in HCES on food available for consumption are quite often used as a proxy for the quantities eaten. HCES vary in their complexity and respondent burden. Data may be collected through a food diary, recall, or a list, with a reference period usually ranging from seven days to one month. When a list is used, the food and food groups specified varies, and when the list is short, the aggregated food items often lack the details needed to match the food items correctly with a food composition database. Food and beverages wasted, spoiled, or fed to pets or livestock are frequently not taken into account, although in some cases, waste may be weighed or a wastage factor applied. In general, in the past the capture of food and beverages prepared and consumed outside the home has also been poor in most HCES, although there is now a trend to improve the recording of the consumption of these items. For example, in some recent HCES a special module has been added to collect personal expenditure on snacks, meals, sweets, and drinks consumed outside the home. Adjustments are also made in some HCES for the presence of non-household members during the survey period. Ideally HCES should report all sources of food consumption, either purchased, received as gifts, or produced for household use. Variations in the survey designs of HCES across countries and over time within countries has created many challenges. To understand the implications of these variations on the accuracy and consistency of consumption measurements, a field study was conducted in Tanzania in 2007 and 2008 in which consumption estimates in 4,000 households was measured via eight different HCES survey designs, selected to capture the most common designs used in practice (Beegle et al., 2010). The effect of variations according to survey length, use of a household diary versus recall format, and level of detail of food items listed in the HCES on over- and under-reporting was investigated, using frequently supervised personal consumption diaries as the “gold standard”. The characteristics of the study population, notably whether they were illiterate or largely urban, was found to affect the magnitude of the underestimate of consumption using the HCES diary method. For the HCES recall method, the investigators recommended the use of a full long list of food commodities to recall within a reference period of 1 or 2 weeks rather than using a shorter recall list with few aggregated food categories. In summary, over‑ and under-reporting appeared to depend on the specific setting and varied with traits such as the literacy of the household, the share of consumption from home production, dietary diversity, and fraction of meals eaten in the household as opposed to consumption by individuals at restaurants and catering establishments (Beegle et al., 2010). The findings of Beegle et al. (2010) highlighted the need to improve the quality and utility of the food data components of the HCES surveys so they were more relevant to nutritionists and food security analysts, as well as the importance of harmonizing the HCES survey methodology. Consequently, a desk review of survey questionnaires and methods used in 100 available HCES surveys from low‑ and middle-income countries was conducted to identify key areas for improvement (Smith et al., 2014).- Choice of a diary or recall survey, and the appropriate reference period
- Food consumed away from home and cooked/packaged meals
- Measuring individual versus household consumption
- Measuring food acquisition versus food consumption
- Length and specificity of survey food lists
| Interview surveys (%) | Diary surveys (%) | All (%) | |
|---|---|---|---|
| Whether any data collected on food consumed away from homea | 83.3 | 100.0 | 90.0 |
| Detail of data collectionb | |||
| Only one line item (e.g., “Restaurant food”) | 36.0 | 7.9 | 23.9 |
| Data collected for multiple places of consumption | 14.0 | 35.0 | 23.3 |
| Data collected on food received in-kind | 46.0 | 65.0 | 54.4 |
| Data collected on specific food items | 28.0 | 40.0 | 32.9 |
| Snacks explicitly referred to | 26.0 | 35.1 | 29.9 |
| Alcoholic beverages explicitly referred to | 36.0 | 32.4 | 34.5 |
| Data collected at the individual level | 12.0 | 23.7 | 17.0 |
| Recall period b | |||
| Less than one week | 60 | 100.0 | 47.8 |
| One week | 48.0 | 0.0 | 26.7 |
| Two weeks | 12.0 | 0.0 | 6.7 |
| One month | 14.0 | 0.0 | 7.8 |
| Greater than one month | 20.0 | 0.0 | 11.1 |
- Low-income countries are advised to adopt recall interviews and a seven-day period
- Conduct one visit per household, spreading the sample over 12 months of fieldwork or
- Conduct two visits per household, when the timing of the visits is scheduled to capture seasonal variation
- All surveys should collect data on all main modes of food acquisition, namely: purchases; household's own production; received in kind
- For consumption, it should be clear whether the questions concern food intended for consumption (including food waste) or food actually consumed (net of food waste).
- Preferably include an individual household member-based meal module.
- Design a separate module, based on a clear definition of food away from home, with data collection around meal events including snacks and drinks
- Preferably adopt a standard food classification system for survey harmonisation e.g., food groups for COICOP classification list
- Report on standard units and non-standard units with related conversion factors, where feasible for households
From FAO and WORLD BANK (2018).
2.2.3 Uses of household surveys
Increasingly, HCES are being repurposed so that the data generated are not only used by economists for monitoring poverty, calculating national accounts, and as an input for consumer price indices, but also by food security analysts and nutritionists for nutrition-related analyses, based on the food consumption module of the HCES surveys (Smith et al., 2014; FAO and the World Bank, 2018). The World Bank has developed the most comprehensive repository of publicly available worldwide HCES data. An additional resource on HCES surveys is also available at the International Household Survey Network (HSN). Several resources are available to derive food security and nutrition indicators as well as nutrient-based indicators based on the food module of HCES surveys. Of these, two resources itemized below provide details of their methods of construction, uses, strengths and weaknesses.
- Data4Diet platform compiled by the INDDEX project (2018) is freely available at: Data4Diet.
- ADePT-FSM Food Security Module, a stand-alone application, based on the research of Moltedo et al. (2018) and developed by the World Bank and FAO.
- Prevalence of Undernourishment (PoU percent) is used by FAO to monitor the state of food insecurity in the world and is published annually in the State of Food Insecurity Report (SOFI), by FAO, IFAD, UNICEF, WFP and WHO (2022). Updated instructions related to the estimation of PoU using HCES data are available: FAO e-learning course
- Depth of Food Deficit (kcal/capita) represents the average per capita amount of additional energy (kcals) needed for undernourished individuals to meet the Average Dietary Energy Requirement (ADER). The Depth of Food Deficit is used to understand the degree of food insecurity in a country and compare the magnitude across countries. It does not measure dietary quality. For this estimate, the FAO probabilistc cut-point method is applied; see Moltedo et al. (2022) for more details. Cafiero et al. (2014) discusses the validity and reliability of this and other food security measurements.
- Balanced Diet Indicator is a measure of dietary quality and defined as the proportion of population with access to a balanced diet. For this, households are classified according to whether their dietary energy consumption from sources of protein, fat, and carbohydrate are below, within, or above recommended thresholds (i.e., protein, 10‑15%; fat, 15‑30%; total carbohydrate, 55‑75%). When significant proportions of the population fall outside these thresholds, then there is a possibility of adverse consequences associated with chronic diseases within a country.
- Household Adequacy of Fruit and Vegetable Consumption
expressed as g per capita per day,
provides a measure of diet quality and
an understanding of dietary patterns. It is
used to identify inadequacy of fruit
and vegetable consumption across countries
and for subgroups based on household
income, sex of head of household,
geographical area etc.
For this indicator, the
total weight in grams of fruit and vegetables consumed by
the household is
divided first by the number of household
members, followed by the days of survey reference period.
\[\small \mbox {≥ 400g/capita/day (i.e., 5 servings) = adequate}\]
\[\small \mbox {< 400g/capita/day = inadequate}\]
Table 2.6
presents a comparison on apparent
fruit and vegetable consumption
(edible g/capita/day) from HCES data by income
quintile in five countries and shows that
apparent fruit and vegetable consumption
only surpassed 400g/capita/day for income
quintiles 3, 4, and 5 for Country 2.
Table 2.6 Fruit and vegetable apparent consumption by income quintiles in five countries. From ADePT-FSM software. Fruit and vegetable consumption
(Income Quintile — edible g/capita/day)1 (Lowest) 2 3 4 5 (Highest) Country 2 220 360 471 603 674 Country 3 123 148 163 194 258 Country 4 127 202 248 295 349 Country 5 116 173 173 205 261 Country 6 58 75 86 98 119 - Proportion of animal protein (as percent of total protein). If details are available, this measure can be used as a proxy of dietary quality at the population level. Higher percentage of animal source protein likely to be associated with a higher absolute consumption of animal source foods that provide a variety of micronutrients. The latter are either less abundant or less bioavailable in plant-based food sources. Food commodities considered as animal source foods include meat, fish, eggs, milk, and cheese. Calculated as: \[\small \mbox{% animal protein = }\] \[\frac{\mbox{Total protein animal sources (g) × 100}}{ \mbox{ Total protein (g) from all foods}}\] See ADePT-FSM SOFTWARE for more details.
- Apparent zinc intake (mg/capita/day) at national, income quintile, and urban-rural levels. Note that the apparent zinc intake is not adjusted for bioavailability in view of the paucity of phytate data currently available in FCTs
- Zinc density (mg/1000kcal) at national, income quintile, and urban-rural levels. Density computed as mean of the nutrient density of the diet of the household
- Apparent folate intake (expressed as Dietary Folate Equivalents — µg/capita/day) at national, income quintile, and urban-rural levels
- Dietary Folate Equivalent density (ug/1000kcal) at national, income quintile, and urban-rural levels
- Apparent vitamin A intake expressed as Retinol Eqivalents (µg RE/capita/day) or Retinol Activity Equivalents (µg RAE/capita/day) at national, income quintile, and urban-rural levels
- Retinol Activity Equivalent density (µg RAE/1000kcal) at national, income quintile, and urban-rural levels
- Apparent total iron intake (mg/capita/day) at national, income quintile, and urban-rural levels
- Apparent heme iron intake (as percent of total iron) at national, income quintile, and urban-rural levels. Heme iron content estimated from raw and cooked meat from literature sources
- Prevalence of Nutrient Inadequacy (PoNI) for vitamins B1,B2,B6, B12, vitamin A, vitamin C, Ca, Zn. Estimates via probabilistic EAR cut-point method.
- Upgrading ADePT-FSM for analyzing food security statistics using household consumption and expenditure survey data
- Moltedo et al. (2022)
2.3 Comparison of Food Balance Sheets (FBS)
and
Household Consumption and Expenditure Surveys (HCES)
Both FBS and HCES are prone to measurement errors, as itemized in
Table 2.7.
For more details, see Thar et al.
(2020)
and FAO
(2001)
for FBS, and Fiedler et al.
(2012)
and Smith et al.
(2014)
for HCES.
| Food Balance Sheets | Household Consumption and Expenditure Surveys | |
|---|---|---|
| Objective | Assessment of food available for consumption at national level | Assessment of food available for consumption at the household level |
| Advantages |
• Not expensive • Publicly available for over 245 countries & territories from 1961 • Snapshot of overall agri-food situation • Updated regularly with standardized methodology so compatible for comparison and trends of per capita food supplies in terms of quantity, caloric value, protein & fat content |
• HCESs conducted regularly & publicly available • More detailed in sub-national, sex, economic strata breakdown • Fortfiable foods can be identified from percentage of HHs consuming & purchasing individual food • Report metrics that characterise food security, dietary quality, household nutrient supply, & apparent nutrient intake at individual level |
| Disadvantages |
• Quality of FBSs limited by completeness and accuracy of in-country reports; data on country's stocks not always available • Food loss, food waste, homegrown food, & food fed to animals is under-recorded • Number of migrants & tourists not always subtracted from population estimates • Wrong matching of foods with FCTs as ambiguous details of foods listed • Nutrient supply data estimated from a common global FCT so differences in composition of foods across countries not considered • Distribution of food at sub-national level or population specific characteristics such as age, sex, SES not provided so high risk groups cannot be identified • No data on home-grown food or details of processed foods |
• Relatively expensive & requires insti- tutional capacity & trained personnel • Household food supply module not yet standardized across countries • Individual data on food purchases, food consumed from home production, food received in kind, and details of food consumed away from home not always collected • At-home food list varies (50-300 items) & not always specific leading to incorrect matching with FCTs • Seasonality of food consumption patterns not always considered • Food given to non-HH members not always reported • HCESs do not provide information on distribution of foods consumed among household members or by life-stage groups • Apparent male equivalent intake estimates limited by lack of data on physical activity, physiological state of household members |