Gibson RS1,
Principles of
Nutritional
Assessment:
Evaluation of
nutrient
intakes and diets
3rd Edition August, 2024
Abstract
This chapter addresses the assessment of nutrient intakes and the planning of nutritious diets at both the individual and population level. To assess intakes at the individual level for nutrients with an Average Requirement (AR) and Recommended Intake (RI), the likelihood of inadequacy can be assessed by using a statistical test that examines the individual's observed usual intake in combination with measures of variability of intakes and requirements. For nutrients with an Adequate Intake (AI) and Upper Intake Level (UL), statistical tests can be used to determine the level of confidence that an individual's observed usual intake is at or above the AI, or below the UL, respectively. Alternatively, published guidelines can provide a qualitative interpretation of the adequacy of an individual's usual intake of nutrients and macronutrients in relation to the Nutrient Reference Values (NRVs), and the Acceptable Macronutrient Distribution Range (expressed as a percentage of energy) (AMDR), respectively. For assessment of intakes at the group level, the proportion with usual nutrient intakes below the AR and/or above the UL can be calculated by the probability approach or the simpler Estimated Average Requirement (EAR) cutpoint method. For nutrients with an AI that represents the mean or median intake of an apparently healthy group, when the group mean or median intake is at or above the AI, then it is likely that the prevalence of inadequate intakes for the group is low. When planning nutritious diets for individuals, usual nutrient intakes should fall between the RI98 and the UL, or between the AI or UL. For energy and macronutrients, however, the targets for the diet are the individual's Estimated Energy Requirement (EER) and within the AMDR, respectively. For planning nutritious diets for groups, the current distribution of usual nutrient intakes should be altered to ensure a low prevalence of undesirable nutrient intakes, whereas for the appropriate energy level, the group mean energy intake must be close to the group mean EER. For the macronutrients, diets must be planned to reduce the prevalence of intakes outside the AMDR. CITE AS: Gibson RS. Principles of Nutritional Assessment: Nutrient intakes and diets https://nutritionalassessment.org/evn/Email: Rosalind.Gibson@Otago.AC.NZ
Licensed under CC-BY-4.0
( PDF )
- An Average Requirement (AR), referred, in some countries, as an Estimated Average requirement (EAR).
- A Recommended Intake (RI98), termed a Recommended Dietary Allowance (RDA) in Canada and the U.S.
- An Adequate Intake (AI) and/or an Upper Intake Level (UL),
8b.1 Applications of Nutrient Reference Values in diet assessment and planning
| NRV | Assessment of nutrient intakes of healthy individual or groups |
|---|---|
| AR Individual | Use (with information on variability of requirement
and intake) to examine the probability that the usual intake is inadequate |
| AR Group | The proportion of the group with usual intake below the AR
is an estimate of the group prevalence of inadequacy |
| RI Individual | Usual intake at or above the RI has a low probability
of inadequacy |
| RI Group | Do not use to assess intakes of groups |
| AI Individual | Intake at or above the AI can be assumed adequate;
no assessment can be made if intake is below the AI |
| AI Group | Median usual intake at or above the AI implies a low prev- alence of inadequate intakes; no assessment can be made if median intake is below the AI |
| UL Individual | Usual intake above the UL may place an individual
at risk of adverse effects from excessive intake |
| UL Group | The proportion of a group with usual intake above the UL may
be at potential risk of adverse effects of excessive intake |
| NRV | Planning for nutritious diets for healthy individuals or groups |
| AR Individual | Do not use the AR as an intake goal; usual intake
at this level has a 50% probability of inadequacy |
| AR Group | Plan for an acceptably low proportion of a group with intakes
below the AR. Note that mean intake will likely be above the RI |
| RI Individual | Aim for this intake; usual intake at or above the
RI has a low probability of inadequacy |
| RI Group | Do not use the RI to plan mean intakes for groups. In
almost all cases, mean intake at the RI will lead to an unacceptably high prevalence of inadequate intakes |
| AI Individual | Aim for this intake; usual intake at or above the AI
has a low probability of inadequacy |
| AI Group | Plan for median intake at this level; median usual intake at or
above the AI implies a low prevalence of inadequate intakes |
| UL Individual | Plan for usual intake to remain below the UL to
avoid potential risk of adverse effects from excessive intake |
| UL Group | Plan to minimize the proportion of a group with intakes above
the UL to minimize the risk of adverse effects of excessive intake |
| Application | Examples |
|---|---|
| Dietary guidelines | Important in formulating food-based dietary guidance, e.g.:
• US Dietary Guidelines for Americans • Eating Well with Canada's Food Guide (2007) • USDA Food Patterns • UK Eatwell Guide |
| Nutrition monitoring | Needed to asses nutritional health
on a national level.
• US NHANES and What We Eat in America analyses • Canadian Community Health Survey analyses • UK Diet and Nutrition Survey Rolling Program |
| Food assistance programs | Important to guide the design of healthier federal nutrition assistance programs • School meals, WIC, SNAP, child and adult care programs • Administration on Aging programs |
| Health Professionals | Used for dietary counseling and education and to design:
• healthy diets for institutions such as hospitals • healthy diets for long-term care facilities and prisons |
| Nutrition research | Needed to study how diet can help
prevent disease and provide a frame of reference in research |
| Military | Used to
• Ensure nutrient needs are met for armed forces • Plan healthy meals • Procure food, including military rations |
| Nutrition labeling | Can be used for the nutrition facts supplement facts labels. Such labels can help consumers make healthier food choices |
| Food/supplement industries | Used to develop healthy foods and safe supplements |
| Global nutrient standards | Provide a framework for other
countries and international organizations when setting their own standards |
8b.2 Using the NRVs to assess nutrient intakes of an individual
None of the methods of assessing nutrient-intake data described below are capable of identifying with certainty that an individual's recorded nutrient intake is adequate or excessive. This is because the actual nutrient requirement of an individual is not known. In addition, the recorded nutrient-intake data only approximate the individual's “usual” nutrient intake, because of normal day-to-day variation in the diet (Chapter 6) combined with measurement errors (Chapter 5). For these reasons, dietary data alone can only provide an estimate of the probability of an inadequate or excessive intake of a nutrient. The reliability of this risk estimate depends on the quality of the dietary data collected and the method used to calculate the estimate of risk. However, only when biochemical, anthropometric, and clinical assessments are combined with the dietary investigation can a valid assessment of an individual's nutritional status be made. Table 8b.1 summarizes the appropriate Nutrient Reference Values for assessing the nutrient intakes of individuals. Details on planning diets for individuals are given in Section 8b.4.1. The outline in this table should always be followed when assessing nutrient intakes (and planning diets) for individuals.8b.2.1 Using the Average Requirement
It is not possible to compare the intake of an individual with his or her own requirement, because the actual requirement for any given individual is not known, as noted earlier. Moreover, the reported nutrient intake of an individual is unlikely to represent their mean usual intake because of within-person variation in nutrient intakes combined with measurement errors, as discussed in Chapters 5 and 6. In view of these uncertainties, two approaches have been developed to assess the nutrient intakes of an individual. The first approach involves a statistical method that estimates the level of confidence that the usual nutrient intake of an individual meets the corresponding AR and is discussed below. The second approach is a qualitative interpretation of the nutrient intakes of an individual and is described in Section 8b.2.4. The statistical approach is based on the following assumptions:- The AR is the best estimate of an individual's requirement.
- There is person-to-person variation in the requirements (i.e., between-person variation), best described by the standard deviation of the requirement estimate (SDR). The latter indicates how much the individual's requirement for a nutrient can deviate from the median requirement in the population. In the absence of data for SDR, IOM (2003) has assumed a CV of 10% for most nutrients. The SDR is then calculated from the AR and CV as: SDR = CV × AR.
- Mean reported intake of an individual is the best estimate of the usual intake of an individual.
- Day-to-day variation in intake (i.e., within-person variation) for an individual exists and can be described by the within-person standard deviation of intakes (SDwithin). The latter indicates how much the reported intake may deviate from the usual intake.
| Standardized Difference (Diff/SDD) i.e. Z-score | Inter- pretation | Probability of correct interpretation |
|---|---|---|
| + 2.0 | Usual intake is adequate | 0.98 |
| + 1.65 | 0.95 | |
| + 1.5 | 0.93 | |
| + 1.0 | 0.85 | |
| + 0.5 | 0.70 | |
| 0.0 | 0.50 | |
| − 0.5 | 0.30 | |
| − 1.0 | 0.15 | |
| − 1.5 | 0.07 | |
| − 1.65 | 0.05 | |
| − 2.0 | 0.02 |
8b.2.2 Using the Adequate Intake
The approach described in Section 8b.2.1 cannot be used for those nutrients for which there is insufficient available information to set an AR. Instead, a statistically based hypothesis testing procedure can be used to compare an individual's intake to the AI. Details are also given in IOM (2000). Again, the procedure consists of a Z‑test involving the difference between the intake of the individual and the AI, relative to the estimated within-person standard deviation of the daily intake of the nutrient of interest. If there is a high degree of confidence that the usual nutrient intake of an individual equals or exceeds the AI, after applying the appropriate statistical test, the diet is almost certainly likely to be adequate in a given nutrient. In contrast, no evaluation can be made of the probability of an inadequate nutrient intake when the intake of the nutrient falls below the AI because the requirement is unknown. In such cases, the interpretation must rely solely on the judgment of nutrition professionals. In general, to eliminate the possibility of nutrient inadequacy, an individual should be encouraged to increase his or her nutrient intake to meet the AI (Barr et al. 2002; Murphy and Poos, 2002).8b.2.3 Using the Upper Intake Level
The Upper Intake Level (UL) can be used to determine whether the usual intake of an individual is so high that it poses a risk of adverse health effects. Another statistical test can be used to determine the level of confidence that the usual intake of an individual is below the UL; details of this test are also given in (IOM, 2000). Whether the UL applies to the intake from supplements, fortificants, or medications or to the total intake from all sources depends on the nutrient (Barr et al. 2002; Murphy and Poos, 2002). Hypothetical examples of assessing the adequacy or excessive intakes of riboflavin, folate, calcium, vitamin D and zinc for an elderly woman are given in Barr et al. (2002). In these examples, the appropriate statistical methods were employed to determine the level of confidence that the woman's usual intake met her requirements (for riboflavin, folate, and zinc based on an AR), or exceeded the AI (for calcium and vitamin D at that time), but was below the UL; see Barr et al. (2002) for more details. Note that an AR has now been set for calcium and vitamin D by IOM (2011).8b.2.4 Using the qualitative interpretation of an individual's nutrient intake
| Recommended Intake (RI98) |
|---|
|
If the intake is > RI98 there is a high level of confid- ence that intake is adequate if observed over a large number of days |
|
If the intake is between the Average Require- ment (AR) and the RI98, the intake probably needs to be improved because the probability of adequacy is less than 97.5% |
|
If the intake < AR, then the intake very likely
needs to be improved because the probability of adequacy is less than 50% |
| Adequate Intake (AI) |
|
If the intake > AI, then the mean intake is likely adequate if observed over a large number of days |
|
If the intake < AI, then the adequacy of intake cannot be determined |
| Upper Intake Level (UL) |
|
If the intake > UL, there is a potential risk of adverse effects if observed over a large number of days |
|
If the intake < UL, the intake is likely safe if observed over a large number of days |
8b.2.5 Using the Acceptable Macronutrient Distribution Range
If Acceptable Macronutrient Distribution Ranges (AMDRs) have been set for individuals for carbohydrate, protein, total fat, linoleic acid, and α-linolenic acid, e.g., by IOM (2003) (see Section 8a.5.6), then the usual intake of macronutrients (expressed as a percentage of total energy intake) for an individual should fall within these ranges. If the usual intake of a macronutrient is below the AMDR, there is potential for an increased risk of both inadequate intake of the essential macronutrient and chronic diseases. The potential for an increased risk of chronic diseases may also occur if the usual intake of a macronutrient exceeds the AMDR (IOM, 2000).8b.2.6 Using Energy Intakes
The average estimated energy requirements (EER) are based on a defined age, sex, height, weight, and physical activity level. Hence, a mean usual energy intake for an individual either above or below their calculated EER, would theoretically result in either weight gain or weight loss, respectively. However, even based on several days of energy intake from an individual, it is difficult to determine energy balance. Therefore, in practice recent body weight is often used to assess the likely adequacy of the energy intake of an individual (Barr, 2006). Note that no probability of adequacy can be assessed for energy, because the intake of energy is almost always related to energy requirements, violating one of the assumptions of the probability approach (see Section 8b.3.1).8b.3 Using NRVs to assess nutrient intakes of groups
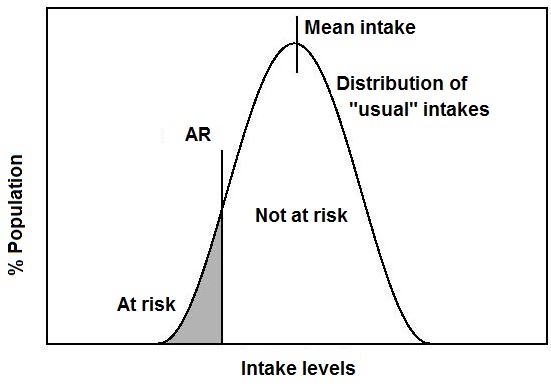
information is often required on the proportion of a group with usual intake of a nutrient below their own requirement. An estimate of the proportion of the group with an excessive usual nutrient intake is also important, as it exposes that portion of the group to the risk of adverse effects (See Table 8b.1). Unfortunately, there are some examples in the literature in which the use of the NRVs to determine the prevalence of inadequate intakes has been incorrect, leading to misleading interpretations (Trumbo et al., 2010). These may include: Comparison of the usual intakes of the individuals with the RI98. Reporting the proportion of a group with usual intakes below the RI98 is inappropriate because it will always lead to an overestimate of the true prevalence of inadequacy. By definition, the RI98 is set at 2SD above the AR, and thus exceeds the requirements of more than 97% of all individuals in the group. Comparison of the group mean or median intake with the AR. This is inappropriate because even if the mean intake equals the AR, a high proportion of the population (≈ 50%) will be expected to have inadequate usual intakes based on the definition of the AR. Comparison of the group mean or median intake with the RI98. This is inappropriate because it does not take into account the wide variation in the distribution of usual intakes within the group, which almost always exceeds the variability in the requirement distribution. Hence, even if the mean/median intake equals or even exceeds the RI98, there may still be a substantial proportion of the group who will have intakes less than their own requirements, as shown in Box 8b.1. Indeed, to ensure a low prevalence of intakes below the AR, the mean or median nutrient intakes of the group should exceed the RI98, often by a considerable amount. Comparison of the usual intakes of individuals with the AI . This cannot be used to assess the prevalence of inadequate intakes. Comparison of the group mean or median intake with the AI. Provided the AI used has been set based on the mean intake of a healthy population, then if the mean or median intake of the group is at or above the AI, the group can be assumed to have a low prevalence of inadequate intakes. However, if the mean or median intake of the group is below the AI, it is not possible to make any assumptions about the prevalence of inadequacy.Box 8b.1. Inappropriate use of the RI98 to assess group mean intakes
Note that in cases when the mean or median intake is
compared with the NRVs, the distribution of nutrient
intakes does not need to be adjusted for day-to-day
variation because only the mean or median intake is being examined. However,
the only situation in which this approach is appropriate is for nutrients with an AI
based on the mean/median intake of a healthy population, or for energy (see Section 8b.4.2).
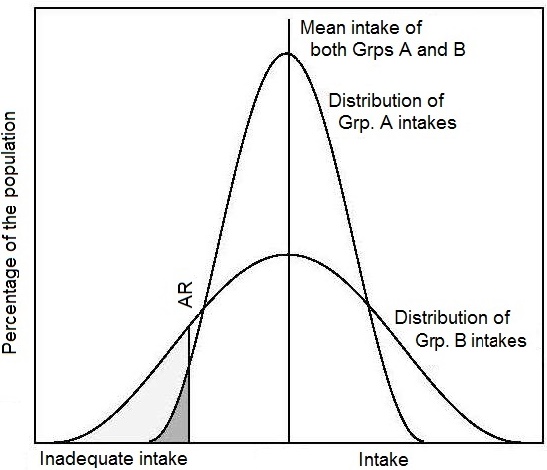
When the objective is to compare the adequacy of nutrient intakes
for two groups, then the prevalence of inadequate intakes for each
group should be determined, and not the mean intake for each
group. The latter can be the same as shown in
Figure 8b.2,
even though there were differences in the proportions in each group with
inadequate intakes. This situation occurs when the intakes in one
group are much more variable than in the
other group
(Murphy and Poos, 2002,
Figure 8b.2).
| Percentile | 5th | 10th | 15th | 25th | 50th | 75th | 85th | 90th | 95th |
| Vit. B-6 intake (mg/d) | 0.92 | 1.02 | 1.11 | 1.24 | 1.51 | 1.90 | 2.13 | 2.31 | 2.65 |
- The data above show selected percentiles of the distribution of vitamin B6 intakes for women 51–70y adjusted for within-person variability from U.S National Health and Nutrition Examination Survey III 1988–1994 (NHANES III). The US AR for vitamin B6 is 1.3mg/d and the U.S RI98 is 1.5mg/d for women of this age group.
- When the median intake (1.51mg/d) for the group is compared with the RI98 of 1.5mg/d, it may seem that inadequate intake of vitamin B6 is not a problem.
- However, when the distribution of usual intakes is compared with the AR cutpoint, the AR value (1.3mg/d) falls between the 25th percentile and the 50th percentile of usual intakes. Hence, more than 25 percent of usual intakes are below the AR cutpoint.
- The result is that the prevalence of inadequacy within the group is greater than 25 percent (but less than 50 percent).
8b.3.1 Full Probability Approach
The full probability approach was first described by Beaton (1972), with the goal of providing a more reliable estimate for the proportion of individuals within a population group with inadequate intakes (i.e., intakes below their requirements). Because there is no information about the actual requirements of each individual, this procedure does not identify with certainty which individuals have inadequate intakes. Hence, it cannot be used to screen those individuals for nutrient inadequacy. The statistical approach combines the distributions of both requirements and individual usual nutrient intakes for the group to estimate the proportion of individuals with inadequate intakes. The probability of inadequacy for each individual in the group is calculated first, followed by an estimate of the average of the individual probabilities for the group. This yields the group prevalence of inadequate intakes. The statistical approach is based on three key assumptions:- Intakes and requirements are independent
- The median and the variance of the distribution of requirements are known
- The shape of the requirement distribution follows some known statistical model (normal, lognormal etc) (IOM, 2003).
- The AR for each nutrient for the particular sex and life-stage group of individuals.
- The distribution of requirements for each nutrient among similar individuals: for most nutrients, this is not precisely known. In the absence of such information, the distribution of requirements for most nutrients is assumed to be normal with a coefficient of variation of 10% (or 15% for niacin) about the AR. Notable exceptions are the iron requirement distributions for menstruating adolescent women 14–18y; and menstruating adult women, both of which are positively skewed. The iron requirement distributions for children 1–3y, and 4–18y are also estimated by the US IOM (2001) to be skewed.
- Reliable data on the distribution of usual nutrient intakes for the group being assessed.
- Knowledge of the expected correlation between intakes and requirements among individuals: for all nutrients (except energy); this is assumed to be very low.
| Class | A. Individual's intake in terms of the distribution of requirements |
B. Probability that individual intake doesn't meet the requirement |
|---|---|---|
| 1 | < −2SD | 1.00 |
| 2 | −2SD to −1SD | 0.93 |
| 3 | −1SD to mean | 0.69 |
| 4 | mean to + 1SD | 0.31 |
| 5 | + 1SD to + 2SD | 0.07 |
| 6 | > +2SD | 0.00 |
| Nutrient | EAR | RDA | AI | UL |
|---|---|---|---|---|
| Calcium | √ | √ | √ | |
| Copper | √ | √ | √ | |
| Chromium | √ | |||
| Iodine | √ | √ | √ | |
| Iron | √ | √ | √ | |
| Magnesium | √ | √ | √ | |
| Manganese | √ | √ | ||
| Molybdenum | √ | √ | √ | |
| Phosphorus | √ | √ | √ | |
| Selenium | √ | √ | √ | |
| Zinc | √ | √ | √ | |
| Thiamin | √ | √ | ||
| Riboflavin | √ | √ | ||
| Niacin | √ | √ | √ | |
| Vitamin B6 | √ | √ | √ | |
| Folate | √ | √ | √ | |
| Vitamin B12 | √ | √ | ||
| Vitamin C | √ | √ | √ | |
| Vitamin A | √ | √ | √ | |
| Vitamin E | √ | √ | √ | |
| Vitamin D | √ | √ | √ | |
| Fluoride | √ | √ | ||
| Sodium | √ | √ | ||
| Potassium | √ | |||
| Biotin | √ | |||
| Choline | √ | √ | ||
| Vitamin K | √ | |||
| Pantothenic Acid | √ |
8b.3.2 EAR Cutpoint Method
A shortcut to the probability approach has been developed by Beaton (1994), and adopted by the U.S Food and Nutrition Board (IOM, 2000) for assessing the proportion of inadequate intakes in a group. This simpler version is termed the EAR cutpoint method and does not require information on the exact requirement distribution. The EAR cutpoint method can be used, providing the following three conditions are met:- Intakes and requirements of the nutrient are independent (assumed to be true for all nutrients, but is not true for energy).
- The distribution of intakes in the population group must be more variable than the distribution of requirements (which is generally the case in free-living Individuals).
- The distribution of requirements in the group is approximately symmetrical about the AR (but this is not the case for the iron requirements of children aged 1 to 8y or women between the ages of menarche and menopause).
8b.3.3 Using 77% Percent of the Recommended Intake (RI98) as a Cutoff Value
In some tables of NRVs, estimated average requirements (i.e, ARs) for nutrients are not specified, as noted earlier. In such cases, approximations for the estimated average requirements can be calculated, provided the RI (or equivalent) for each nutrient approximates the mean requirement estimate plus two standard deviations, with a specified coefficient of variation (i.e., RI98) (NRC, 1986). The proportion of the population with usual intakes below the derived AR is then calculated, as described in Section 8b.3.2. A cutoff value of 77% of the RI is sometimes used. This approach assumes a CV for the nutrient of 15% about the AR. Such an assumption will yield a conservative estimate of nutrient inadequacy compared to that based on a CV for the nutrient of 10% about the AR. Use of the latter CV corresponds to a cutoff of approximately 83% of the RI instead of 77%; hence, it will yield a larger percentage of the group likely to have inadequate intakes. Briefel et al. (2000) used 77% of the 1989 U.S RDA values for zinc as a cutoff to evaluate the zinc intakes of the U.S population in the National Health and Nutrition Examination Survey III 1988–1994, prior to the release of the EAR for zinc by the IOM (2001). Few ARs have been published by WHO / FAO. However, a table of conversion factors that can be used for calculating ARs from the WHO / FAO (2004) RNIs (equivalent to RIs) is available in WHO (2006) (Annex C) along with a table in the text depicting the calculated AR values. No ARs can be calculated from the WHO / FAO RNIs for iron for adolescent girls, menstruating women (19–50y), or children (< 9y) because of the skewed distribution of requirements for iron for these groups. The conversion factors that have been used in WHO (2006) to calculate the WHO/FAO ARs are based on standard deviations derived by the U.S Food and Nutrition Board of the Institute of Medicine and used to calculate the U.S and Canadian Recommended Dietary Allowances (RI equivalent).8b.3.4 Use of Adequate Intake
The Adequate Intake (AI) is estimated in a number of different ways, depending on the nutrient and the life stage group. When the AI has been set based on the mean intake of a healthy population, then if the study group's mean intake is at or above the AI, the group can be assumed to have a low prevalence of inadequate intakes (Table 8b.1), although the actual prevalence of inadequate intakes cannot be established. When the AI is used in this way, the distribution of intakes does not have to be adjusted for within-person variation because only the mean or median intake is being examined for comparison. However, no assumptions can be made about the prevalence of inadequate intakes when the mean or median intake of a group falls below the AI because the distribution of requirements is unknown (Barr et al. 2002; Murphy and Poos, 2002).8b.3.5 Use of Upper Intake Level
When any comparison is made with the Upper Intake Level (UL), it is important to note if the UL assessment for the nutrient of interest is based on information on usual daily intakes from all sources or only from supplements, fortificants, and medications. The prevalence of potentially excessive intakes is estimated by assessing the proportion of the group with usual intakes above the UL. The goal is to have a low proportion of a group with intakes above the UL (Barr et al. 2002; Murphy and Poos, 2002). Before an assessment is made, the intake distribution must be adjusted to remove the effect of within-person variation in intakes (see Chapter 3). Because of the uncertainties and the variability in individual sensitivities to the adverse effects, the actual prevalence of adverse health effects in the group will seldom be equal to the proportion with intakes above the UL. Moshfegh et al. (2005) assessed the proportion of the population in the U.S NHANES (2001–2002) survey with intakes above the UL for eleven nutrients.| Thiamin (mg) | Magnesium (mg) | Calcium (mg) | Vitamin C (mg) |
|
|---|---|---|---|---|
| Group Mean intake | 1.44 | 212 | 838 | 96 |
| Requirement | 0.5 (AR) | 110 (AR) | 800 (1997 AI) | 22 (AR) |
| inadequacy (%) | < 1 | 5 | Low | < 1% |
| UL | None set | 110 | 2500 | 650 |
| Excessive intake (%) | Unknown | Unknown (supps only) | < 1 | < 1 |
8b.3.6 Energy Intakes
As noted for individuals (Section 8b.2.6), the probability approach cannot be used to estimate the prevalence of inadequate or excessive intakes of energy in a group because of the expected high correlation between energy intake and energy requirements among individuals. The latter violates one of the assumptions required for the adoption of the probability approach. Instead, the group mean energy intake can be compared with the mean estimated energy requirement (EER) for the group, taking into account the ages, sexes, heights, weights, and physical activity levels of the individuals in the group. If the mean intake is equal to the mean EER, energy intake can assumed to be adequate, whereas if the mean intake exceeds or falls below the EER, then the group on average is likely to be gaining or losing weight, respectively. Again, because only the mean is calculated, the intake distribution does not need to be adjusted for within-person variation in intakes, as noted for the AI (Section 8b.3.4). Alternatively, as under-reporting of energy intake in dietary assessment is ubiquitous, the adequacy of the group's energy intake can also be assessed using the body mass index (BMI). The proportion of a group of U.S adults with a BMI below or above the normal range of 18.5–25kg/m2 would be classified as having inadequate or excessive energy intakes, respectively for their activity level, whereas for U.S children and adolescents, the proportion with BMI-for-age < 5th percentile or ≥ 85th percentile should be used (Kuczmarski and Flegal, 2000). For international use for children 0-5y, underweight and overweight are defined as BMI-for-age <−2 Z‑score and above +2 Z‑score, respectively, of the WHO Child Growth Standards 0–5y (WHO, 2006), but <−2 Z‑score and above +1 Z‑score for the BMI-for-age WHO Growth Reference for children 5–19y (de Onis et al, 2006).8b.3.7 Macronutrient Intakes
For macronutrients with a reference intake range, the proportion of the group with usual intakes (adjusted for within-person day-to-day variation) outside the AMDR can be assessed. If the prevalence outside the range is high, then an intervention may be needed.8b.4 Using the NRVs for planning nutritious diets
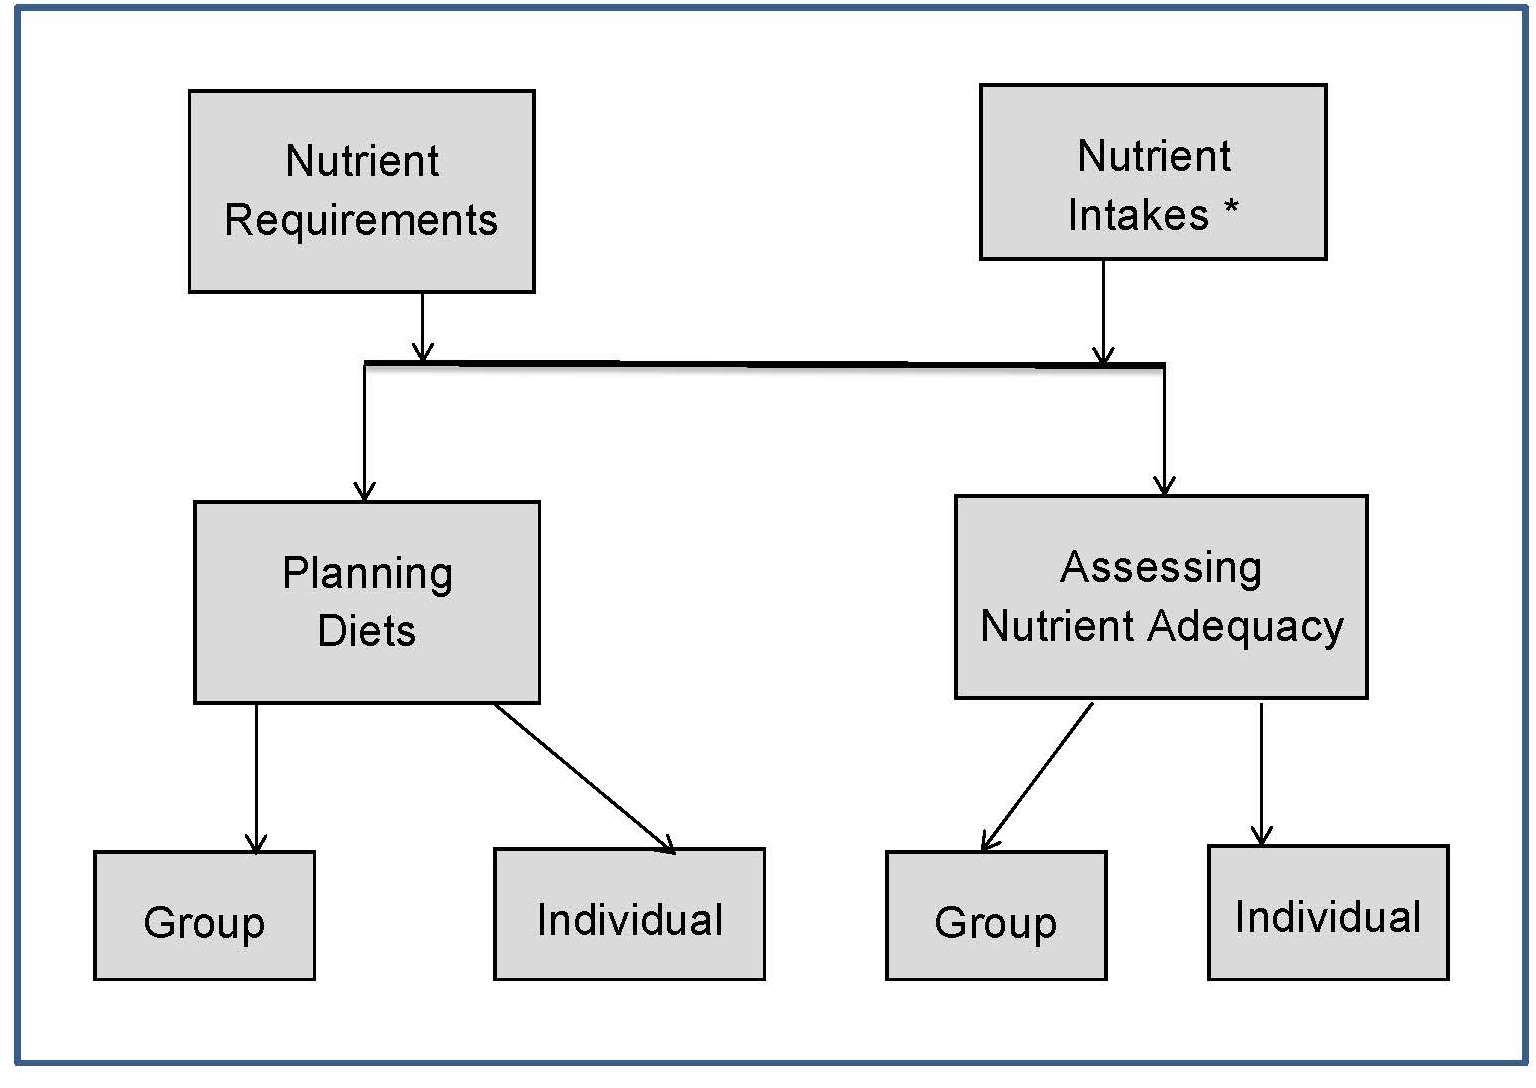
As shown in Figure 8b.1, NRVs can also be used to plan diets at the individual or group level. Planning for an individual involves setting intake targets that ensure a nutritionally adequate diet, while also being acceptable, whereas for a group, the goal is to determine a desirable intake distribution that minimizes the prevalence of inadequate or excessive intakes. Numerous applications for planning nutritious diets exist, including dietary counseling for individuals, developing menus for institutions, or designing interventions for high-risk groups, as shown in Table 8b.2.8b.4.1 Using the NRVs for planning nutritious diets of individuals
The goal of planning a diet for an individual is to ensure there is a low probability of inadequacy and the potential risk of an excessive intake is small. This can be achieved by ensuring that the usual intake of the individual meets the RI98, because by definition, the intake at that level should be adequate for almost all (98%) individuals. Use of the AR as a goal for the nutrient intake of an individual is not appropriate because an intake at this level would be adequate for only 50% of individuals. When setting the RI98, however, knowledge about the distribution of requirements for many nutrients remains limited, so an assumption about the coefficient of variation of the requirement is often made, as noted in Chapter 8a. This has led to debate over the use of the RI98 as the goal for planning diets at the individual level (Beaton, 2006; Murphy et al. , 2006). Nevertheless, at present the RI98 remains the most appropriate target for the nutrient intake for individuals, at least until more accurate data on the requirement distributions are available. To avoid a potential risk of adverse effects, the nutrient intakes of an individual should not exceed the UL. This means that the diet of an individual should have usual nutrient intakes that fall between the RI98 and the UL. For those nutrients with only an AI, then nutrient intakes for an individual should fall between the AI and the UL. Planning for an individual's energy intake is unlike other nutrients. For most nutrients, there is essentially no risk if an individual consumes an intake that may marginally exceed his or her requirement (i.e., the RI98 exceeds the requirements of almost all (97–98%) individuals in a group). However, in the case of energy, consuming an energy intake that met the requirements of 97–98% of a group would lead to weight gain in that proportion of individuals. Accordingly, energy requirements of individuals are best monitored by assessing their body weight status — those with BMI in the normal range who are maintaining their weight (or gaining weight appropriately during growth) are considered to be meeting their energy requirement. If an estimate of energy needs is required for planning purposes, an approximation can be provided by using the equations for EER, which consider age, sex, height, weight and physical activity level. However, because there is variability in energy requirements even among individuals with the same characteristics, body weight must be monitored and intake adjusted where necessary (Barr et al., 2003). For macronutrients (expressed as percentage of energy), the goal is to ensure that the intakes from the individual's diet falls within the AMDR ranges.| Thiamin (mg) | Ribo- flavin (mg) | Folate (µg) DFE | Zinc (mg) | Phos- phorus (mg) |
|
|---|---|---|---|---|---|
| Man's avg. daily intake | 1.3 | 1.1 | 400 | 10.3 | 3,800 |
| RI98 | 1.2 | 1.3 | 400 | 11.0 | 700 |
| UL | None | None | 1,000 | 40 | 4,000 |
| Proposed change in in intake | None | Inc- rease | None | Inc- rease slightly | None |
8b.4.2 Using NRVs for planning nutritious diets for groups
Planning diets for groups is more complex than for individuals because of the wide range of nutrient intakes in a group arising from differences in the amount and types of food consumed. The goal is to alter the distribution of current nutrient intakes within the group to reduce the prevalence of inadequate and excessive intakes, where necessary. The three NRVs used for planning nutrient intakes for a group are the AR, the AI, and the UL; the RI98 should not be used for groups. For more details on planning diets for groups, the reader is referred to IOM (2003) and Murphy and Barr (2005). The EAR cutpoint method described in Section 8b.3.2 is also used for planning the diets of groups, with the goal of minimizing the proportion of the group with intakes below the AR and above the UL. Steps in planning diets for groups, using the EAR cutpoint method are shown in Box 8b.2. The method can only be used for those nutrients with a defined AR and UL, and for which the requirement distribution is approximately symmetrical.Box 8b.2. The four steps involved in planning diets for groups using the
EAR cutpoint method
As noted earlier, because iron requirements
for certain life-stage groups are skewed, the full probability
approach must be used to calculate the prevalence of inadequate or
excessive intakes for these groups using software described earlier
(Chapter 3; Section 3.3.2). Alternatively, published tables of the distribution
of iron requirements can be used to estimate manually the
probability of inadequacy for each individual within the group,
from which the probability of inadequacy for the whole
group can be calculated; refer to
Section 8b.3.1
for more details.
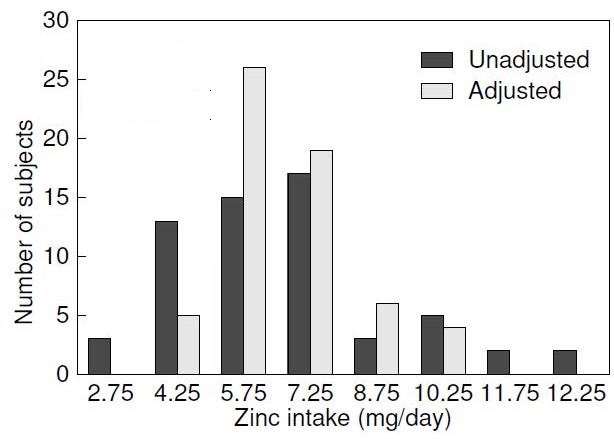
Note that irrespective of which method is used, the distributions of
observed intakes, both before and after the intervention,
must always be adjusted statistically to yield the
usual intake distribution and thus remove the effects of day-to-day
variations; see Chapter 3 for details of the statistical techniques to use.
When only an AI has been set for a nutrient, it is not possible to
estimate the prevalence of inadequate intakes in the group for that
nutrient, and instead the goal is to ensure that the average intake of
the group for that nutrient is at or above the AI.
- Decide on the goals of the planning process. This involves deciding on what is considered an acceptable, practical, and low prevalence of undesirable intakes (i.e., inadequate intakes below the AR and excessive intakes above the UL) given the situation. The acceptable prevalence of inadequacy is often 2–3%, although this may not always be practical.
- Select the target distribution of usual intakes that meets the defined goals. This means that knowledge of the current intake distributions for the nutrients of concern is already available. A change may be required for only certain nutrients to either increase the intakes (i.e., move the current distribution to the right) so that fewer people have intakes for those nutrients below the AR, or decrease intakes (move the current distribution to the left) so fewer people have intakes above the UL.
- Plan a menu to achieve the goals for all of the nutrients of concern. To accomplish this step, first the nutrient content of the menus must be calculated using appropriate dietary assessment software and food composition data, and taking into account the foods and amounts that will be actually consumed rather than those provided by the menus. The goal here might be for the menu to provide nutrient levels at the midpoint of the target distribution for each nutrient of concern.
- Assess the results following the implementation of the new menu. This stage involves collecting dietary data from the group of interest, calculating their nutrient intakes, and comparing the usual intake distributions for the nutrients of interest to the goals set in step 1. If the planning goals have not been met, then some or all of the steps may need to be repeated until the results are satisfactory.
| Current Intake* | Target Intake | Change | |
|---|---|---|---|
| Mean | 9.6 | 10.4 | +0.8 |
| Percentile | |||
| 2nd | 6.2 | 7.0 | +0.8 |
| 5th | 6.5 | 7.3 | +0.8 |
| 10th | 7.1 | 7.9 | +0.8 |
| 25th | 8.1 | 8.9 | +0.8 |
| 50th | 9.4 | 10.2 | +0.8 |
| 75th | 10.9 | 11.7 | +0.8 |
| 90th | 12.5 | 13.3 | +0.8 |
| 95th | 13.5 | 14.3 | +0.8 |
| 99th | 15.5 | 16.3 | +0.8 |
| % below EAR† | 9% | 2% | −7% |
| % above UL‡ | 0% | 0% | None |
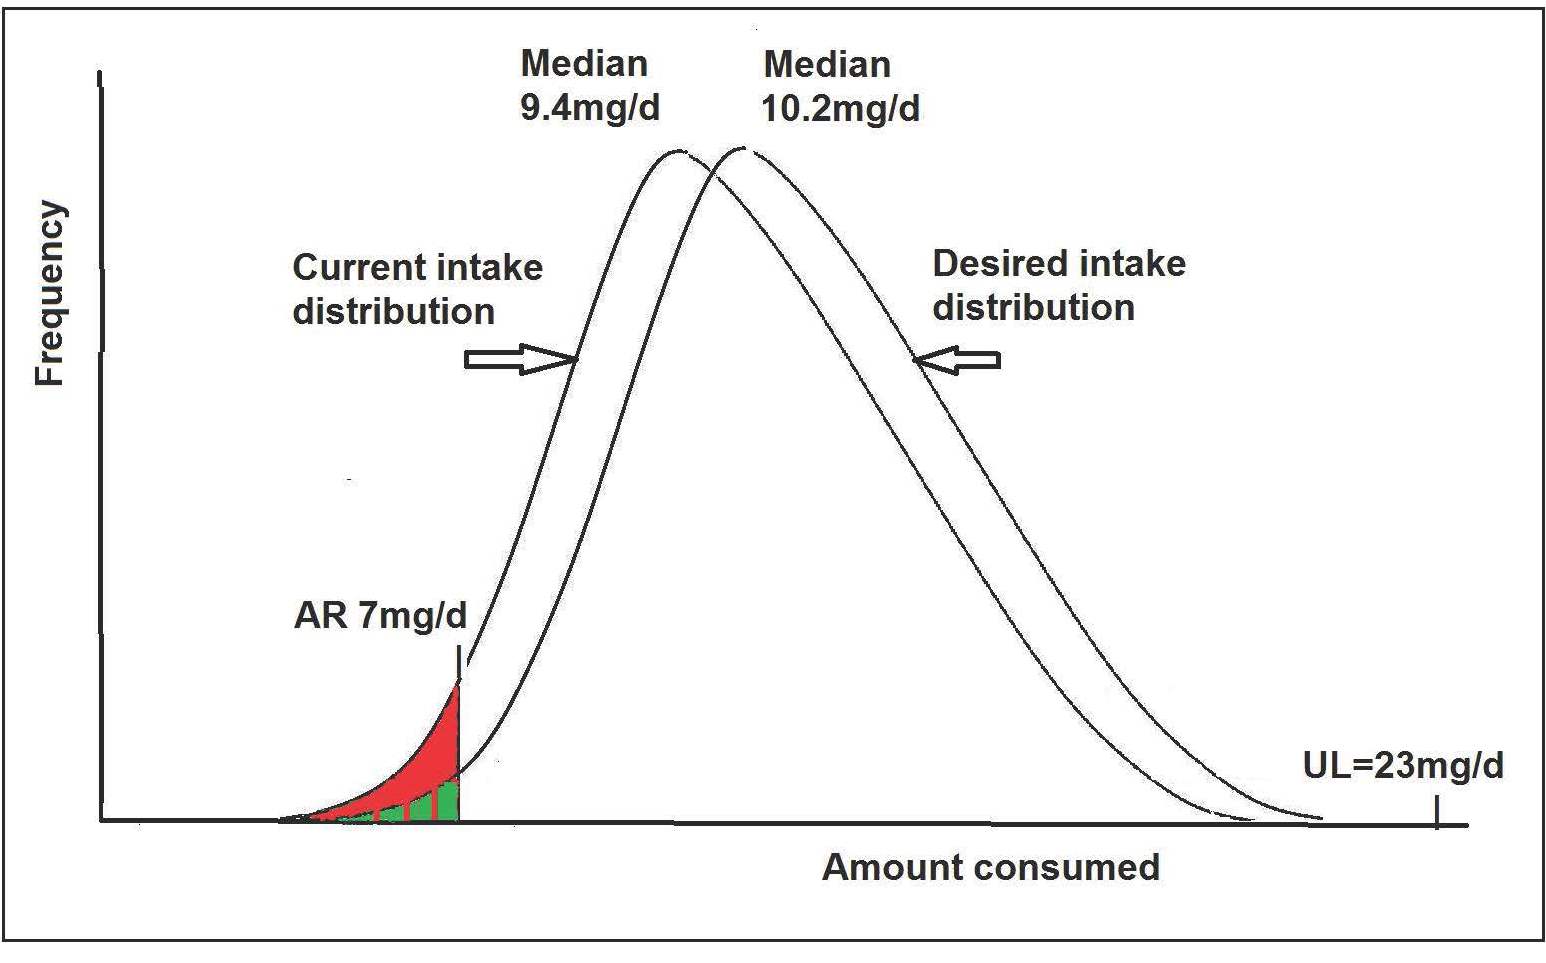
Example of the process for planning zinc intakes using the EAR cut-point method
In the example shown in Table 8b.9, the first step is to select the planning goal, which in this example will be to have no more than 2–3% of girls aged 9–13y to have usual zinc intakes less than the AR (i.e., 7mg) and no more than 2–3% above the UL (i.e., 23mg/d). Step 2 is to estimate the target intake distribution. To complete this step, information on the current intake distribution for zinc is needed. In this example, data on the usual zinc intake distribution of girls aged 9–13y from NHANES III is used (Table 8b.9). Note that the estimated prevalence of inadequate intakes based on this current intake distribution is 9%, above the goal of no more than 2–3% below the AR. Note also that the AR for zinc of 7mg approximates the 10th percentile of the current usual intake distribution. Hence, assuming our planning goal is to reduce the prevalence of inadequate intakes to 2%, then the distribution of usual intake needs to be shifted such that the current intake at the 2nd percentile (currently 6.2mg/d) is increased to correspond to the AR of 7mg. Thus, an increase of 0.8mg is needed, and assuming that the shape of the distribution does not change, then intake at every percentile would also increase by 0.8mg/d. This would yield a target median intake of 9.4 + 0.8 = 10.2mg as shown in Table 8b.9. Figure 8b.5 shows the current usual intake distribution and the proposed target usual intake distribution for this group of girls aged 9–13y.