Book

Kirkpatrick S     Principles of
Nutritional Assessment:
Measurement Error in
Dietary Assessment

3rd Edition    June 2024


Abstract

Data on food consumption are typically collected using self-report methods. The resulting data are affected by measurement errors that can have serious consequences for study findings and inter­pretation. Measurement error refers to the difference between true and observed intake and may be random or system­atic. Errors arise due to the inter­action of the participant with the assessment method and can also be generateded by inter­viewers and coders, as well as by limitations in food compo­sition data­bases. Accordingly, the type and extent of the errors vary with the method used and how it is implemented, the target popu­la­tion of interest, and the nutrients and foods investigated.

Both unaddressed random and system­atic measurement error can introduce substantial bias into results. Pertinent to surveillance and monitoring, measurement error can lead to erroneous inferences about the proportions of a popu­la­tion with inadequate or excessive intakes relative to nutrient requirement estimates and food group recom­mend­ations. In epidemiologic research, measurement error distorts observed associations between diet and disease, as well as reducing statistical power to detect such associations. In inter­vention research, measurement error can mask the effects of the inter­vention, particularly if the error is differential between inter­vention and control groups. Strategies to minimize and/or mitigate error are therefore fundamental to research making use of dietary intake data and should be considered early in study design through to reporting results and implications. CITE AS:     Kirkpatrick S,     Principles of Nutritional Assessment: Measurement Error in Dietary Assessment https://nutritionalassessment.org/errors/
Email: skirkpat@connect.uwaterloo.ca
Licensed under CC-BY-4.0

5.1 Measure­ment error in dietary intake data

Sources of both random and system­atic error in commonly used methods (Chapter 3) for measuring dietary intake are discussed in this chapter. Chapters 6 and 7 discuss the related concepts of repro­ducibility and validity. Error associated with the compilation of nutrient compo­sition data and the nutrient analysis of food items are discussed in Chapter 4. Error introduced by inap­pro­priate study design and/or sampling of the target popu­la­tion are covered in detail in survey methods and epidemi­ology texts, and considered briefly in Chapter 1.

In the context of dietary assess­ment, measurement error refers to the difference between true and observed intake and may be random or system­atic. Data affected by random error only are not biased but they are imprecise. Accordingly, random measurement error generally affects the repro­ducibility (Chapter 6) of a given method; that is, the extent to which the method yields similar results when used repeatedly in the same situation. A key source of random error is within-person variation in intake over time. Therefore, random error is larger in data collected using methods that capture intake over the short term, or quantitative daily consumption methods (Chapter 3), including 24h dietary recalls and food records, compared to those like food frequency question­naires that aim to capture intake over a longer period, such as a year (Kipnis et al., 2003; Freedman et al., 2014, 2015; Kirkpatrick et al., 2022b).

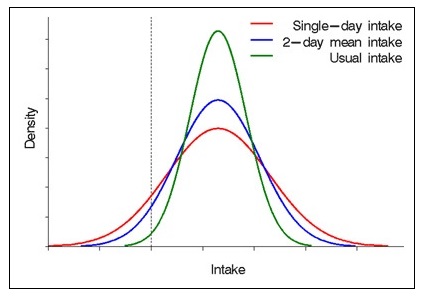
The random error in short-term data is largely driven by within-person day-to-day variation in intake. That is, what individuals eat and drink changes from day to day, to different extents depending on the nutrient and food group of inter­est, as well as the context and food supply. Within-person variation in intake is not itself a form of bias since intake truly varies from day to day. However, random error must be considered in data analysis and inter­pretation because it results in an observed distribution of intake for a popu­la­tion based on data for a day, or even a few days, that is too wide relative to the distribution of usual intake (Figure 5.1).
Figure 5.1
Figure 5.1.
Accordingly, when estimates such as the proportions of a target popu­la­tion with intakes above or below some threshold, such as food group recom­mend­ations, are based on an observed distribution affected by within-person variation, they will be biased. To estimate distributions of usual intake for a popu­la­tion, repeat measures on at least a subsample and statistical modeling techniques can be used to adjust for, or remove, the within-person variation (see Chapter 3). The use of short-term data to make inferences about usual intake is discussed in detail by Kirkpatrick et al. (2022a).

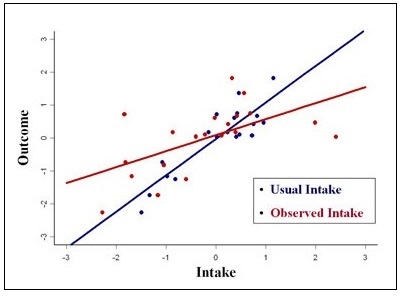
Systematic error affects data from all self-reported dietary assess­ment methods. However, system­atic error, also known as bias, is typically larger in data collected using methods like food frequency question­naires that aim to capture intake over a longer period, such as a month or year (Kipnis et al., 2003; Freedman et al., 2014, 2015; Kirkpatrick et al., 2022b). When the observed distribution of intake, including the mean, is affected by system­atic error, it is shifted left or right compared to the true distribution of intake. Therefore, estimates of mean intake and other parameters of the distribution, including proportions above or below thresholds such as food group recom­mend­ations, are biased. Systematic error generally affects the validity of a method. In epidemiologic research, measurement error distorts observed associations between diet and disease, as well as reducing statistical power to detect such associations (Figure 5.2).
Figure 5.2
Figure 5.2.
Systematic measurement error is much more difficult to mitigate than sources of random error and unlike the latter, cannot be addressed using repeat measures. Rather, it is possible to correct for system­atic error using statistical modeling only in situations in which data collected using an unbiased reference measure, such as a recovery biomarker, are available for at least a subsample, for example, from a calibration substudy. In cases in which data are available for at least a subsample from a less biased but error prone rather than an unbiased method, it may be possible to somewhat mitigate the impacts of system­atic measurement error. The implications of system­atic error for the implications of findings must be considered in all research making use of self-report dietary intake data (Freedman et al., 2011; National Cancer Institute, 2015; Subar et al., 2015).

5.2 Sources of measurement error

Reporting dietary intake is a complex cognitive process (Smith, 1993; Baranowski & Domel, 1994; Nelson et al., 1994). In addition to within-person variation and other random errors, such as random misestimation of amounts consumed caused by rounding, major sources of errors driven by the inter­action between respondents and the assess­ment method include recall, social desirability, and reactivity biases. In studies in which dietary assess­ment methods are inter­viewer-admin­istered, error may be introduced if different inter­viewers probe for information to varying degrees, intentionally omit certain questions, or record responses incorrectly. In studies using web-based or other technology-enabled methods, error may come about due to a mismatch of the inter­face with the cognitive abilities, such as literacy and numeracy abilities, of the target popu­la­tion. Another potential source of misalignment is a lack of inclusion of foods and beverages commonly consumed by the target popu­la­tion, such as in the food lists used in web-based 24h recalls and in food frequency question­naires. Errors can also be introduced during coding, including when foods and beverages are assigned codes, including in systems using auto­mated coding, and when portion sizes are converted from household measures, such as measuring cups, into grams.

5.2.1 Recall bias

Complete and accurate reporting of dietary intake using both short-term/daily consumption and long-term consumption methods can be impacted by recall errors. That is, individuals may not accurately remember what was consumed, along with the corresponding details, over either the short term (specific memory) or the long term (generic memory) (National Cancer Institute, 2015).

The 24h recall, which prompts participants to report retro­spectively what was consumed on the prior day from midnight to midnight or during the previous 24h period (Section 3.1.1), relies largely on specific memory (National Cancer Institute, 2015). Imperfect memory, or recall bias, may result in the omission of eating occasions, foods, beverages, and supple­ments. Imperfect memory may also lead the participant to report foods that were not consumed during the recalled day (error of commission or intrusions) (Guinn et al., 2008; Baxter et al., 2009b, 2015). Both omissions and intrusions have been observed in studies in which 24h recalls were compared with observed intake based on unobtrusive recording on the same day (Krantzler et al., 1982; Karvetti & Knuts, 1985; Brown et al., 1990; Kirkpatrick et al., 2014b, 2019; Baxter et al., 2015). Recall bias can also result in the omission of or inaccuracies in details, such as additions to foods and beverages (e.g., honey in tea) and amounts consumed. In general, food items that contribute significantly to the main part of a meal are better remembered than additions such as condiments and salad dressings. In early research assess­ing adults' ability to report amounts of foods consumed, Guthrie (1984) reported that for one in six respondents, salad dressings were forgotten. A more recent study to assess the validity of the web-based Auto­mated Self-Administered 24-Hour Dietary Assess­ment Tool (ASA24) similarly found that omissions were mainly additions to or ingredients in multicomponent foods, such as vege­tables and condiments in salads and sandwiches (Kirkpatrick et al., 2014b). In that study, fruits and vege­tables were omitted to a greater extent than sweets, snacks, and desserts, potentially because fruits and vege­tables were mainly offered as part of other dishes. Table 5.1 shows the most common items that were truly consumed based on observation but were not reported on recalls completed using ASA24 and admin­istered by inter­viewers using AMPM.
Table 5.1 Counts of most common exclusions, by recall mode (ASA24 and AMPM), in relation to true (observed) intakes.
ItemsASA24AMPM
Tomatoes4226
Mustard1717
Green and/or red pepper1619
Cucumber1514
Cheddar cheese1418
Lettuce1217
Mayonnaise912

Chapter 7 further discusses the results of studies assess­ing the accuracy of 24h recall data. In food records, respondents may likewise omit some foods and beverages consumed, including from images taken when using mobile device-based records.

To facilitate more accurate recall of food consumption, auto­mated multiple-pass 24h recalls are used in many national surveys and studies. Multiple-pass inter­viewing techniques (Section 3.1.1) include "probing" questions, standardized "prompts," and/or memory aids such as food models. The multiple-pass approach is intended to minimize the omission of possible forgotten foods and standardize the level of detail for describing common foods, as well as the methods used to elicit specific details for certain food items. In the EPIC study, a computer-assisted 24h diet recall method using the software program EPIC-SOFT was developed to standardize the cognitive memory aids used in the first stage (called the quick list) of the multiple-pass recall (Slimani et al., 1999; Crispim et al., 2014). EPIC-SOFT, now known as GloboDiet, was further developed to support its use in pan-European and other inter­national surveys (Slimani et al., 2011; Crispim et al., 2014), and hasbeen adapted for use in other contexts (Aglago et al., 2017; Bel-Serrat et al., 2017; Steluti et al., 2020). Auto­mated multiple-pass methods may be implemented on smartphones and tablets to improve feasibility, including in low-income settings with limited electricity and connectivity (Caswell et al., 2015; Harris-Fry et al., 2018; Htet et al., 2019; Rogers et al., 2022).

The inter­viewer-admin­istered Auto­mated Multiple-Pass Method (AMPM) was developed by the USDA (Blanton et al., 2006; Moshfegh et al., 2008; Steinfeldt et al., 2013a; Rhodes et al., 2013). (Section 3.1.1) and is used in the US NHANES, with adapted versions used in the Canadian Community Health Survey (Health Canada, 2006, 2017) and the Australian Health Survey (Australian Bureau of Statistics, 2015). The AMPM was adapted for self-admin­istration within the Auto­mated Self-admin­istered 24h Dietary Assess­ment Tool (ASA24) (Subar et al., 2012), with the similar goal of facilitating more complete reporting and reducing omissions, for example, through a forgotten foods list and repeated prompts to report everything consumed on the prior day or during the previous 24h period. To facilitate self-admin­istration, ASA24 starts by asking respondents to report eating occasions (i.e., meals and snacks) and then prompts for the foods and beverages consumed at each one. Other countries have begun to integrate web-based recall systems into their national surveys; for instance, starting in 2019, dietary intake data for the United Kingdom's National Diet and Nutrition Survey have been collected using Intake24 (Simpson et al., 2017; Office for Health Improvement & Disparities 2023). Minimizing the period between food intake and its recall, or the retention interval for recall methods (Baxter et al., 2004), may reduce respondent memory lapses (Smith et al., 1991). Research related to the retention interval has focused on children and has demonstrated better accuracy with a shorter retention interval (Baxter et al., 2004, 2009a, 2009b). Auto­mated systems such as ASA24 and the Nutrition Data System for Research (NDSR), a computerized multiple-pass protocol used to collect dietary intake data in the United States, (Nutrition Coordinating Center; Schakel et al., 1988), provide options for the researcher to admin­ister recalls for the prior 24h rather than the prior day from midnight to midnight (Nutrition Coordinating Center; National Cancer Institute, 2024a).

Probing questions and standard "prompts" also reduce memory lapses. For example, early research suggested that probing increased reported dietary intakes of hospital patients assessed by 24h recalls by 25% compared to intakes obtained without probing (Campbell & Dodds, 1967). In a U.S. study of fourth-grade school children, the accuracy in reporting foods eaten for school lunch 90min earlier increased to 100% after responding to prompts for additional items (Domel, 1997). Baxter et al., (2015) have examined the impact of different types of prompts, including open prompts that ask respondents to report intake freely (used by AMPM), meal-name prompts (used by ASA24), forward prompts (respondents are instructed to report consumption from the beginning to the end of the reporting period; used by NDSR), and reverse prompts (respondents are instructed to report the most recent consumption first) on the accuracy of reported intake among fourth-grade children. The authors found that the prompting method inter­acted with the retention interval; when the retention interval was short (with the analysis focused on a recent period within the prior 24h), there was no apparent difference in accuracy in relation to the type of prompting. When the retention interval was longer (with the analysis focused on the morning of the prior day), reverse prompting was associated with higher accuracy (Baxter et al., 2015). Depending on the target popu­la­tion, combin­ations of retention interval and prompting may be used to facilitate recall; however, manipulations to prompting may not be possible using auto­mated systems and may impact comparability with other studies.

In addition to lessening the retention interval and improving prompting, shorter reporting periods have been considered to improve accuracy of recall. Lucassen et al. (2023) observed slightly more accurate estimates of protein and potassium intake based on smartphone-based 2h versus 24h recalls when compared with urinary biomarkers (Lucassen et al., 2023). Additionally, most participants in the study preferred the 2h recall compared to 24h recalls admin­istered using either a web-based interface or via inter­viewers. It is possible that multiple 2h recalls spread across days and times of day could be used to estimate intake somewhat more accurately than repeated 24hrs while reducing participant burden.

Portion-size measurement aids (PSMAs) can also help facilitate accurate recall. Aids may be photographic or non-photographic (Section 3.2.2) and range from 1‑dimensional to 3‑dimensional (Amoutzopoulos et al., 2020). Aids available as a range of graduated portions may reduce portion size measurement error. In such cases, a series of graduated food models or photographs of a range of portion sizes can be used. Systems such as ASA24 and NDSR also integrate recipe features with the aim of capturing dietary intake more accurately (Nutrition Coordinating Center (NCC) n.d.; National Cancer Institute 2024a).

Data from 24h recalls can be used to examine contextual details, such as with whom meals were eaten, when, and where. These details may be impacted by imperfect recall. Most validation research focuses on the accuracy of quantitative estimates of intake (Chapter 7) versus these contextual details. Given increasing attention to meal patterning (Leech et al., 2015a), as well as ongoing interest in the influence of food environments on dietary intake (Kirkpatrick et al., 2014a), additional attention to the accuracy with which these details are reported may be warranted.

Intake reported using methods like the food frequency question­naire that prompt participants to retro­spectively report intake over a longer period, such as a year, are also reliant on memory. Probes are also useful for this method, which relies mainly on generic versus specific memory. Nonetheless, the cognitive demands associated with remembering what was consumed can be exacerbated by the requirement to average consumption of a given food over a long period. Frequency question­naires may also require respondents to consider multiple similar foods captured by one line item on the question­naire that may be consumed with varying frequencies. Estimating average consumption over time may be especially difficult for foods that vary in availability according to season. Some food frequency question­naires therefore include questions related to seasonal food consumption (Section 3.1.4) to reduce recall bias.

Food records (Section 3.1.2) completed in real time-that is, at the time of consumption-may be subject to some recall bias if details, such as the level of fat or type of sweeteners in a food in a packed lunch, are not accurately remembered. If records are completed at the end of the record keeping period rather than in real time, they become like 24h recalls in terms of relying on retro­spective reporting and can be affected more substantially by recall bias.

Recall bias is not consistent across individuals and may be more pronounced among children who have not yet fully developed their cognitive abilities, including memory, and individuals who have cognitive limitations. For this reason, it is important to carefully tailor the assess­ment method used with the target popu­la­tion; for instance, young children are unlikely to be able to accurately complete a 24h recall on their own and proxy- or proxy-assisted reporting may be needed.

5.2.2 Social desirability bias

Reported intake may be affected by social desirability biases, the tendency to give responses perceived as socially desirable, and social approval biases, the tendency to seek praise (Miller et al., 2008). For example, prompting during 24h recalls and food lists within food frequency question­naires that focus on foods perceived as desirable or undesirable may elicit this source of bias. Social desirability bias may be intentional or a form of self-deception (Roth et al., 1986).

Worsley et al. (1984) suggested that reported intakes of certain foods such as fresh fruits and vege­tables and sweet foods are particularly susceptible to social approval needs and hence are a potential source of system­atic bias through over- or under-reporting. With increasing attention to limiting consumption of certain foods such as sources of free and added sugars (WHO, 2015) and highly processed foods (Ministry of Health of Brazil, 2015), these items may be prone to increasing social desirability bias over time, with implications for monitoring trends in intake and evaluating the impact of dietary guidance and other policy initiatives. Relatedly, social desirability bias may be higher among persons living in larger bodies given the stigmatization of overweight and obesity in many societies (Brewis et al., 2011; Puhl et al., 2018). If the study popu­la­tion is stratified by weight status based on body mass index, differences in reporting may mask differences in intake (Beaton et al., 1997; Lissner et al., 2007). Although prior work has suggested greater social desirability and social approval biases in women (Hebert et al., 1995, 2008), it is possible this is shifting given changes in social norms and increasing attention to body weight, thinness, and muscularity across individuals with different gender identities (Puhl et al., 2018; Himmelstein et al., 2018; Nagata et al., 2021).

Hebert et al. (2008) used a 10-item version of the Marlowe-Crowne Social Desirability Scale (Table 5.2) and found that the largest social desirability biases related to reporting fruit and vege­table intake using a short frequency-based screener were among male and female participants with low educational attainment.
Table 5.2 Short, homogeneous versions of the Marlow-Crowne Social Desirability Scale. Strahan & Gerbasi, 1972
T or F Statement
2. (T)I never hesitate to go out of my way to help someone in trouble.
4. (T)I have never intensely disliked anyone.
20.(T)When I don’t know something I don’t at all mind admitting it.
21.(T)I am always courteous, even to people who are disagreeable.
24.(T)I would never think of letting someone else be punished
for my wrong doings.
6. (F)I sometimes feel resentful when I don’t get my way.
12.(F)There have been times when I felt like rebelling against
people in authority even though I knew they were right.
14.(F)I can remember "playing sick" to get out of something.
28.(F)There have been times when I was quite jealous of the
good fortune of others.
30.(F)I am sometimes irritated by people who ask favors of me.
The researchers also found that the bias was not consistent over time, with women randomized to an inter­vention reporting intake with higher bias at follow-up versus baseline, whereas bias among men was higher at baseline. Miller et al. (2008) also found substantial social approval bias affecting data collected from women using a short frequency question­naire and a limited 24h recall focused on fruit and vege­table intake. Participants were exposed to messaging about the benefits of and guidelines for consumption of fruits and vege­tables.

Similarly, analyses of baseline data collected from women enrolled in the Special Supple­mental Nutrition Program for Women, Infants, and Children (WIC) and participating in a nutrition education inter­vention related to fruits and vege­tables found that higher social desirability trait, measured using a short version of the Marlowe-Crowne Social Desirability Scale, was associated with higher reported frequency of consumption of fruits and vege­tables but only among women who were not breast­feeding (Di Noia et al., 2016). These studies used short tools focused on foods that may be particularly affected by social desirability bias (i.e., knowledge about the benefits of and recom­mend­ations for fruit and vege­table consumption are widespread). Additional studies considering other types of foods and beverages would be beneficial for expanding knowledge in this area.

Data affected by social desirability bias can be particularly problematic for monitoring the effectiveness of inter­ventions, especially those focused on changing individual behaviors, such as through counselling or educational programs (Buzzard & Sievert, 1994; National Cancer Institute, 2015). Some research has demonstrated changes in dietary reporting on 24h recalls and food frequency question­naires due to exposure to an inter­vention (Kristal et al., 1998; Caan et al., 2004; Natarajan et al., 2010). When an inter­vention group is compared to a control group, this differential reporting-that is, reporting error that is different in the inter­vention group compared to the control group-may mask the effects of the inter­vention.

Collaborating with cognitive psychologists to expand under­standing of the implications of social desirability and social approval biases, along with other psychosocial factors, may inform strategies to modify methods and/or analytic methods to reduce the impacts of these sources of measurement errors. The use of a social desirability scale in dietary surveys to identify and perhaps control for social desirability variables has been suggested (Worsley et al., 1984; Hebert, 2016), but is not yet a widespread practice. The incorporation of measures of social desirability in validation studies that collect unbiased reference data (Di Noia et al., 2016; Hebert, 2016) could expand our under­standing of the magnitude of this source of bias and the popu­la­tions and dietary components for which it is most problematic.

Given the potential impact of social desirability bias on capacity to evaluate inter­ventions, data aside from or in addition to self-reported intake are recommended. Depending on the inter­vention, such data may come from direct observation, biomarkers, or food purchasing records, though to date, there has been relatively little attention to analytic methods to combine such sources of data to evaluate an inter­vention (Miller et al., 2008; Keogh et al., 2016; Kirkpatrick et al., 2018)

5.2.3 Reactivity bias

In contrast to methods that query intake retro­spectively, those that involve real-time recording, such as food records, can elicit reactivity. Reactivity is defined as a change in behavior due to awareness that behavior is being or will be measured (Section 3.1.2). The respondent may modify their food consumption during the reporting period, potentially in a more socially desirable manner and/or to simplify the recording task (National Cancer Institute, 2015; Burrows et al., 2019).

To minimize reactivity, 24h recalls are generally intended to be unannounced such that the respondent does not know they will be asked to complete the recall on a given day. In some web-based recall systems, a scheduling option allows for researchers to invite respondents to complete their recalls on given days and to prevent recalls from being completed on other days. In situations in which the respondent knows that a recall is upcoming or can choose the day on which to complete a recall, reactivity bias may be a nontrivial contributor to the overall system­atic error.

For food records, reactivity may be a desired outcome of self-monitoring as part of an inter­vention aimed at changing eating practices and/or body weight (Streit et al., 1991; Tinker et al., 2001). However, when inter­ventions such as counselling are being evaluated for their ability to change intake, food records are not recommended for evaluating the inter­vention (National Cancer Institute, 2015), as discussed in Section 5.2.2, because of challenges in differentiating changes in reported intake due to the inter­vention from changes in reported intake due to reactivity.

In studies with repeated admin­istrations of dietary assess­ment methods, it is possible that reactivity may decline over time as the novelty of monitoring wears off. However, it is challenging to distinguish changes in this source of bias from other biases and factors, such as practice effects, that may be dynamic across repeat admin­istrations.

5.2.4 Interviewer biases

Errors in reported dietary intake can also come about due to inter­viewer biases (Wynder, 1994; Davis et al., 2010). These biases are most pertinent to 24h recalls, which continue to be inter­viewer admin­istered in many studies and national surveys (De Keyzer et al., 2015), though this is changing, as noted in Section 5.2.1. Interviewer biases can be random across days and respondents, and/or system­atic for a specific inter­viewer, or they may exist as an inter­action between certain inter­viewers and certain respondents (Anderson 1986).

Interviewer biases may include errors caused by incorrect use of probing questions, incorrect recording of responses, intentional omissions, biases associated with the inter­view setting, and distractions (Fowler and Mangione 1990). The degree of rapport between the inter­viewer and the respondent can also play a role, for example, lending to the extent to which a respondent exhibits social desirability bias. Relatedly, mode of admin­istration is relevant, with auditory and visual cues in face-to-face inter­views potentially leading to larger inter­view bias compared to telephone inter­views (Davis et al., 2010). Interviewer identities, including racial/ethnic and gender identity, can also play a role, as can the use of inter­viewers with limited characteristics (e.g., only women) (Davis et al., 2010). A large and diverse inter­viewing staff, along with thorough training and monitoring, are recommended (Davis et al., 2010).

A carefully designed and standardized inter­viewing protocol, preferably computer admin­istered, may help minimize the effect of inter­viewer biases (Slimani et al., 2000; Vossenaar et al., 2020). When several inter­viewers are employed, the assignment of inter­viewers-respondents-days should be randomized, and the inter­viewers should be trained to anticipate and recognize potential sources of distortion and bias (Wakefield 1966). In situations in which inter­viewers are conducting dietary assess­ment using online inter­faces, including those designed for self-admin­istration by respondents, thorough and consistent training is recommended to ensure consistency with the protocol and across inter­viewers. In a study by Baxter et al. (2015), researchers who did not conduct inter­views reviewed the inter­view audio recordings and transcripts to assess adherence to the protocol.

For dietary surveys involving diverse groups, it is advisable to use inter­viewers familiar with each language and culture. However, care must be taken to ensure that individual inter­viewers are not assigned only to specific subgroups of the target popu­la­tion, as inter­viewer and group effects can become confounded. Special attention must be given to the way the questions are asked, and how people think about and describe foods and amounts consumed in each ethnic or cultural group (Hankin & Wilkens, 1994). This will necessitate training in focused ethnographic methods (Buzzard & Sievert, 1994). The Intake Center for Dietary Assess­ment, in guidance for conducting large-scale 24h recalls in low- and middle-income countries, recommends a minimum of three weeks of training to practice dietary data collection, in addition to a formal survey pilot and final field testing (Deitchler et al., 2020). Surveys should be piloted in each language (Deitchler et al., 2020).

Comparing nutrient intakes calculated from multiple inter­views carried out independently on the same participants during the same 24h eating period, using different trained inter­viewers, may reveal inter­viewer effects. Despite rigorous efforts to standardize a computer-assisted 24h recall method used in the European prospective investigation into cancer and nutrition (EPIC), an inter­viewer effect was observed in certain countries among the 90 inter­viewers involved in the collection of approximately 37,000 24h recalls (Slimani et al., 2000), although not across centers from the same country. In this study, the inter­viewer effect was based on mean energy intake per inter­viewer, considering the confounding effects of age, body mass index, energy requirements, weekday, season, special diet, and physical activity. Assess­ment of potential inter­viewer bias in studies making use of multiple inter­viewers can allow for statistical methods to be applied to correct for this source of dietary measurement error (Slimani et al., 2000), such as by using models that account for clustering of respondents by inter­viewers (Davis et al., 2010).

5.2.5 Coding errors

Processing food consumption data to enable estimation of intake of energy, nutrients, and other dietary components involves coding each item reported using a food compo­sition data­base (Chapter 4) and depending on the nature of the data, the quantity (portion size) or frequency of intake (Guan et al., 2017). Coding may be an overlooked potential source of error.

Accurate coding can be facilitated by collecting detailed information about foods and beverages consumed, for example, using multiple-pass methods (Sections 3.1.1 and 5.2.1). Beaton et al. (1979) reported that coding error arising exclusively from inadequate descriptions of foods rather than weight error resulted in coefficients of variation ranging from 3% for protein and 8% for total fat to 17% for the ratio of polyunsaturated to saturated fatty acids. Coding is also challenging if the reported foods or beverages are not available in the data­base, especially for open-ended data collected using a method such as a diet history question­naire (Guan et al., 2017), requiring judgement on the part of the coder. Discrepancies among coders are a source of error (Guan et al., 2017), and such discrepancies over time and across settings can confound potential changes or between-context differences in dietary intakes (Buzzard & Sievert, 1994; Slimani et al., 2000). Additionally, data­bases often provide codes for composite or generic foods that represent many potential variations, posing challenges for accurately coding. However, the availability of brand-specific food compo­sition data­bases is increasing (Carter et al., 2016; Poti et al., 2017; Westenbrink et al., 2021).

Errors in coding can be reduced if "coding rules" are established to deal with incomplete or ambiguous descriptors of the foods (Anderson 1986). and data­bases with a comprehensive range of food items are used to enable coders to select the appropriate food item more readily. Maintaining data­bases that reflect the current food supply is an ongoing challenge (Faber et al., 2013). To promote adequate and reliable information on food compo­sition, the International Network of Food Data Systems (INFOODS) has developed guidelines addressing key aspects of data­bases, including food and component nomenclature, data checks, and sampling, as well as providing a food compo­sition data­base management system (Section 4.5) (Food and Agriculture Organization of the United Nations, 2022). International cooperation can address challenges that may pose a barrier to between-country comparisons, as well as facilitating the synthesis of findings from different studies to inform policies and programs. The Intake Center for Dietary Assess­ment also provides guidance on compiling food compo­sition data­bases for large-scale 24h recall surveys conducted in low- and middle-income countries (Vossenaar et al., 2020).

Duplicate coding of recalls or records by independent coders has been used as a quality control procedure. Guan et al. (Guan et al., 2017) outlined a system­atic method to examine discrepancies in coding, applying manual verification of codes applied to a 1% random sample of diet histories to develop a classification system outlining the types of discrepancies encountered. Discrepancy types included minor derivations not affecting food and nutrient intake estimation, incorrect codes affecting food and nutrient intake estimation, missing codes, and codes applied without corresponding foods and beverages reported in the diet histories. The classification system was then applied to a random sample of diet histories, revealing that discrepancies were most common for vege­tables, followed by meats, sauces and condiments, and cereals. In one case, four slices of cheese were recorded in the diet history but coded as four cups. There were also errors in coding the frequency of consumption over the period queried by the diet history. The authors note the need to tailor the data entry and quality control procedures to the nature of the data being collected (Guan et al., 2017).

Errors in coding foods have been reduced by auto­mating and integrating the data collection and coding processes and by allowing food codes to be generated auto­matically by the coder selecting the food item from a computer-based pull-down menu. Both these strategies were used for identifying and describing foods in the EPIC-SOFT program used for the EPIC study, in an effort to minimize subjective inter­pretations and coding error. First, a predefined country-specific list of foods, recipes, and dietary supple­ments was compiled (Crispim et al., 2014). These lists also included "nonspecified" generic foods which were used when respondents were not able to describe the foods adequately. Use of these generic foods minimized arbitrary decisions by the inter­viewers. Second, the level of detail for describing each of the foods and mixed dishes was standardized across countries (Slimani et al., 2000; Crispim et al., 2014).

A combin­ation of auto­mated and manual food coding is used by the U.S. Department of Agriculture to code intake data collected in NHANES (Anderson & Steinfeldt, 2004; Steinfeldt et al., 2013b; Moshfegh et al., 2022). The food and portion options included in the food compo­sition data­base, the Food and Nutrient Database for Dietary Surveys, are based on prompts within the AMPM, the multiple-pass method used to carry out the 24h recalls. Within AMPM, auto­mated coding is completed based on a matching process between the responses in AMPM and an auto­code pathways data­base (Anderson & Steinfeldt, 2004). Table 5.3 shows three examples of auto­code pathways for coffee.
Table 5.3 Examples of food paths and food code links for the coffee food category.
Food
category
Sequ-
ence #
Question
variable
Response
value
Foodcode
link
2001011
2
3
CoffeeKind
CoffeeCaffeine
CoffeeForm
Coffee
Regular
Brewed
92101000 Coffee made
from ground, regular
2001021
2
3
CoffeeKind
CoffeeCaffeine
CoffeeForm
Coffee
Regular
Instant
92103000 Coffee made
from powdered
instant, regular
2001031
2
3
CoffeeKind
CoffeeCaffeine
CoffeeForm
Coffee
Regular
Drink
92100500 Coffee,
regular, NS as to
ground or instant

Auto­coding was introduced for the NHANES 2004, with auto­matic coding of about 45% of foods and amounts reported. For the 2017-2018 survey, the rate of auto­matic coding was about 60% (Moshfegh et al., 2022). Foods and amounts that are not exact matches to auto­code pathways are manually matched to a food code by trained staff using SurveyNet, with auto­mated lookup procedures to ease the process. Manual coding requires about one hour per dietary recall (Moshfegh et al., 2022). ASA24, which is based on an adaptation of the AMPM, incorporates fully auto­matic coding (Zimmerman et al., 2009; Subar et al., 2012), as do other web-based systems discussed in Chapter 3. Open-ended responses, entered when a respondent is not able to find the food or beverage for which they are searching or to specify details about a food reported within ASA24, are coded using "best guess" default codes based on follow-up questions to obtain general information about the item (Zimmerman et al., 2015). An examination of the implications of reviewing these codes and correcting them when necessary, found that this process may not be required for large studies, though may be worthwhile for smaller studies in which a small number of errors may be more impactful for estimated intake (Zimmerman et al., 2015).

Systems can be designed to check for outliers arising from errors in entering portions, as well as for missing information, while the respondent is still present or prior to data analysis. For example, in EPIC-SOFT, energy and macronutrient intakes from the 24h recall were calculated immediately after the inter­view. Calculated values were then checked against standard requirements based on the respondent's age, sex, weight, and height. Such a strategy limits a posteriori arbitrary decisions on outlier values or unlikely food data (Slimani et al., 2000). Systems like ASA24 provide researchers with information on the number of foods reported and total energy intake for a given recall to support data quality appraisal. In addition to potentially reviewing open-text entries, researchers using ASA24 are encouraged to review their data for outliers to identify possible data entry or conversion errors prior to analysis (National Cancer Institute, 2024b).

Consider­ations in coding eating occasions and foods consumed in combin­ation

Discrepancies in coding meals or eating occasions can also occur and can be avoided by standardizing the codes prior to the study, and by adhering to their assignment. In the EPIC-SOFT program, the 24h recall period was divided into 11 common food consumption occasions during the day from "breakfast" to "after dinner" and during the night. A checklist was also devised and was adapted to the local dietary habits of each participating country, so that the inter­viewer could ensure that no major component of the food consumption occasion was forgotten (Slimani et al., 2000; Crispim et al., 2014).

To date, approaches to consider eating occasions are varied. Leech et al. (2015a) conducted a narrative review and found that most studies defined eating occasions based on how they were identified by the participant. Using data from the 2011-2012 Australian National Nutrition and Physical Activity Survey, Leech et al. (2015b) also compared the frequency of and energy intake from eating occasions, based on whether they were participant identified, based on time of day, or based on time intervals and/or energy criterion. The authors found that the different definitions affect how eating patterns are characterized and suggested that consensus on a standard definition of eating occasions is needed (Leech et al., 2015b),

In some cases, it may be beneficial to consider how foods are consumed in combin­ation, as presenting the foods as single items only risks losing valuable information (Faber et al., 2013). Using data from the Irish National Adult Nutrition Survey, Woolhead et al. (2015) proposed a coding approach to identify common food group combin­ations at each eating occasion to create generic meals, such as cereal, milk, bread, and juice at breakfast. Mean nutrient compo­sitions were calculated for each generic meal and used to conduct meal pattern analysis, with the authors noting that this approach enabled consider­ation of meal-based trends that were not apparent from the overall food intake data (Woolhead et al., 2015). In contrast, in assess­ing how individuals typically consume foods, Mason et al., (2015) applied individual food codes to each individual item, as per AMPM, and then recoded items consumed together, such as coffee with milk or the multiple ingredients in a sandwich, using combin­ation codes. In both cases, codes were aggregated into food groups based on the main food component. The difference in coding led to variation in the frequency of consumption of food groups and their rank order, with differences by racial identity also varying depending on the coding approach. Considering combin­ation versus individual codes also resulted in differences in how snacks were characterized (Kuczmarski et al., 2015). The authors suggest that considering foods as they are consumed, including in combin­ation, is important in research aiming to characterize dietary patterns (Mason et al., 2015) and that focusing on how foods are consumed in practice may inform more specific recom­mend­ations and targeted programs to improve intake (Kuczmarski et al., 2015).

Consider­ations in the handling of mixed dishes

Errors may also come about in coding mixed dishes. First, error may occur during when mixed dishes are broken into raw ingredients and converted to an "as consumed" form. The conversion usually involves applying adjust­ment factors for changes in weight due to cooking and for nutrient retention. These adjust­ment factors are generally derived from the literature and are discussed in Chapter 4. After applying the appropriate adjust­ments, the "as consumed" form is used, along with the estimate of the quantity of the mixed dish consumed by the respondent.

The assignment of the mixed dish to an appropriate food group may also result in errors. To assess alignment of dietary intake with food group recom­mend­ations, mixed dishes should be broken down, or disaggregated, into simple ingredients (i.e., single foods), which can then be classified. Within this approach, it is necessary to define system­atically which items should be classified as prepared foods per se (i.e., bread, biscuits, soup, drinks) and not broken down into ingredients (Slimani et al., 2000). Assigning mixed dishes to food groups based on the primary ingredient may yield incorrect estimates for the contribution of major food groups to energy and nutrient intakes. For example, the fat and oil group may more than double its energy contribution from 5% to 12% when mixed dishes are incorrectly assigned in this way (Krebs-Smith et al., 2000). Faber et al. (2013) provide a discussion of consider­ations related to grouping foods.

5.3 Implications of measurement error for estimated dietary intakes

5.3.1 Misestimation of energy intakes

Misestimation of energy intake has been a focus of the dietary assess­ment literature. In addition to the emphasis on weight and weight change within the field more broadly, this focus is likely because error in estimation of energy is relatively large relative to error in other dietary components (Freedman et al., 2014). Almost all foods and beverages contain energy. Therefore, even small errors in the quantification of each food and beverage compound to impact overall estimates of energy intake (Subar et al., 2015). It has been recommended that researchers not rely upon self-reported food consumption data to estimate energy intake (National Cancer Institute, 2015; Subar et al., 2015). Nonetheless, daily energy intake is often considered as a proxy for the overall quality of data from a self-reported dietary assess­ment method, and even when interest is in other dietary components, controlling for estimated energy intake may be useful depending on the research question (Subar et al., 2015).

Individuals do not typically report energy intake; rather, they report foods and beverages consumed and the corresponding energy intake is estimated-or misestimated-using food compo­sition data­bases (Chapter 4). However, the terminology energy under­reporting has often been used in the literature. The existence of total under­reporting of energy intake has been documented using several different techniques (Chapter 7), including in national surveys in several countries (Beaton et al., 1997; Briefel et al., 1997; Price et al., 1997; Heerstrass et al., 1998; Zhang et al., 2000; Johansson et al., 2001; Rennie et al., 2005, 2007; Rangan et al., 2011; Murakami & Livingstone, 2015, 2016; Murakami et al., 2016, 2018; Garriguet, 2018). Underestimation of usual energy intakes may come about both due to under­recording and under­eating. Underrecording is a failure to record all the items consumed during the study period or under­estimating their amounts. It is a discrepancy between reported energy intake and measured energy expenditure without any change in body mass. Undereating occurs when respondents eat less than usual or less than required to maintain body weight and is accompanied by a decline in body mass (Goris & Westerterp, 1999). Although generally not as prevalent as under­estimation, overestimation of energy intake also occurs. The different impacts of inaccurate reporting should both be considered in inter­preting study findings, but there is often more attention to under­estimation.

Burrows et al. (2019) conducted a review of research examining dietary assess­ment methods relative to doubly labeled water, which can be used to estimate energy intake over a 14-day period if individuals are in energy balance (Chapter 7). Based on 59 studies with adults, the authors found more frequent misestimation among females than males. The degree of under­reporting was variable across studies, with less variation and degree of under­estimation of energy intake in studies using 24h recalls (Burrows et al., 2019). Studies also suggest that misreporting is associated with weight status, socioeconomic status, and sex (Chapter 7).

Efforts to overcome the problem of energy misestimation have led some investigators to exclude presumed under­reporters from the data set, using techniques discussed in Chapter 7. Such an approach introduces a source of unknown bias into the data set and is not recommended. Further, energy is only one dietary component and other dietary components of interest, including nutrient densities, are not subject to the same level of error (Freedman et al., 2014; 2015). Therefore, corrections for low energy intake are not sufficient to eliminate the biases arising from selective misreporting of certain food types (e.g., foods of low social desirability). Others advocate the inclusion of data from all respondents, but the use of statistical methods that control for energy intake. Several approaches to energy adjust­ment exist (Kipnis et al., 1993, 1997; Kohlmeier & Bellach et al., 1995; Mackerras, 1996; Willett et al., 1997; Hu et al., 1999; Tomova et al., 2022). The selection of an appropriate model for energy adjust­ment depends on the research question; readers are advised to consult a statistician on this issue.

Prior studies have suggested that certain foods, such as cakes and pies and savoury snacks, may be under­estimated to a greater extent than others (Poppitt et al., 1998; Krebs-Smith et al., 2000). In a system­atic review of 29 studies, Whitton et al. (2002) concluded that there was more variation in error within food groups and within studies than between food groups. Most studies examined used 24h recalls and controlled feeding designs. Beverages appeared to be omitted less frequently than other items, but estimation of their portion sizes was less accurate. Foods like desserts and snacks did not appear to be omitted more frequently than foods like fruits and vege­tables. Rather, errors in estimation appeared to be related to their form, e.g., meat in slices or as single units and vege­tables and condiments as part of mixed dishes, as discussed in Section 5.2.1. The authors suggested that omissions tend to be items that are less visible to participants rather than those that they perceive as less healthy (Whitton et al., 2002).

5.3.2 Portion size misestimation

The errors associated with quantifying the portion of food consumed are probably the largest measurement error in most dietary assess­ment methods. They can arise from the respondent's inability to quantify accurately the amount of food consumed, or from misconceptions of an "average" portion size.

SHARON MAY UPDATE HERE IN RELATION TO Chapter 7 Respondents differ in their ability to accurately estimate portion sizes visually. In general, such discrepancies appear to be independent of age, body weight, social status, and gender of the respondent, but they do vary with the type and size of food (Young & Nestle, 1995). Large errors may occur, for example, for estimates of foods high in volume but low in weight (Gittelsohn et al., 1994) and for intact cuts of meat of irregular shape (Godwin et al., 2001). Furthermore, respondents appear to have greater difficulty estimating the size of large portions than they do small portions, irrespective of their body weight (Young & Nestle, 1995).

Due to the considerable challenge that portion size estimation presents for accurately estimating dietary intake, it continues to be an area of innovation within the field. Several types of portion-size measurement aids (PSMAs) have been developed in an effort to enhance the accuracy of portion size estimates when weighing methods cannot be used. Amoutzopoulos et al. conducted a system­atic review of PSMAs (2020), identifying over 500 aids used in over 300nbsp;studies. The authors found that the measurement aids most often used were 2‑ and 3‑dimensional aids, mainly household utensils and photographic atlases, whereas 1‑dimensional aids, such as portion lists and food guides, were used less often. Most of the aids assessed were developed and/or used in high-income countries, mainly the U.S. and United Kingdom (Amoutzopoulos et al., 2020). However, food images, including food atlases, can be useful for low- and middle-income settings with tailoring of the images to foods consumed in the region. For example, adaptation of GloboDiet for use in different regions requires consider­ation of the suitability of the photos, as well as the household measures and standard units, used in the region (Aglago et al., 2017). In low-income countries, real foods, food models, or salted replicas of actual staple foods may be useful (Ferguson et al., 1995; Gibson & Ferguson, 2008; Aglago et al., 2017). In all cases, measurement aids that depict a range of portion sizes should be used to avoid the tendency to "direct" responses.

Photographs and digital images are being increasingly used to assist respondents in estimating portion sizes; several approaches have been used and are discussed in Section 3.2.2. Photographs that depict a range of portion sizes are often used to aid in the estimation of portion size in 24h recalls and food frequency question­naires. Photographs and images for quantifying portion sizes should be standardized with respect to several factors. Graduated food models and household measures have been used in several national food consumption surveys. USDA uses three-dimensional measuring guides for the first recall, completed in person, and the USDA Food Model Booklet (Ingwersen et al., 2007; Centers for Disease Control, 2015), which contains two-dimensional drawings that are consistent with the measuring guides, for the second recall (Moshfegh et al., 2022). Cleveland and Ingwersen (2001) compared the portion-size reporting accuracy of two-dimensional (2D) food models and a range of 3D measurement aids used in the dietary component of NHANES. The 2D food models include 32 life-size drawings of household vessels (glasses, mugs, bowls), abstract shapes (mounds and spreads), and geometric models (circles, a grid, wedges, and thickness bars). The 3D measurement aids are actual measuring cups, spoons, and a ruler. Overall, both the 2D and the 3D guides helped generate relatively good estimates of food amounts, although in this study, more accurate estimates were obtained on average with the 2D than the 3D guides, especially for mounded foods.

SHARON MAY UPDATE HERE IN RELATION TO Chapter 7 Some studies have investigated whether it is helpful to train respondents to use portion-size measurement aids such as graduated food models or household measures. In general, the use of short group training sessions for respondents using food models or household measures should be encouraged. Training sessions enhance the ability of both children and adults to estimate food portion sizes accurately, although for children, more than one training session is probably necessary (Bolland et al., 1990; Weber et al., 1999). Training using a combin­ation of food models and life-sized food photographs may be best (Howat et al., 1994).

Quantifying standard reference portion sizes

Semiquantitative food frequency question­naires, used to rank individuals according to food or nutrient intake, often specify a standard reference portion size for each specific food. Typically, this is intended to represent the median amount consumed during a single meal. The values may be generated from country-specific national nutrition surveys (Block et al., 1986) or other large surveys (Willett et al., 1985). Respondents appear to have difficulty relating what they consumed to such predefined standard reference portion sizes, (Friedenreich et al., 1992), and inconsistent results and large error have been reported (Willett, 1994). ().

Many factors affect actual food portion sizes, including age, gender, activity level, the appetite of the individual, household utensils used, and where and when the food is obtained and eaten.

Guthrie (1984) compared the amount of food selected as a usual portion size by young adults, in relation to the U.S. standard reference portion sizes at that time. The latter were based on median portions derived from USDA Nationwide Food Consumption Survey data (Pao et al., 1982). (). Items such as butter on toast, sugar on cereal, milk as a beverage, and tossed salad corresponded closely with standards, whereas others such as dry cereals, orange juice, and fruit salad did not. Men tended to select larger portions than women.

In view of these findings, the use of standard reference portion sizes in food frequency question­naires is still hotly debated. Some investigators have argued that because variations in food intake are mainly determined by frequency of consumption, obtaining information on portion sizes in semiquantitative food frequency question­naires is not always justified (Samet et al., 1984; Noethlings et al., 2003). Others recommend the use of small, medium, and large portions, based on age and gender-specific median portion sizes as standards (Cummings et al., 1987). Japanese investigators have cautioned that the relative contributions of within- and between-person variations in portion size vary among food items, so that whether separate questions on portion size should be included will depend on the food groups relevant to the diet-disease association being studied (Tsubono et al., 1997). ().

There is some confusion in the literature between the use of standard reference portion sizes and standard reference serving sizes. Two examples of standard reference serving sizes established for use in the Food Guide Pyramid (FGP) by USDA (USDA, 1992), (). and for food labels by the U.S. Food and Drug admin­istration (FDA, 1993), (). are shown in Table 5.3, and compared with standard reference portion sizes generated by Willett et al. (1985) and Block et al. (1986). Inconsistencies occur between the standard reference serving sizes and standard reference portion sizes.

5.3.3 Omission of information on nutrient supple­ment usage

The appropriate consider­ation of dietary supple­ment use in nutrition surveys conducted in high-income countries is critically important. In the United States, for example, more than half of adults and one-third of children use dietary supple­ments (Bailey et al., 2011b, 2019; Kantor et al., 2016; Stierman et al., 2020). In Australia, it is estimated that close to half of women and over one-third of men use dietary supple­ments (Burnett et al., 2017). Not accounting for supple­ment use may result in a system­atic under­estimate of intakes of certain nutrients, and thus an overestimate of the prevalence of nutrient inadequacy (Bailey et al., 2011a; Dwyer et al., 2022). Not considering supple­ment usage could also result in under­estimation of the prevalence of excessive intake. Inclusion of dietary supple­ment use may be particularly important in accurately assess­ing dietary intake at certain life stages, such as the prenatal and periconceptional periods (Dwyer et al., 2022). Assess­ing supple­ment usage requires unique consider­ations compared to food because supple­ments may be consumed daily or episodically, with usage varying substantially over time, and can provide high levels of nutrients that are not associated with energy intake (Bailey et al., 2019).

Supplement use has been assessed using frequency-type question­naires, inventories, short screeners, and in conjunction with assess­ments of food intake using 24h recalls and food records. Information on the validity, repro­ducibility, and measurement error structure of methods to assess supple­ment use is limited (Bailey et al., 2019). Discrepancies exist in the terminology and the methods used to measure dietary supplements and the criteria used to define dietary supple­ment users, thus limiting comparisons across studies (Brownie & Myers, 2004). For example, considerable variability has been identified in how supple­ment use is queried by widely used food frequency question­naires (Rios-Avila et al., 2017).

The U.K. National Diet and Nutrition Survey of people aged 65y or over obtained information on supple­ment usage from responses on a health and lifestyle question­naire and a 7d weighed diet record. A comparison of the total nutrient intakes and the corresponding blood biochemical indices suggested that the 7d record was not long enough to record habitual dietary supple­ment use. Instead, a structured question­naire probing for supple­ment use over a longer period was recommended. This included close-ended questions about the specific brand taken, the amount per pill, the frequency of use, and the duration of use (Bates et al., 1998, 2000). A similar conclusion was reached by Patterson et al. (1998a). These investigators also emphasized that measurement error associated with long-term supple­mental vitamin and mineral intake may be responsible for the lack of any observed association between vitamin supple­ments and the risk of cancer. Since 2007, NHANES has included the collection of dietary supple­ment information at the end of the 24h recalls, in addition to an inventory and in-home question­naire that collects information on amounts typically taken, frequency of use in the past 30 days, and motivation for taking the supple­ment (Gahche et al., 2018; Bailey et al., 2019). Usage estimates are lower based on the 24h recall versus the 30d question­naire. Nicastro et al. thus recommended using information from both (2015).

Accurate information on brand names is critical for dietary supple­ments because inter-brand variability is large. Failure to correctly quantify the dose of a supple­ment can have a greater impact on the estimation of nutrient intakes than from any source of food intake under­reporting. Additionally, the chemical form of the dietary supple­ments can affect their bioavailability, so it is preferable to record the chemical characteristics of the dietary supple­ments, whenever possible (Heimbach, 2001). This can be achieved by asking participants to have the dietary supple­ments that they take available. In this way, the inter­viewer can ensure the type and amounts recorded are correct (Patterson et al., 1998b).

Maintaining supple­ment data­bases is challenging because of the number of products on the market and their rapid turnover (Bailey et al., 2019; Dwyer et al., 2022). Dwyer et al. (2022) provide an in-depth discussion of consider­ations related to supple­ment data­bases. In the US, the Dietary supple­ment Ingredient Database (Office of Dietary supple­ments and US Department of Agriculture, 2023) has been developed to provide information on the nutrient values of dietary supple­ments. supple­ment data­bases have also been compiled in other countries (RIVM, n.d.; Food Standards Australia New Zealand, 2024). Through a joint project of the FAO, INFOODS, and the George Institute-Australia, a global dietary supple­ment database is under development (The George Institute for Global Health, 2024). The data­base will be open source and is intended to promote the consider­ation of supple­ments in estimating nutrient intake

Children

The accurate assess­ment of dietary intake in children is especially challenging. Children tend to have diets that are highly variable from day to day, and their food practices often change markedly across life stages. Research on the development and timing of specific cues that may help children report their diets more accurately, applying a cognitive-processing approach, has been conducted (Baranowski & Domel, 1994).

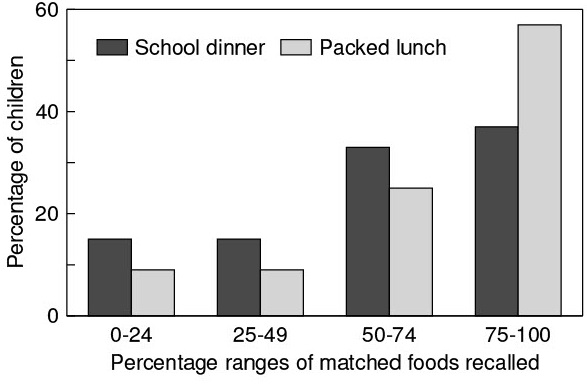
Warren et al. (2003) concluded that children aged 5-7 y were unable to provide an accurate dietary recall of their school lunch, especially when they consumed a dinner provided by the school rather than eating their own packed lunch, as shown in Figure 5.2. Nevertheless, prompts and cues enhanced recall by all children in this study. Main dishes were remembered best by the children; leftovers were not readily reported. A series of recom­mend­ations and suggestions for future studies on children have been compiled by these investigators and are shown in Box 5.2 (Warren et al., 2003). There is no doubt that more work is needed on methods to determine more accurately what children aged <8y are eating.

Baxter et al., 2015 have noted that the retention interval and level of probing, which can both be determined by the researcher depending on the recall protocol or system used, interact to influence the accuracy of reporting among children. Furthermore, the level of accuracy in relation to different combin­ations of retention intervals and types of prompting differed by gender.

5.4 Minimizing measurement error through data collection procedures

Measurement error can be minimized by incorporating quality-control procedures into each stage of the dietary assess­ment method. These procedures include standardization of inter­viewing techniques and question­naire, robust training of inter­viewers and coders, pretesting of question­naires, and admin­istration of a pilot study. Each procedure must be checked continuously to ensure compliance with standardized protocols.

The existence of measurement error continues to be a major challenge in nutrition surveillance and research and provides an ongoing impetus for innovation in dietary assess­ment. Technology-enabled methods, such as online recalls incorporating multiple passes and auto­mated coding and web-based food frequency question­naires integrating auto­mated skip patterns, are increasingly used. It remains important to consider what is known about the validity and repro­ducibility of a given method for the popu­la­tion of interest and to integrate a pilot study to ensure the method performs as intended and to identify opportunities to reduce error.

Random error, unlike system­atic error, can be minimized by increasing the number of observations. Random error may occur across all respondents and all intake days. In contrast, systematic error may be more common and/or larger among some respondents (e.g., individuals in larger bodies), in data collected by specific inter­viewers or using different methods, or for certain foods (e.g., alcohol). Systematic error may be mitigated by ensuring that the methods used, such as frequency question­naires, are appropriately tailored to the popu­la­tion group(s) of interest, as well as by calibrating data to a more accurate method admin­istered in at least a subsample.

As noted, measurement error can be accounted for or mitigated if repeat admin­istrations (random error) or reference data from another method (system­atic error) are available. It is ideal if these data are available for a random subsample of the overall sample of interest but in some cases, estimates from an external sample with similar characteristics can be used.

5.3 Summary

This chapter outlines the system­atic and random error that may occur during the collection and recording of food consumption data. In practice, different types of error compound to impact the overall accuracy of reported consumption and estimated intake of nutrients and other dietary components. For example, errors in portion size quantification may counteract or exacerbate the impact of omissions of foods and beverages consumed on nutrient intake estimates.

Quality-control procedures that minimize possible sources of measurement error include training the inter­viewing and coding staff and developing standard inter­viewing techniques and question­naires during the pilot survey. Increasingly, sources of error arising from both respondent and inter­viewer biases and respondent memory lapses can be reduced using computerized probing questions, standardized prompts, and built-in cues during auto­mated dietary inter­views, as well as technology-enabled methods. Nevertheless, misestimation of energy and selective misreporting of certain food types remain important sources of respondent biases. A variety of portion-size measurement aids are now available for use when weighing methods are not possible. These include the use of 2-D graduated food models, photographs, and images and 3-D measurement guides (e.g., household measures) to quantify portions of foods consumed. Training respondents to use these measurement guides to estimate food portion sizes will also improve accuracy. Collection of accurate data on consumer use of dietary supple­ments is also essential; information on brand, dosage, chemical form, and period over which use of the dietary supple­ment has been recorded is required.

Establishing a computerized standard coding system for both foods and eating occasions to avoid coding error is critical, especially for surveillance and cross-country comparisons. Systematic detection of wrongly coded weights of foods is more difficult, although calculation of energy and macronutrient intakes from 24h recall inter­views, while the respondent is still present, allows the correction of any gross error. Finally, care must be taken in the handling of data for mixed dishes and foods eaten in combin­ation. Despite all efforts to minimize sources of random and system­atic error that may occur during the measurement of food and nutrient intakes, some errors remain difficult to predict and to prevent and, as a result, may introduce differential bias in reported food intakes. Ongoing research is needed to investigate the specific type and nature of measurement error, especially in diverse popu­la­tions, so that these can be minimized or corrected statistically. In this way, the analysis and inter­pretation of dietary data can be improved. The existence of dietary measurement error distorts estimates of disease relative risk, and thus has major implications for epidemiological studies of dietary risk factors and disease. Observed diet-disease relationships should be inter­preted cautiously (Freedman et al., 2011), particularly if steps have not been taken to mitigate the error to the extent possible.

Assess­ing the repro­ducibility (Chapter 6) and validity (Chapter 7) of dietary methods used is essential for surveillance, including cross-country comparisons, epidemiologic, and inter­vention research (Buzzard & Sievert, 1994).