
Arimond M1,
& Deitchler M2,
Principles of Nutritional
Assessment:
Dietary
Guidelines & Assessing
Diet Quality
3rd Edition, May 2024
Abstract
This chapter covers two related but distinct topics: Food-based dietary guidelines and assessment of population-level diet quality. Definitions of diet quality, food-based dietary guidelines, and assessment measures have all evolved over time, reflecting new and emerging scientific evidence for diet-health relationships. Food-based dietary guidelines are developed by national health authorities for use by consumers, practitioners, and policymakers. Such guidelines translate current scientific knowledge about relationships between food intakes and health outcomes into clear population-level guidance. In this chapter, we provide a brief overview of the development and communication of guidelines and describe a global repository for food-based dietary guidelines. We summarize areas of consistency across guidelines and highlight some possible future directions, including incorporation of environmental sustainability concerns. In the second part of the chapter, we describe approaches to assessing diet quality, particularly at the population level. Numerous metrics (indicators, indices, and scores) have been developed to summarize diet quality, reflecting different definitions of diet quality and also different measurement objectives. Widely used metrics include measures of adherence to national food-based dietary guidelines such as the U.S. Healthy Eating Index, measures of adherence to healthy regional diets such as Mediterranean diet scores and indices, and other measures developed based on epidemiological evidence linking dietary patterns and characteristics to health outcomes. Using a series of examples, we describe how diet quality metrics are developed, evaluated, and used. Most scores and indices require detailed quantitative dietary intake and food composition data. However, several measures have been developed for use in contexts where such data are not available and simpler measures are required, and we include examples of these. Finally, as with food-based dietary guidelines, concerns with environmental impacts of diets and food systems are growing, which will likely result in new metrics incorporating this dimension. CITE AS: Arimond M, Deitchler M: Principles of Nutritional Assessment: Dietary Guidelines and Assessing Diet Quality https://nutritionalassessment.org/diet/Email: arimond.nutrition@gmail.com
Licensed under CC-BY-4.0
8c. Dietary Guidelines and Assessing Diet Quality
This chapter covers two related but distinct topics: Food-based dietary guidelines, often provided by national health authorities, and assessment of diet quality. The section on assessment of diet quality has a primary focus on applications at the population level, for monitoring diet quality, assessing diet-disease associations, and evaluating policy and programmatic interventions. The two topics in this section are linked in this population-level focus, and because assessment of diet quality is sometimes approached through assessing adherence to national food-based dietary guidelines. However, the section also covers a range of other approaches to assessing diet quality in populations. Learning objectives for readers include gaining understanding of:- The role of food-based dietary guidelines in communicating guidance from national health authorities;
- The range of topics covered by food-based dietary guidelines, and some areas of consistency and difference across various national guidelines;
- The evolution of definitions of diet quality, and how this has influenced assessment of diet quality;
- The wide diversity of diet quality indices currently in use;
- Some of the main types of indices, including those based on national food-based dietary guidelines, on regional diets, and on other summaries of evidence for diet-health relationships;
- How indices differ in their development, measurement (data sources), calculation and use;
- Which indices have lower data requirements for their calculation;
- How new concerns with sustainability and planetary health may affect diet quality definitions and assessment.
8c.1 Food-based dietary guidelines
This section provides a brief overview of the development and communication of food-based dietary guidelines (FBDGs), with a focus on those developed by national authorities. The section also describes a global archive for FBDGs and comments on areas of consistency across national guidelines. The section concludes with comments on likely future directions for FBDGs. Science-based guidance on healthy diets is available from a variety of sources, including from national governments, international authorities such as the World Health Organization (WHO) and the Food and Agriculture Organization of the United Nations (FAO), and medical and dietetic professional societies, among others. FBDGs translate current scientific knowledge about relationships between food intakes and health outcomes into clear population-level guidance. They are “food-based” in contrast to guidance on nutrient intakes such as various Nutrient Reference Values (see Section 8b.1). They often provide advice and guidance on dietary patterns — what to eat and drink, how often, and in what amount. In this Section, we focus on FBDGs developed at the national level. The earliest dietary guidance from national governments was focused on ensuring nutrient adequacy of diets (Harper, 1987). However, by the late 20th century the focus shifted to include a strong emphasis on reducing risks for non-communicable diseases (NCDs, such as cardiovascular diseases, metabolic syndrome, type 2 diabetes, and cancers), while still ensuring nutrient adequacy. More recently, there have been calls to integrate considerations of environmental sustainability into FBDGs; however, to date this has been rare (Gonzalez Fischer & Garnett, 2016; Springmann et al., 2020). Some FBDGs also integrate guidance on physical activity, food safety, food skills (such as choosing healthier foods while shopping, and preparing meals), the role of ultra-processed foods, and other topics.8c.1.1 Development of national-level food-based dietary guidelines
WHO and FAO have provided guidance to countries on how to develop FBDGs (WHO/FAO, 1998). This development process for national FBDGs was summarized by the European Food Safety Authority (European Food Safety Authority (EFSA), 2010) as including the following steps:- Identify diet-health relationships (based on national but also global evidence);
- Using national data sources, identify:
- Diet-related health problems;
- Nutrients of public health importance;
- Food groups relevant for FBDGs (for example, food groups with known links to health outcomes, and for sources of nutrients of public health importance);
- Food consumption patterns;
- Test FBDGs with audiences and refine them;
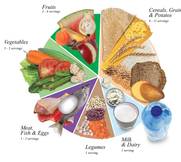
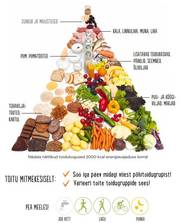
- Develop graphical representations of FBDGs.
 Malta
Malta
 Oman
Oman
 Estonia
8c.1.2 Communication and implementation of national-level food-based dietary guidelines
FBDGs aim to provide actionable guidance for consumers and for public health and medical practitioners. Full implementation of FBDGs includes not only development of a variety of targeted consumer education strategies and materials, but also integration within a range of sectoral policies and programs to help ensure that healthy diets are available, accessible, and affordable (Wijesinha-Bettoni et al., 2021). Policies and programs include those related to public procurement of foods (for example, for feeding in schools and other institutions), taxes and food subsidies, and various food security, nutrition and agricultural policies and programs. More information on implementation of FBDGs is available from FAO. Given these varied uses, governments develop a variety of documents and tools to communicate and implement the FBDGs. These may include:- Technical documents detailing the process of evidence review and justifying each guideline statement, or key message. Technical documents may include results of systematic reviews of evidence on diet-health relationships, diet modeling studies, and/or references to systematic reviews from other sources (see, for example, New Zealand's documentation of evidence);
- Sector-specific policies, regulations and guidance; for example, policies and guidance for implementation of school meals programs that incorporate the national FBDGs (see, for example, U.S. regulations for school meals programs);
- Guidance for public health and medical practitioners, which may be at an intermediate technical level, and with a practical focus to help them translate the FBDGs for consumers (see, for example, Canada's Dietary Guidelines for Health Professionals and Policy Makers );
- Short, simple consumer-facing documents such as brochures, posters, and brief graphical food guides with advice on food groups (see, for example, the food guide graphic and tri-fold brochure from Benin);
- Consumer-facing internet pages and applications that provide a variety of tools for learning and self-assessment (see, for example, Canada's Food Guide webpage).
8c.1.3 Repository of national food-based dietary guidelines
The FAO maintains a repository of national FBDGs, which currently (December, 2021) includes FBDGs for 95 countries. Each country page includes standard information provided by national authorities for most or all countries (see Box 8c.1).
Box 8c.1 Information on national food-based dietary guidelines.
In addition to the information in Box 8c.1, available
for most or all countries, newly
updated country pages may also include information on implementation,
evaluation, and incorporation of sustainability concerns.
FBDGs are currently (December, 2021)
available at the repository for 33 European
countries, 31 countries in the Americas, and 18 countries in the
Asia-Pacific region, but for only 7 African countries. Availability varies by
country income classification, with FBDGs available for slightly over
half of all high- and upper-middle-income countries, just over
one-quarter of lower-middle-income countries, and for fewer than one
in ten low-income countries (based on
World Bank 2021 country income classifications).
- Official name of the country's dietary guidelines;
- Publication year of the most recent guidelines;
- Development process and stakeholders involved;
- Intended audience and age groups covered;
- Description of the food guide graphic;
- Key messages;
- Links to a variety of downloadable materials, including food guides and technical documents, and to relevant government websites if applicable.
8c.1.4 Coverage of sub-populations
Countries have taken different approaches to providing guidance for specific age groups and physiological conditions:- Some countries have taken a life-cycle approach in a single dietary guidelines document, and include sections with specific guidance for infants, young children, school-aged children, adolescents, and for pregnant and lactating women (see, for example, Kenya's National Guidelines for Healthy Diets and Physical Activity).
- Other countries have developed separate technical documents and/or consumer-facing guidance documents for some or all age and physiological groups (see, for example, New Zealand's technical background papers and consumer resources for different age groups).
- Other countries state that the main dietary guidelines document and key messages apply to all healthy individuals ≥ 2y, but they may still highlight the needs of age groups or other sub-groups (vegetarians, pregnant or lactating women) within the main guidelines document (see, for example, Lebanon's Food-based Dietary Guidelines ).
- The most common age group with separate and specific guidance is infants and young children under two years of age (see, for example, technical and consumer-facing FBDG for Panama).
8c.1.5 Consistency of national food-based dietary guidelines
Commonalities and differences among national FBDGs graphics and key messages were described in several recent reviews (Altamirano Martínez et al., 2015; van't Erve et al., 2017; Herforth et al., 2019). All reviews summarized food guide graphics and noted that the two most commonly used graphics were versions of a pyramid or a plate / food circle. The remainder of this section is based on the review by Herforth et al. (2019). Nearly all food guide graphics conveyed the importance of food group diversity and proportionality — that is, that some food groups should be consumed in larger quantities than others. However, only about one-third gave quantitative information on recommended amounts per day or per week (either in grams or as the number of servings). Most graphics included depiction of fats and oils and of sugars / sweets, showing them as small in proportion to other groups. About one-third included depictions of other foods to be consumed in moderation, such as pizza, hamburgers, or salty snacks. About half included depictions of water, and about half included depictions of physical activity. Excluding depiction of food groups to consume in moderation, the most common number of food groups depicted was four or five, with the most common groupings being: (1) Starchy staple foods; (2) Fruits and vegetables (either as one group or as two separate groups); (3) Dairy; and (4) Other protein foods (meat, poultry, fish, eggs, legumes, and sometimes nuts). However, there was variability in whether legumes were grouped with protein foods, with vegetables, or with both. Dairy was frequently a separate group but was sometimes grouped with other protein foods. Many countries did not depict nuts or grouped them with fats and oils rather than with protein foods. Other inconsistencies related to how potatoes were classified (as starchy staples, or as vegetables) and in whether fruit juice was depicted with whole fruits. Herforth et al. (2019) analyzed key messages in addition to graphics. The most consistent key messages were aligned with quantitative global guidance from the WHO, including messages on ample consumption of fruits and vegetables and moderation in intake of salt, added sugar, and fats (particularly saturated and trans-fats). Only about one-half of countries emphasized whole grain intake. Key messages encouraging dairy intake were nearly universal in Europe and North America but were less common in Asia, Africa, and Latin America. Some FBDGs provided inconsistent messages on unsaturated fats, with positive key messages indicating to choose them but with graphics grouping the healthier choices (nuts and oils) together with less healthy ones (saturated fats) as groups to moderate.8c.1.6 Future directions for food-based dietary guidelines
Recent FBDGs from several countries have highlighted the need to consider environmental sustainability in addition to concerns with nutrient adequacy and NCD risk reduction. For example, Brazil (2014), Uruguay (2016), Ecuador (2018), and Sweden (2015) all identify environmental sustainability as a guiding principle or central focus for their FBDGs, and Qatar (2015) also includes a key message on environmental protection. WHO and FAO have also articulated guiding principles for sustainable healthy diets (FAO & WHO, 2019). As noted above, the FAO repository for FBDG has begun documenting country-level attention to sustainability. Several recently published FBDGs also include a stronger focus on behaviors to help achieve healthy eating patterns. Several of the same countries noted above (Brazil, Ecuador, Uruguay), as well as Canada, include key messages and guidance around food skills, social aspects of eating (enjoying meals with family and with others), and/or being an informed consumer through reading labels and understanding food industry marketing practices. A number of countries also provide guidance to reduce intake of highly processed foods. In summary, future FBDGs will likely continue to focus on nutrient adequacy and NCD risk reduction, but may move toward incorporating new themes of sustainability, food skills, and messaging around highly processed foods. In addition, increased attention to go beyond careful development of FBDGs to thorough implementation and evaluation is also warranted (Wijesinha-Bettoni et al., 2021). Finally, FBDGs will continue to be updated to reflect new knowledge as well as changes in lifestyles and food supplies.8c.2 Assessing diet quality
This section starts with brief comments on definitions of diet quality, and how these have changed over time. We then provide detailed discussion of the various ways researchers have measured diet quality, both in high-income “data-rich” settings, and in more resource-constrained settings. As noted earlier, our focus is on measurement for population-level applications. Numerous metrics (indicators, indices, and scores) have been developed to measure the quality of the diet. See Box 8c.2 for comments on vocabulary for metrics.
Box 8c.2 Metrics, indicators, indices and scores.
“Metric” is a general term meaning a standard against which something
is evaluated. Other similar terms include “indicator”
or “index” — indicators are sometimes thought of as simple and
reflecting only one dimension, and indices as composites summarizing across
multiple dimensions. However, these terms are used differently by different
authors. Metrics discussed in this section may be called indicators, indices, or
scores. We use the name used by the authors who first developed or reported on
the metric. Since many of the most common diet quality metrics are called
an “index”, we generally
use “index” or “indices”.
Some indices are based on national FBDGs but others are not, and have a different
rationale. For recent reviews of diet quality indices, see:
Burggraf et al., 2018;
Trijsburg et al., 2019;
Aljuraiban et al., 2020; and
Miller et al., 2020.
The section covers:
- How the definition of diet quality has changed over time
- The basis, or rationale for various diet quality indices
- Uses of diet quality indices
- The development process for diet quality indices
- Detailed examples of different types of diet quality indices
8c.2.1 Changing definitions of diet quality
Diet quality indices have evolved along with changing definitions of diet quality (see Box 8c.3). Early indices such as the “Mean Adequacy Ratio” (Guthrie et al., 1972) aimed to summarize nutrient adequacy only. Newer diet quality indices often aim to reflect multiple characteristics of diets. Many indices aim to reflect both nutrient adequacy and characteristics of diets related to NCD risk. Currently, efforts are underway to also incorporate sustainability concerns.
Box 8c.3 Evolution of diet quality definitions
Historically, ideas about diet quality were a response to deprivation, whether
due to poverty or the demands of wartime economies. Healthy and high-quality
diets were defined as those that were sufficient: first in calories and protein,
and later in vitamins and minerals. Fruits, vegetables, and animal-source foods
(dairy, meat, fish and eggs) were considered “protective”
against deficiencies
(see
Harper, 1987
for a history of dietary guidance).
However, as the food supply and food consumption patterns changed in many parts
of the world, the second half of the 20th century brought new concerns and new
diet quality concepts. Relationships between dietary patterns and
non-communicable disease (NCD) risk were illuminated, and a large body of
evidence emerged regarding a different type of “protective” diet, one protective
against NCDs
(Mozaffarian, Rosenberg, and Uauy, 2018)
Evidence of benefit accumulated for particular regional diets, which could be
adapted to suit other settings (for example, the Mediterranean
and “alternate” Mediterranean patterns), for diets designed to reduce
hypertension (for example, the “Dietary Approaches to
Stop Hypertension” (DASH) diet) and others
focused on NCD risk reduction more broadly.
Other specific recent concerns related to diet quality include the inflammatory
effects of dietary components and consequent NCD risk
(Shivappa et al., 2014)
and the impact of ultra-processed foods on nutrient intakes and health risks
(Elizabeth et al., 2020).
Food safety risks are not new but continue as a concern in all contexts. Beyond
human health effects, there is increasing recognition of the effect of diets and
food systems on planetary health, and these concerns are now incorporated in some
definitions of diet quality
(FAO & WHO, 2019).
Global concerns thus now include sufficiency/adequacy, NCD risk reduction, food safety, and sustainability, and these concerns are relevant in all countries
(GBD 2017 Diet Collaborators, 2019).
8c.2.2 Basis for diet quality indices
Indices used for assessing diet quality may be based on national or global dietary guidelines, or they may be based on other assessments of evidence related to nutritional adequacy, diet-health relationships, and/or environmental sustainability. Depending on the underlying definition of diet quality as well as on intended uses, diet quality indices may be designed to capture one, several, or all of the following characteristics of diets:- Food groups consumed: Quantities, diversity between and/or within food groups, and/or balance (proportionality) among food groups;
- Macronutrient balance (for example, percent of energy from protein, carbohydrates and fat);
- Nutrient density of the diet (for example, nutrients per 1000kcals);
- Nutrient adequacy of the diet relative to requirements;
- Moderation in consumption of foods and food groups that elevate NCD risk;
- Adherence to dietary patterns designed to minimize risk of NCDs;
- Adherence to defined healthy cultural dietary patterns;
- Environmental impact and/or sustainability of the diet;
- Adherence to dietary guidance from national or global health authorities, such as national FBDGs or World Health Organization (WHO) guidance.
8c.2.3 Uses of diet quality indices
Diet quality indices have been developed and used for a variety of purposes, including:- Assessment and monitoring
- Describing diet quality for an individual
- Describing diet quality among a population
- Estimating distributions of diet quality among a population
- Describing trends in population diet quality over time
- Epidemiological research
- Examining associations between diet quality and a dependent variable (for example, does adherence to a dietary pattern reduce risk of a particular NCD?)
- Examining associations between an independent variable and diet quality (for example, do lower income groups have lower diet quality?)
- Programmatic and policy uses
- Targeting programs
- Assessing the effects of policy and programmatic interventions on diet quality
- Advocacy and informing policy development
8c.2.4 Development of diet quality indices
There are two general approaches to assessing dietary patterns of individuals, and to development of indices. One approach assesses the diet relative to a pre-defined set of criteria (“a priori” dietary patterns) such as national or global recommendations, or a defined cultural dietary pattern. The second general approach (“a posteriori” dietary patterns, sometimes called “exploratory”) is data driven, involving the examination of clustering of diet characteristics in a particular study sample (Gleason et al., 2015). There are several analytic approaches to defining a data-driven dietary pattern, including factor analysis, principal components analysis, and cluster analysis. Reduced rank regression is a hybrid approach, with a priori identification of characteristics combined with data-driven identification of patterns. Because data-driven dietary patterns are difficult to generalize beyond a particular study setting, they are not further discussed in this section. For a priori dietary patterns, selection of index components (foods, nutrients, etc.) and quantitative criteria for intakes may be well-defined (for example, based on guidelines), but there are still many decisions to be taken during development of indices (Box 8c.4). In the next Section, many of these decisions will be illustrated with a detailed example describing development of the U.S. “Healthy Eating Index” (HEI), which measures adherence to the U.S. dietary guidelines.
Box 8c.4 Examples of decisions to be taken during development of
diet quality indices
What are the component parts of the diet quality index?
Both during development of indices and afterwards, performance is
evaluated in several ways. Indices should be valid and reliable and
well-suited for intended uses. Validation of indices aims to answer
the following questions, among others:
- Should it include food items, food groups, nutrients, and/or food substances such as dietary fiber, polyphenols, or sugar?
- Should potatoes or legumes “count” as vegetables?
- Should juice “count” as fruit?
- Should snails or insects “count” as “meat”?
- Should food group intakes be “counted” in absolute terms, such as in grams? Or should food group intakes be counted in relative terms (for example, grams per 1000kcals of total intake)?
- Is scoring based on absolute criteria, or on relative criteria, such as study-specific distributions of intake for each component?
- Does scoring differ for different age/sex groups, or other groupings?
- How many points per component?
- For scoring based on criteria (not distributions),
should scoring be:
- Dichotomous (1 point if the criterion is achieved, and 0 points if not)?
- Proportional (ranging from lowest score to highest depending on how closely intake adheres to the criterion or recommendation)?
- Scored in some other way?
- Should all components be given the same “weight” in the total score? Or should some components be given heavier “weight” based on knowledge of associations to benefits or risks?
- For indices with both “adequacy” and “moderation” components, how should the total score for the set of all adequacy components be weighted relative to the total score for the set of moderation components?
- Is the index well-grounded in theory?
- Does it cover all dimensions / characteristics of interest (content validity)?
- Does it perform in a way that is consistent with theory (construct validity)?
8c.3 Examples of diet quality indices
This Section presents a series of specific examples of diet quality indices. Literature reviews have identified hundreds of diet quality indices; some are study- or context-specific, while others are proposed for national, regional or global use (Burggraf et al., 2018; Trijsburg et al., 2019; Aljuraiban et al., 2020; Miller et al., 2020). The purpose of this Section is to provide a small set of examples of diverse types of indices, with differing origins and intended uses. Most indices have been developed for adult populations, though they have sometimes been adapted for children and adolescents. Indices developed or adapted for children and adolescents were recently reviewed by Dalwood et al. (2020). Historically, most diet quality indices were initially developed in high-income countries and rely on quantitative dietary recall data from food frequency questionnaires and/or quantitative 24hr recalls for their measurement. These indices also require availability of detailed and comprehensive food composition data. However, several recent initiatives have aimed to develop lower burden proxy indices measuring one or more diet quality characteristics, with less costly data requirements, for use in global and/or national monitoring. Table 8c.1 presents some examples of some of the most widely used indices, as well as some newer indices intended for global use.| Name | Basis of Index |
|---|---|
| Food and/or nutrient-based indices | |
| U.S. Healthy Eating Index (HEI) | Measures adherence to key
recommendations in the Dietary Guidelines for Americans |
| Alternate Healthy Eating Index (AHEI) |
Measures consumption of a literature-based selection of foods and nutrients consistently associated with decreased risk of NCDs |
| Mediterranean Diet Score (MDS) |
Measures adherence to one of the traditional dietary patterns of the Mediterranean region, or adapted versions of these |
| Dietary Approaches to Stop Hypertension diet index (DASH) |
Measures adherence to a dietary pattern originally developed in a randomized controlled trial for reducing hypertension |
| Healthy Diet Indicator (HDI) |
Measures adherence to WHO global dietary recommendations for the prevention of chronic disease |
| Indices based on other characteristics | |
| Dietary Inflam- matory Index (DII) |
A scoring system summarizing the inflammatory potential of the diet; inflammatory diets have been linked to NCDs |
| Percent of energy from ultra-processed foods (% UPF) |
Metric based on evidence that intakes of UPF are associated with poor quality diets and health risks |
| Lower-burden indices designed for settings where quantitative data are not feasible | |
| Minimum dietary diversity (MDD) | Proxy for micronutrient density of infant and young child diets |
| Minimum dietary diversity for women of repro- ductive age (MDD‑W) | Proxy for micronutrient adequacy of women's diets |
| Global Dietary Recommendations Score (GDR) |
Adherence to WHO Healthy Diet guidance and World Cancer Research Fund / American Institute for Cancer Research recommendations; proxy for HDI |
| Global Diet Quality Score (GDQS) |
Measures consumption of a literature-based selection of food groups that contribute to nutrient intake and NCD risk reduction across a variety of global dietary patterns. |
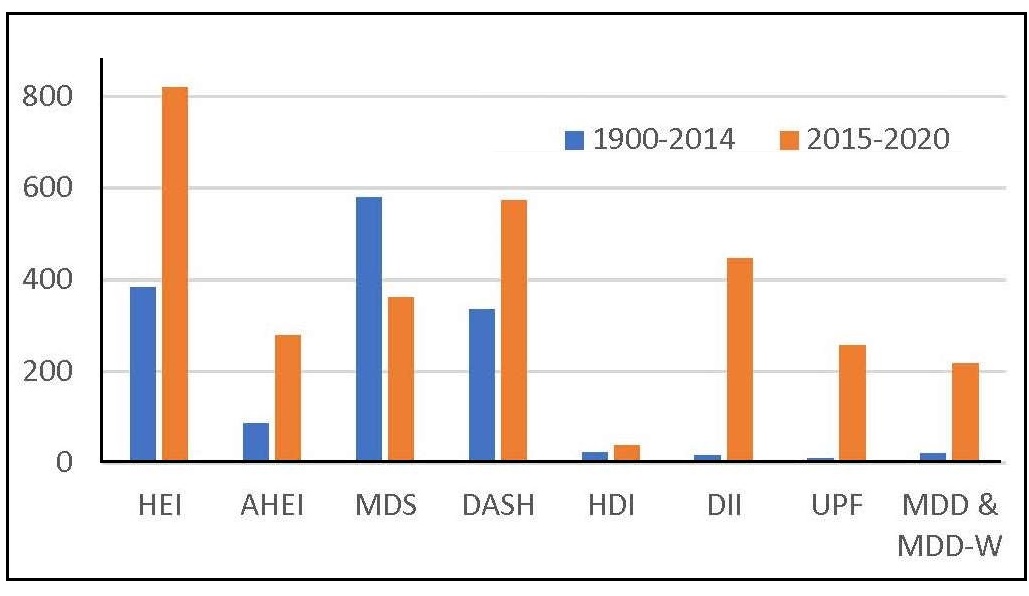
The PubMed database was searched on 15 February 2021, for the following terms, in all fields: for HEI, “Healthy Eating Index”; AHEI, “Alternate Healthy Eating Index”; MDS, “Mediterranean Diet Score”; DASH, “Dietary Approaches to Stop Hypertension”; HDI, “Healthy Diet Indicator”; DII, “Dietary Inflammatory Index”; UPF, “Ultra-processed Food”; MDD, “Minimum Dietary Diversity”. Additional PubMed search terms were: for HEI: “NOT alternate NOT alternative”; for AHEI: “alternative healthy eating index”; for UPF: “NOVA classification”. The GDR Score and the GDQS are not included because they are too recent; the GDR Score was published in November 2020 and the GDQS was published in 2021. Note that for the search related to the HEI, articles could have been reporting on the U.S. HEI, or on adaptations or similar indices developed for other countries but using the same index name.
8c.3.1 Basis, development, and scoring of the U.S. Healthy Eating Index
The Healthy Eating Index (HEI) was designed to reflect adherence to the U.S. national dietary guidelines, which apply to all individuals ≥ 2y. The dietary guidelines are intended both to ensure nutrient adequacy and to reduce risks of NCDs, and hence the HEI also reflects both adequacy and NCD risk reduction. The HEI can be used to characterize diets of children ≥ 2y as well as adults. The US dietary guidelines are updated every five years. The HEI was first published in 1995 (Kennedy et al., 1995), and was updated in 2005, 2010 and 2015 to reflect new and revised guidance (Krebs-Smith et al., 2018); the HEI will be updated again in 2022. The HEI can be calculated using data from quantitative 24hr recalls, food records, or food frequency questionnaires. The appropriate method of calculation depends on the data type and on intended uses. For most uses, the HEI should be calculated based on usual dietary intake (i.e., accounting for day-to-day variability in intakes) (Kirkpatrick et al., 2018). The original HEI included 10 components: five food groups reflecting adequacy, four nutrients reflecting moderation, and a measure of variety in food intake. Each component was scored from 0 to 10, with adequacy components (food group scores) based on total intake, yielding a total possible score of 100. Table 8c.2 shows scoring for the newer HEI‑2015, which includes nine adequacy components, and four moderation components.| Component | Max. pointsa | Standard for maximum score | Standard for minimum score |
|---|---|---|---|
| Adequacy | |||
| Total fruitsb | 5 | ≥ 0.8 cup
equivalent per 1000kcal | No fruit |
| Whole fruitsc | 5 | ≥ 0.4 cup equivalent per 1000kcal | No whole fruit |
| Total vegetablesd | 5 | ≥ 1.1 cup equivalent per 1000kcal | No Vegetables |
| Greens and beansd | 5 | ≥ 0.2 cup equivalent per 1000kcal | No dark-green vegetable or legumes |
| Whole grains | 10 | ≥ 1.5 ounce equivalent per 1000kcal | No whole grains |
| Dairye | 10 | ≥ 1.3 cup equivalent per 1000kcal | No dairy |
| Total protein foodsd | 5 | ≥ 2.5 ounce equivalent per 1000kcal | No protein foods |
| Seafood and plant proteinsd,f | 5 | ≥ 0.8 ounce equivalent per 1000kcal | No seafood or plant proteins |
| Fatty acidsg | 10 | (PUFA + MUFA)/SFAs ≥ 2.5 | (PUFA + MUFA)/SFAs ≤ 1.2 |
| Moderation | |||
| Refined grains | 10 | ≤ 1.8 ounce equivalent per 1000kcal | ≥ 4.3 ounce equiv- alent per 1000kcal |
| Sodium | 10 | ≤ 1.1 grams per 1000kcal | ≥ 2 grams per 1000kcal |
| Added sugars | 10 | ≤ 6.5% of energy | ≥ 26% of energy |
| Saturated fats | 10 | ≤ 8% of energy | ≥ 16% of energy |
- Nature of component parts (for example, food groups, nutrients, or both);
- Operational definition of what food items “count” for each component.
- Decision on how to account for energy intakes;
- Criteria for scoring of each component, including quantity of intake for maximum score;
- Relative scoring of components (i.e., weighting), and range for total score;
8c.3.2 Evaluation of U.S. Healthy Eating Index‑2015
The validity of the HEI‑2015 and its predecessors has has been assessed in several ways. Krebs-Smith et al. (2018) report on content validity — that is, the extent to which the index captures relevant dimensions of a healthy diet, as defined in the U.S. dietary guidance. Reedy et al. (2018) report on construct and criterion-related validity. Construct validity was assessed in several ways. “Exemplary menus” were shown to receive high HEI‑2015 scores; scores in a nationally representative sample demonstrated sufficient variation (range from the 1st–99th percentile was from 33 to 81 points) and scores were significantly different between smokers and non-smokers, as expected a priori. Scores were independent of energy intakes, i.e., reflective of quality, rather than quantity of intakes. Criterion-related validity was demonstrated in a prospective cohort, where the highest vs the lowest quintiles of the HEI‑2015 scores were associated with a decreased risk of all cause, cancer, and cardiovascular disease mortality. In addition, scores for previous versions of the HEI have been shown to be associated with reduced risks of NCDs and mortality in numerous studies (see, for example, Liese et al., 2015; Schwingshackl & Hoffmann, 2015).8c.3.3 Interpretation of the U.S. Healthy Eating Index-2015
For descriptive purposes, total scores can be complemented by graphical representations and by a grading scale (Krebs-Smith et al., 2018). Radar graphs ( Figure 8c.3)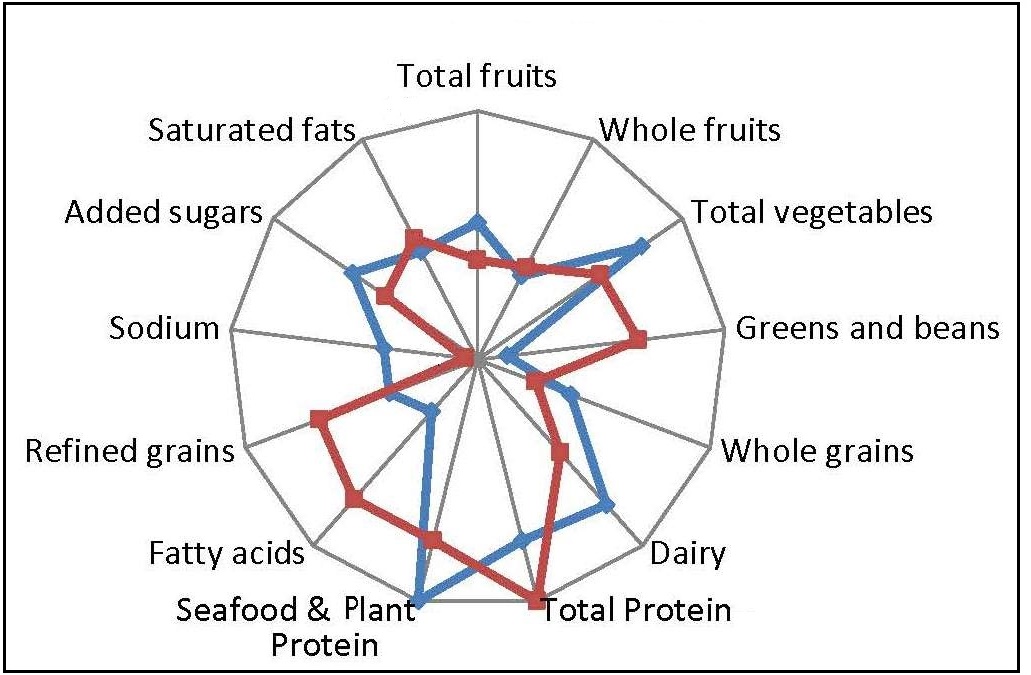
Box 8c.5 Summary of Healthy Eating Index‑2015
- Measures adherence to 2015–2020 U.S. dietary guidelines;
- Applies to children ≥ 2y, adolescents and adults;
- Component parts are food and beverage groups, nutrients (fatty acids, sodium), and added sugar;
- Components are expressed as densities (usually, per 1000kcal);
- Can be used to assess at various levels (for example, diet quality of populations, menus, food supplies);
- Requires detailed quantitative dietary intake data in grams or standard servings consumed, as well as linkages to databases with information on nutrients and food groups;
- Scoring is based on a priori criteria for intakes as found in the U.S. guidelines; scoring is not study-specific and relative (for example, quartiles);
- Intakes between minimum and maximum scores (per component) are scored proportionally;
- Sixty points are awarded for adequacy components and 40 points for moderation components;
- Guidance on presentation is provided, including visual presentation, use of “grades”, and the interpretation of effect sizes.
8c.3.4 Adaptation of the Healthy Eating Index concept
In addition to the periodic updates related to updated U.S. dietary guidelines, the HEI concept has also been adapted for other contexts. Similar indices measuring adherence to national guidelines were developed for many countries, including:- Australia (Roy et al., 2016)
- Brazil (Previdelli et al., 2011; Andrade et al., 2013)
- Canada (Garriguet, 2009; Jessri, Ng, and L'Abbé, 2017)
- China (Yuan et al., 2017; 2018)
- Denmark (Bjerregaard et al., 2019)
- France (Estaquio et al., 2009; Chaltiel et al., 2019)
- Germany (Moon et al., 2017; Mader et al., 2020)
- Korea (Yook et al., 2015; Park et al., 2020)
- Malaysia (Pondor, Gan, & Appannah, 2017)
- Mexico (López-Olmedo et al., 2019)
- The Netherlands (Looman et al., 2017)
- Russia (Martinchik et al., 2019)
- Spain (Norte Navarro & Ortiz Moncada, 2011)
- Thailand (Taechangam, Pinitchun, & Pachotikarn, 2008)
8c.4 Alternate Healthy Eating Index
While the HEI and similar indices in other countries measure adherence to current national dietary guidelines, another very widely used index, the “Alternate Healthy Eating Index” (AHEI), was developed to reflect additional evidence related to NCDs, which had not been incorporated in the US national guidance at the time. As first developed by McCullough et al. (2002), the AHEI incorporated some of the same elements as the original HEI, but in addition emphasized: consumption of whole grains; a favorable ratio of fish and poultry to red and processed meats; intake of nuts and soy foods; and a favorable ratio of polyunsaturated to saturated fats. Unlike the HEI, dairy is not included in the scoring. The AHEI showed stronger associations than the original HEI to cardiovascular disease outcomes for both men (McCullough et al., 2000) and women (McCullough et al., 2000). The authors noted that this evidence could help inform future revisions of dietary guidelines.| Component | Standard for maximum. score (10)a | Standard for minimum score (0) |
|---|---|---|
| Vegetables, servings/d b | ≥ 5 | 0 |
| Fruit, servings/d c | ≥ 4 | 0 |
| Whole grains, g/d d — Women | 75 | 0 |
| Whole grains, g/d d — Men | 90 | 0 |
| Sugar-sweetened beverages and fruit juice, servings/d e | 0 | ≥ 1 |
| Nuts and legumes, servings/d f | ≥ 1 | 0 |
| Red/processed meat, servings /d g | ≤ 1 | ≥ 1.5 |
| Trans fat, % of energy | ≤ 0.5 | ≥ 4 |
| Long-chain (n-3) fats (EPA + DHA), mg/d h | 250 | 0 |
| PUFA, % of energy | ≥ 10 | ≤ 2 |
| Sodium, mg/d i | Lowest decile | Highest decile |
| Alcohol, drinks/d j — Women | 0.5–1.5 | ≥ 2.5 |
| Alcohol, drinks/d j — Men | 0.5–2.0 | ≥ 3.5 |
| Total points | 110 | 0 |
Box 8c.6 Summary of Alternate Healthy Eating Index 2015
- Measures adherence to a set of recommendations based on review of epidemiological evidence by researchers;
- Developed for adults;
- Component parts are food and beverage groups and nutrients (fatty acids), mostly expressed as quantities consumed per day;
- Requires detailed quantitative dietary intake data (grams or standard servings consumed); as well as linkages to databases with information on nutrients and food groups;
- Scoring is based on a priori criteria for intakes with the exception of sodium, which is scored based on deciles in the data set under study;
- Intakes between minimum and maximum scores (per component) are scored proportionally;
- Sixty points are awarded for adequacy components and 40 points for moderation components; for alcohol, scoring is “U‑shaped”
8c.5 Mediterranean Diet Score or Index
Evidence on the healthfulness of various Mediterranean regional diets has been accumulating since the mid‑20th century (Menotti & Puddu, 2015). Generally, Mediterranean diets are characterized by a high intake of plant-based foods including olive oil, fruit, nuts, vegetables, and cereals; a moderate intake of fish and poultry; a low intake of dairy products, red meat, processed meats, and sweets; and a moderate amount of wine. However, unlike the dietary patterns captured by the HEI and AHEI, which each have a single definition, there are numerous Mediterranean diets and numerous scores and indices (see: Milà-Villarroel et al., 2011; D'Alessandro & Pergola, 2018; Zaragoza-Martí et al., 2018). In contrast to the HEI and AHEI, Mediterranean Diet Scores (MDSs) are generally based on foods and beverages only, rather than on a mix of foods/beverages and nutrients. Intended uses of MDSs are not consistently clearly stated in papers reporting on their development. They are frequently used in epidemiological studies investigating associations of diets to morbidity and mortality. MDSs vary widely in their scoring range (for example, possible scores of 0–8 vs. 0–100) and in the rationale and method of scoring, as illustrated in the following examples.8c.5.1 Mediterranean Diet Score of Trichopoulou
MDSs with the narrowest ranges are scored as “yes” (1) or “no” (0) for a small set of food groups. Trichopoulou et al. (1995) developed one of the first MDS and demonstrated an association with mortality in a Greek population. The original analysis was based on semi-quantitative food frequency data from adults over 70y. This MDS was designed for an epidemiological study. The MDS of Trichopoulou et al. is an 8-point score, assessing for the following:- High consumption of legumes
- High consumption of cereals (including bread and potatoes)
- High consumption of fruits
- High consumption of vegetables
- Low consumption of meat and meat products
- Low consumption of milk and dairy products
- High ratio of monounsaturated to saturated fat
- Moderate alcohol consumption
8c.5.2 “MedDietScore” of Panagiotakos
For a prospective cohort study of adults in Athens, Panagiotakos et al. (2007) developed a 55‑point “MedDietScore” where scoring did not depend on the distribution of intake among study subjects. Instead, each component was scored from 0–5 based on respondent report of frequency of consumption, based on data from a semi-quantitative food frequency questionnaire covering the past year. Component scores increased with frequency for 7 “positive” components — non‑refined cereals, fruits, vegetables, legumes, olive oil, fish and potatoes — and decreased with frequency for 3 “negative” components — red meat and products, poultry and full‑fat dairy products. As with several other indices, there were more “positive” components than “negative” components. This MedDietScore was negatively associated with hypertension, hypercholesterolemia, diabetes and obesity in the initial study and was later shown to be negatively associated with 10‑year incidence of cardiovascular disease (Panagiotakos et al., 2015) and diabetes (Filippatos et al., 2016).8c.5.3 “MEDI-LITE” Score of Sofi
Sofi et al. (2014) developed an 18‑point “literature-based” adherence score, shown in Table 8c.4. This adherence score, the “MEDI-LITE” score, was designed for both epidemiological and clinical use; however, a primary aim was to develop a simple tool feasible for use at the individual level, within clinical practice.| Component | Low intake (score) | Moderate intake (score) | High intake (score) |
|---|---|---|---|
| Fruit (1 portion = 150g) | < 1 portion/d (0) | 1–1.5 portions/d (1) | > 2 portions/d (2) |
| Vegetables (1 portion = 100g) | < 1 portion/d (0) | 1–2.5 portions/d (1) | > 2.5 portions/d (2) |
| Legumes (1 portion = 70g) | < 1 portion/wk (0) | 1–2 portions/wk (1) | > 2 portions/wk (2) |
| Cereals (1 portion = 130g) | < 1 portion/d (0) | 1–1.5 portions/d (1) | > 1.5 portions/d (2) |
| Fish (1 portion = 100g) | < 1 portion/wk (0) | 1–2.5 portions/wk (1) | > 2.5 portions/wk (2) |
| Meat/meat products (1 portion = 80g) | < 1 portion/d (2) | 1–1.5 portions/d (1) | > 1.5 portions/d (0) |
| Dairy products (1 portion = 180g) | < 1 portion/d (2) | 1–1.5 portions/d (1) | > 1.5 portions/d (0) |
| Alcohol (1 alcohol unit (AU) = 12g) | < 1 AU/d (1) | 1–2 AU/d (2) | > 2 AU/d (0) |
| Olive oil | Occasional use (0) | Frequent use (1) | Regular use (2) |
8c.5.4 Mediterranean-Style Dietary Pattern Score of Rumawas
More recently, some Mediterranean diet indices have been proposed with wider scoring ranges and with scoring based on criterion values (recommended intakes). Rumawas et al. (2009) developed a 100‑point Mediterranean-Style Dietary Pattern Score (MSDPS) based on the Mediterranean Diet Pyramid of Willett et al. (1995); scoring is shown in Table 8c.5.| Component | Standard for maximum score of 10a | Scoreb |
|---|---|---|
| Servings/day | Points/serving | |
| Whole grains | 8 | 1.25 |
| Fruits | 3 | 3.33 |
| Vegetables | 6 | 1.67 |
| Dairy | 2 | 5.0 |
| Wine - Women | 1.5 | 6.67 |
| Wine - Men | 3 | 3.33 |
| Servings/week | Points/serving | |
| Fish and other seafood | 6 | 1.67 |
| Poultry | 4 | 2.5 |
| Olives, legumes, and nuts | 4 | 2.5 |
| Potatoes, starchy roots | 3 | 3.33 |
| Eggs | 3 | 3.33 |
| Sweets | 3 | 3.33 |
| Meat | 1 | 10.0 |
| Practice | Points | |
| Olive oil | Use only olive oil | 0 (for no use) 5 (for use of olive and other vegetables oils) |
8c.5.5 Summary of Mediterranean Diet Scores
There is no consensus on a single or “best” Mediterranean Diet Score or Index, and this depends on intended uses; see D’Alessandro and De Pergola (2018) for a discussion. Although many MDSs were originally developed based on analyses of data from adult populations, including elders, MDSs have been adapted and used in studies of children and adolescents (Dalwood et al., 2020). Finally, concerning the potential to adapt the MDS for relevance in other regions, there is more experience in high-income countries and in the global north compared to the global south. The applicability of the pattern described by the MDS to some other regions is not established, particularly in regions where some of the distinctive components (for example, olive oil, red wine, nuts, legumes, and/or fish) are not available and/or are not part of cultural dietary patterns. However, reporting on a global World Heart Federation Consensus Conference, Anand et al. (2015) suggest that the evidence base for the Mediterranean diet is sufficiently consolidated that it can be recommended globally, and they provide suggestions for its adaptation with foods from other regions. Once the dietary pattern is adapted to other regions, adapted scores could also be developed (as, for example, in Echeverría et al., 2019; El Kinany et al., 2020). Box 8c.7 summarizes key points about MDSs.
Box 8c.7 Summary of Mediterranean diet scores and indices
- There are a large number of scores and indices measuring adherence to different versions of the Mediterranean diet;
- The original scores were developed based on data from older adults, but there are many versions adapted for children and adolescents;
- MDSs have been adapted for several other regions, but certain characteristic foods are not consumed or are rarely consumed in some other global regions;
- Component parts are usually food groups; olive oil and alcohol are also often included;
- Components are usually expressed as quantities, not densities;
- Most MDSs requires detailed quantitative dietary intake data (grams or standard servings consumed);
- Most MDSs were developed for use in epidemiological studies, but are also appropriate to use in describing diet quality of populations;
- Scoring for components is sometimes absolute (based on a priori criteria for intakes) but for many MDSs, scoring is not absolute and instead is based on distributions of intake in the study sample (for example, with high points given to the highest quartile or quintile of intakes);
- Both the complexity of scoring and the balance between positive and negative scores vary widely among MDSs.
8c.6 Dietary Approaches to Stop Hypertension scores
Scores reflecting adherence to the Dietary Approaches to Stop Hypertension (DASH) dietary pattern have also been widely used, particularly in studies investigating associations between dietary patterns and NCDs. The original DASH diet and scoring were developed for a randomized controlled feeding trial investigating the impact of a prescribed dietary pattern on blood pressure. The trial, initiated in 1994, compared a typical U.S. dietary pattern to one high in fruits, vegetables, and low-fat dairy products, that emphasized fish and chicken rather than red meat, and was low in saturated fats, cholesterol, sugars, and refined carbohydrate. The original study demonstrated reductions in blood pressure after the 8‑week intervention (Sacks et al., 1999). Follow-up research demonstrated additional benefits from reductions in sodium intake; sodium intake had not been manipulated in the original trial (Sacks et al., 2001). While the DASH diet was originally developed to lower blood pressure, subsequent studies have linked higher adherence to the DASH diet with lower risks for a range of adverse outcomes, including all-cause mortality, cardiovascular disease incidence or mortality, cancer incidence or mortality, type 2 diabetes, and neurodegenerative disease (Morze et al., 2020). As for Mediterranean diets, there have been several specific scores developed to reflect adherence to the DASH diet, and DASH scores have also been developed for pediatric populations. Table 8c.6| Component | Standard for maximum score | Standard for minimum score |
|---|---|---|
| Whole grains | Highest quintile | Lowest quintile |
| Vegetables (excluding potatoes) | ||
| Fruit | ||
| Nuts and legumes | ||
| Low-fat dairy | ||
| Red and processed meat | Lowest quintile | Highest quintile |
| Sugar-sweetened beverages | ||
| Sodium |
8c.7 Healthy Diet Indicator
Just as the HEI was developed to capture adherence to U.S. national dietary guidance, the Healthy Diet Indicator (HDI) was developed to capture adherence to global guidance from the WHO (Huijbregts et al., 1997) and was revised to reflect updated guidance (Stefler et al., 2014; Jankovic et al., 2015). Both the original and the updated versions demonstrated associations with mortality in multi-country studies (Huijbregts et al., 1997; Stefler et al., 2014), although the associations were not entirely consistent (Jankovic et al., 2015). The original HDI study analyzed data from cohorts of older men in three western European countries (Huijbregts et al., 1997), while the revised version was first used in studies of adults from Eastern Europe (Stefler et al., 2014) and elders from the U.S. and Europe (Jankovic et al., 2015). To our knowledge, the HDI has not been widely used in studies of children. Unlike all the previous scores and indices, most of the components in the HDI are nutrients or food substances rather than food groups. This reflects the fact that the WHO “Healthy Diet Fact Sheet” currently gives quantitative guidance for intakes of sugars, various types of fatty acids, and salt, but limited guidance on quantitative intakes of food groups.| Component | Standard for scoring (quantitative intake in one day) |
|
|---|---|---|
| 1 | Fruits, vegetables | ≥ 400g |
| 2 | Beans and other legumes | > 0g |
| 3 | Nuts and seeds | > 0g |
| 4 | Whole grains | > 0g |
| 5 | Dietary fiber | > 25g |
| 6 | Total fat | < 30% total energy |
| 7 | Saturated fat | < 10% total energy |
| 8 | Dietary sodium | < 2g |
| 9 | Free sugars | < 10% total energy |
| 10 | Processed meat | 0g |
| 11 | Unprocessed red meat | ≤ 71ga |
Box 8c.8 Summary of several versions of a Healthy Diet Indicator
- All versions of the HDI measure adherence to World Health Organization guidance; the most recent version also incorporates guidance from the World Cancer Research Fund/American Institute for Cancer Research;
- Focus is on NCD risk;
- Based on guidance for adults;
- Component parts are food groups, fiber, nutrients (fatty acids, sodium) and free sugars;
- Components are expressed in absolute terms, not as densities;
- Requires detailed quantitative dietary intake data (grams or standard servings consumed); as well as linkage to databases with information on nutrients
- Scoring is based on a priori criteria for intakes as found in global guidance; scoring is not study-specific and relative (for example, quartiles)
- In the HDI-2020, there are five healthy components and six components to limit, all weighted equally;
- In the HDI-2020, scoring is a simple count — with each of eleven components scored “0” or “1”
8c.8 Dietary Inflammatory Indices
Recently, several diet quality indices have been developed to capture the inflammatory potential of the diet (Tabung et al., 2016; 2017; Hébert et al., 2019). Such indices were developed in recognition of the key role of chronic low-grade inflammation in the etiology of NCDs, and the role of dietary factors in chronic inflammation. In this section, we describe one widely used index, the Dietary Inflammatory Index (DII). The DII was designed for global relevance, regardless of the cultural dietary pattern (Hébert et al., 2019). The DII is scored primarily based on nutrients and food substances. Selection of and weighting of components were based on a comprehensive literature review spanning 1950–2010 and including studies from diverse populations that assessed the relationships of nutrients, foods, and food substances to six inflammatory biomarkers (Cavicchia et al., 2009; Shivappa et al., 2014). The DII has been applied in studies of a wide range of NCDs and risk factors. A recent review documented associations between DII scores and certain cancers, cardiovascular disease and its associated mortality, adverse mental health, and musculoskeletal disorders. Evidence on DII and respiratory health, neurodevelopmental outcomes, the metabolic syndrome, obesity and diabetes is either conflicting or limited to date (Phillips et al., 2019). Scoring for the DII is based on 45 components, consisting mainly of macro‑ and micronutrients and food substances (for example, flavonoids, caffeine) but also including several foods, herbs/spices (garlic, ginger, onion, pepper, rosemary, saffron, thyme, and turmeric), and beverages (tea and alcohol). In the most recent version, scoring cut-offs were determined based on associations of components to inflammation in studies from eleven countries in all global regions except Africa. (Shivappa et al., 2014). Each of the 45 components has a score indicating its pro‑ or anti-inflammatory potential, with positive scores for pro-inflammatory components and negative scores for anti-inflammatory components. The DII is the sum of the component scores. Unlike many indices described above, the components of the DII are not equally weighted. The total range in seven “example scenarios” was from +7.98 (strongly pro-inflammatory) to −8.87 (i.e. strongly anti-inflammatory); the example scenarios were created by the authors to illustrate various combinations of plausible intakes for the 45 components (Shivappa et al., 2014). Note that — unlike other indices — a negative score is better than a positive one. The DII has been further adapted in a version that adjusts for total energy (E-DII) and in a version for children (C-DII), validated for children 6–14y. The C-DII predicted blood concentration of one inflammatory marker (C-reactive protein) in children (Khan et al., 2018). Construction of the DII requires data on all components, though it has been adapted for use when data for some components are not available (Davis et al., 2021). The DII has primarily been used to further elucidate the relationship between the inflammatory potential of overall diets and various health outcomes. Box 8c.9 summarizes key points about the DII.
Box 8c.9 Summary of the Dietary Inflammatory Index
- The DII measures the inflammatory potential of the diet;
- Originally developed for adults, but a version has been developed for children 6–14y
- Component parts are primarily nutrients, food substances, and herbs and spices, with few foods or beverages — and no food groups — in the index;
- The DII requires detailed quantitative dietary intake data, including on intake of herbs and spices, and the availability of food composition data that includes many food substances;
- To date, the primary use of the DII has been in epidemiological studies.
8c.9 Diet quality based on level of food processing
Another recent approach to assessment of diet quality is based on classification of foods and beverages according to the level of processing in their production. Monteiro et al. (2010) first proposed a system of classification, which was subsequently modified to include four groups:- Unprocessed or minimally processed foods;
- Processed culinary ingredients;
- Processed foods; and
- Ultra-processed food and drink products.
“A practical way to identify an ultra-processed product is to check to see if its list of ingredients contains at least one item characteristic of the NOVA ultra-processed food group, which is to say, either food substances never or rarely used in kitchens (such as high-fructose corn syrup, hydrogenated or interesterified oils, and hydrolysed proteins), or classes of additives designed to make the final product palatable or more appealing (such as flavours, flavour enhancers, colours, emulsifiers, emulsifying salts, sweeteners, thickeners, and anti-foaming, bulking, carbonating, foaming, gelling and glazing agents)” (Monteiro et al., 2019, p. 936).Examples of UPF include packaged instant soups and noodles, carbonated beverages, reconstituted meat products, many sweet and savory packaged snacks, frozen “ready meals”, and fast food dishes. Some UPF provide substantial nutrients, either from food ingredients (for example, packaged sweetened yogurts) or from fortification (for example, highly processed but fortified breakfast cereals), leading to challenges on definition of categories, and some disagreement on the value of the NOVA classification (Gibney, 2019; Jones, 2019). The percent of energy from UPF has been shown to be high or very high in some countries; for example, UPF comprise from 40%–50% of energy intake in Australia (Machado et al., 2019), Brazil (Siqueira et al., 2020) and Canada (Polsky, Moubarac, & Garriguet, 2020) and nearly 60% in the United States (Martínez-Steele et al., 2017). While similar intake data are not available for most low- and middle-income countries, sales of UPF are growing rapidly in Asia and Africa (Vandevijvere et al., 2019; Baker et al., 2020). Assessment of the role of UPFs in the diet has been undertaken for a wide range of age groups, beginning in infancy. A higher proportion of total intake from UPF has been associated with lower intakes of some micronutrients and higher intakes of sugars, salt, and saturated and trans-fatty acids (see for example Martínez-Steele et al., 2017; Moubarac et al., 2017; Machado et al., 2019). However, several studies documented higher calcium intakes with higher UPF consumption, perhaps due to consumption of sweetened and/or other processed dairy products (Louzada et al., 2015; Batal et al., 2018; Cornwell et al., 2018). Recent reviews have summarized associations with a wide range of risk factors and negative health outcomes, including overweight, obesity and cardiometabolic risks, some cancers, type 2 diabetes and cardiovascular diseases, irritable bowel syndrome, depression and all‑cause mortality (Chen et al., 2020; Elizabeth et al., 2020). Box 8c.10 summarizes key points about the percent of energy from UPF.
Box 8c.10 Summary of percent of energy from ultra-processed foods
- Differs from other indices through its focus on one characteristic, processing level and this characteristic cuts across foods, beverages and food/beverage groups;
- Classification by processing level is done at the level of individual food and beverage item;
- Does not involve scoring based on consumption of food groups, nutrients, or food substances;
- The percent UPF is a density indicator, because it is expressed as a percent of energy;
- Like the HEI, it can be used for different age groups and at different levels, to characterize diets, menus, food supplies etc.;
- Requires detailed quantitative dietary intake data (grams or standard servings consumed).
8c.10 Lower-burden diet quality indices
Most diet quality indices described above require quantitative dietary intake data, for example from food frequency questionnaires, quantitative 24hr recalls, or other detailed quantitative approaches. Obtaining accurate quantitative dietary intake data is resource intensive. Because of the resource requirements, many low‑ and middle-income countries do not currently have nationally representative dietary intake data, and even high-income countries may not collect such data sufficiently frequently to meet all needs, such as for monitoring of population-level diet quality trends. To meet needs for basic information on intake patterns in contexts where quantitative data are not available, several “lower-burden” approaches have been developed, particularly for use in global and national monitoring under resource constraints. These lower-burden approaches are all food group- based and/or ask behavioral questions (rather than including nutrient intakes for their calculation) and do not require food composition data for tabulation.8c.10.1 Global surveillance of dietary behaviors
Many lower-burden survey tools (often called “screeners”) have been developed to capture only one or several components of intake, and/or dietary habits. Examples of screeners developed for global use are the questionnaires for the WHO Stepwise Approach to NCD Surveillance (STEPS) and the Global School-Based Student Health Survey (GSHS). Currently, the WHO STEPS questionnaire includes questions on fruit, vegetable, and salt/salty condiment consumption. The GSHS questionnaire is under revision; previously, it included core questions on fruits, vegetables, carbonated soft drinks, and food from fast food restaurants. To date, neither of these surveys captures the “whole of diet”, and data from these surveys have not been used to develop overall indices of diet quality.8c.10.2 Food group diversity proxy indicators for micronutrients
Some food group diversity indicators have demonstrated associations with micronutrient adequacy of diets (Verger et al., 2021). Because of this, several have been developed as simple proxies for micronutrient adequacy, for use when more complex indices are not feasible. These indicators do not require use of food composition data, and they do not require detailed quantitative dietary intake data. They were developed primarily for use in resource-constrained environments, where diets may be very impoverished, low in food group diversity, and consequently provide inadequate micronutrients. They are intended for population-level use — for example, in monitoring trends — and not to describe diets of individuals. Indices were developed for several demographic groups, including infants and young children and women of reproductive age. In both cases, construct validity was evaluated cross-sectionally by comparing the simple indices to micronutrient density or adequacy of diets, in data sets from studies in multiple low- and lower-middle income countries. (Working Group on Infant and Young Child Feeding Indicators, 2006; Arimond et al., 2010; Martin-Prevel et al., 2017). A “Minimum Diet Diversity” (MDD) indicator was developed as a proxy indicator of the micronutrient density of the diet for infants and young children 6–23mos (WHO 2021). MDD data can be collected using a lower-burden non-quantitative recall questionnaire for food groups fed to the infant or young child the day before the survey. The updated version of the 2008 document includes 8 food groups. Infants and young children fed five or more of the eight food groups, in any amount, meet the criterion for MDD. Groups of infants and young children meeting MDD are likely to have a diet higher in micronutrient density than those who consume fewer food groups. Food groups are:- Breast milk
- Grains, white/pale starchy roots, tubers and plantains
- Beans, peas, lentils, nuts and seeds
- Dairy products (milk, infant formula, yogurt, cheese)
- Flesh foods (meat, fish, poultry, organ meats)
- Eggs
- Vitamin A-rich fruits and vegetables
- Other fruits and vegetables
- Grains, white roots and tubers, and plantains
- Pulses (beans, peas, and lentils)
- Nuts and seeds
- Dairy
- Meat, poultry and fish
- Eggs
- Dark-green leafy vegetables
- Other vitamin A rich fruits and vegetables
- Other vegetables
- Other fruit
8c.10.3 Global Dietary Recommendations Score
In addition to proposing an updated HDI‑2020 based on global recommendations from the WHO and the World Cancer Research Fund / American Institute for Cancer Research; (as described above), Herforth et al. (2020) also developed a Global Dietary Recommendations (GDR) Score. The GDR Score is a lower-burden index capturing adherence to these global recommendations. It was explicitly developed as a complement to the MDD‑W, to fill a gap in low burden indices reflecting NCD risk reduction. Like the MDD-W, the GDR Score is meant for use in assessing and monitoring diets at the population level, not the individual level. Construct validity was assessed by comparing the GDR Score to the HDI‑2020 in two nationally representative data sets, from Brazil and the United States, using data for ages ≥15y.| GDR-Healthy (positively scored) |
|---|
| Dark-green leafy vegetables |
| Vitamin A-rich orange-colored vegetables, roots, tubers |
| Other vegetables |
| Vitamin A-rich fruits |
| Citrus fruits |
| Other fruits (including red/purple/blue fruits) |
| Legumes |
| Nuts/seeds |
| Whole grains |
| GDR-Limit (negatively scored) |
| Sodas/sugar-sweetened beverages |
| Baked/grain-based sweets |
| Other sweets |
| Processed meat (double weight) |
| Unprocessed red meat |
| Deep-fried foods |
| Food from a fast-food restaurant, or Instant noodles |
| Packaged salty snacks |
8c.10.4 Global Diet Quality Score
The Global Diet Quality Score (GDQS) represents another lower-burden approach to characterizing diet quality at population level, including both nutrient adequacy and NCD risk (Bromage et al, 2021). In contrast to the GDR Score, the GDQS is not based on adherence to existing / current global guidance. Its development was similar to that of the AHEI, in that food groups were selected for inclusion based on a review of literature demonstrating relationships of food group intakes to outcomes. Further analyses of multiple data sets, including cross-sectional and cohort data, led to refinement of the food groups and scoring. The GDQS evolved from an earlier index initially developed for use in the United States as a clinical screener (Rifas-Shiman et al., 2001). The global version was developed for population-level use based on extensive analyses of data sets from Africa (several countries), India, China, Mexico, and the US. Construct validity was assessed relative to nutrient adequacy, biomarkers for NCD risk, metabolic syndrome and incidence of type 2 diabetes (Bromage et al, 2021). Data requirements for the GDQS are intermediate in complexity and, as for the MDD‑W and the GDR Score, no food composition data is needed to construct the GDQS. Semi-quantitative data are needed to distinguish categories for quantity of intake for each of the 25 food group components (Table 8c.9).| Categories of con- sumed amounts (g/d) | Points assigned | ||||||
|---|---|---|---|---|---|---|---|
| Low | Middle | High | Low | Middle | High | ||
| Included in GDQSa & GDQS+ metrics. Healthy food groups | |||||||
| Citrus fruits | < 24 | 24–69 | > 69 | 0 | 1 | 2 | |
| Deep orange fruits | < 25 | 25–123 | > 123 | 0 | 1 | 2 | |
| Other fruits | < 27 | 27–107 | > 107 | 0 | 1 | 2 | |
| Dark green leafy vegetables | < 13 | 13–37 | > 37 | 0 | 2 | 4 | |
| Cruciferous vegetables | < 13 | 13–36 | >36 | 0 | 0.25 | 0.5 | |
| Deep orange vegetables | < 9 | 9–45 | > 45 | 0 | 0.25 | 0.5 | |
| Other vegetables | < 23 | 23–114 | > 114 | 0 | 0.25 | 0.5 | |
| Legumes | < 9 | 9–42 | > 42 | 0 | 2 | 4 | |
| Deep orange tubers | < 12 | 12–63 | > 63 | 0 | 0.25 | 0.5 | |
| Nuts and seeds | < 7 | 7–13 | > 13 | 0 | 2 | 4 | |
| Whole grains | < 8 | 8–13 | > 13 | 0 | 1 | 2 | |
| Liquid oils | < 2 | 2–7.5 | > 7.5 | 0 | 1 | 2 | |
| Fish and shellfish | < 14 | 14–71 | > 71 | 0 | 1 | 2 | |
| Poultry and game meat | < 16 | 16–44 | >44 | 0 | 1 | 2 | |
| Low-fat dairy | < 33 | 33–132 | > 132 | 0 | 1 | 2 | |
| Eggs | < 6 | 6–32 | > 32 | 0 | 1 | 2 | |
| Included in GDQS & GDQS− metrics. Unhealthy in excessive amounts | |||||||
| High-fat dairyc (in milk equivalents) | < 35 | 35–142 | > 142–734 | 0 | 1 | 2 | |
| Red meat | < 9 | 9–46 | > 46 | 0 | 1 | 0 | |
| Included in GDQS & GDQS− metrics. Unhealthy food groups | |||||||
| Processed meat | < 9 | 9–30 | > 30 | 2 | 1 | 0 | |
| Refined grains and baked goods | < 7 | 7–33 | > 33 | 2 | 1 | 0 | |
| Sweets and ice cream | < 13 | 13–37 | >37 | 2 | 1 | 0 | |
| Sugar-sweetened beverages | < 57 | 57–180 | >180 | 2 | 1 | 0 | |
| Juice | < 36 | 36–144 | > 144 | 2 | 1 | 0 | |
| White roots and tubers | < 27 | 27–107 | >107 | 2 | 1 | 0 | |
| Purchased deep- fried foods | < 9 | 9–45 | > 45 | 2 | 1 | 0 | |
Box 8c.11 Summary of lower burden indices
- Lower-burden indices have been developed for assessment and monitoring at population level, and not for use for individuals;
- Food group diversity indicators have been developed for several demographic groups, to proxy for micronutrient density or adequacy;
- These food group diversity indicators were not designed to reflect NCD risk;
- Recently, several new lower burden indices have been developed;
- The Global Dietary Recommendations (GDR) Score is a simple proxy indicator reflecting adherence to global dietary guidance from the World Health Organization and the World Cancer Research Fund, focused on the NCD risk;
- The Global Diet Quality Score (GDQS) reflects both nutrient adequacy and NCD risk;
- Both new scores — the GDR Score and the GDQS — were developed for adults, but may be evaluated for other groups in future;
- Components for both the GDR Score and the GDQS are food groups, and both have positive/healthy and negative/unhealthy components and sub-indices;
- Neither the GDR Score nor the GDQS requires the use of food composition data for tabulation;
- The GDR Score is based on a non-quantitative food group recall data and the GDQS is based on semi-quantitative data.
8c.11 Incorporating sustainability in diet quality definitions and indices
Current food systems are now known to contribute a significant share of global greenhouse gas emissions and to contribute to land conversion, deforestation, and biodiversity loss; agriculture also accounts for the majority of global freshwater withdrawals (FAO & WHO, 2019). Recognition of this has led to efforts to define diets that are both healthy and environmentally sustainable, and to calls for integration of sustainability considerations in national food-based dietary guidelines, as noted above (Gonzalez Fischer & Garnett, 2016; Springmann et al., 2020).| Component | Macronutrient intake (possible range), g/d |
Caloric intake, kcal/d |
|---|---|---|
| Whole grainsa | ||
| Rice, wheat, corn and other | 232 (total grains 0–60% of energy) | 811 |
| Tubers or starchy vegetables | ||
| Potatoes and cassava | 50 (0–100) | 39 |
| Vegetables | ||
| All vegetables | 300 (200–600) | |
| Dark green vegetables | 100 | 23 |
| Red and orange vegetables | 100 | 30 |
| Other vegetables | 100 | 25 |
| Fruits | ||
| All fruit | 200 (100–300) | 126 |
| Dairy foods | ||
| Whole milk or derivative equivalents (e.g. cheese) | 250 (0–500) | 153 |
| Protein sources | ||
| Beef and lamb | 7 (0–14) | 15 |
| Pork | 7(0–14) | 15 |
| Chicken and other poultry | 29 (0–58) | 62 |
| Eggs | 13 (0–25) | 19 |
| Fishb | 28 (0–100) | 40 |
| Dry beans, lentils, and peasa | 50 (0–100) | 172 |
| Soy foods | 25 (0–50) | 112 |
| Peanuts | 25 (0–75) | 142 |
| Tree nuts | 25 | 149 |
| Added fats | ||
| Palm oil | 6.8 (0–6.8) | 60 |
| Unsaturated oilsc | 40 (20–80) | 354 |
| Lard or tallow | 5 (0–5) | 36 |
| Added sugars | ||
| All sweeteners | 31 (0–31) | 120 |