
McArdle, H.J.
Principles of Nutritional
Assessment:
Copper
3rd Edition, August 2024
Abstract
The role of copper in human health and well-being is considered, starting with copper metabolism, from uptake across the gut, to the liver and the incorporation into cupro-enzymes. Food sources of copper are noted, and the amount required to maintain health at different stages of the life course given. The consequences of copper deficiency are described, with data largely obtained from inherited diseases of copper metabolism and from the rare cases of copper overload; the effects of high copper are also discussed. Markers of copper status are assessed. Low serum copper levels are a marker of severe copper deficiency, but do not identify marginal copper deficiency Many factors, including infection and stress, modify serum copper levels, emphasising the unreliability of the indicator. The majority of serum copper is bound to ceruloplasmin, and parameters that affect ceruloplasmin are also discussed. Other possible markers of copper status include cuproenzymes such as Cu, Zn superoxide dismutase, cytochrome oxidase, lysyl oxidase and diamine oxidase, but they are difficult to measure, and normal ranges have not been established. When inside cells, copper is bound to small proteins called chaperones. mRNA or protein levels of these chaperones have been proposed as markers of status, with varying degrees of acceptability. Other markers of copper status, such as hair or nail copper levels, are also considered, but are not ideal and can be altered by factors other than copper status.
CITE AS:
McArdle H.J. Principles of Nutritional Assessment.
Copper. https://nutritionalassessment.org/ copper/
Email: h.mcardle@abdn.ac.uk>
Licensed under CC-BY-4.0
( PDF )
24b Copper
The adult human body contains 70–80mg of copper. Of this, approximately 25% is in the skeletal muscle, 15% in the skin, 15% in the bone marrow, 19% in the skeleton, 8.0 to 15% in the liver, and 8.0% in the brain. The liver and brain contain the highest concentrations of copper. Like iron, copper can be found in two valences, Cu+ and Cu2+, and it is this ability to gain and lose electrons that give the enzymes into which it is incorporated their function, catalyzing oxidation-reduction reactions. Examples of copper enzymes (cupro-enzymes) are given in (Table 24b.1).| Copper Enzyme | Function |
|---|---|
| Ceruloplasmin (Ferroxidase I) | Copper transport, iron mobilization, antioxidant |
| Cytochrome c oxidase |
Electron transport, terminal oxidase |
| Superoxide dismutase |
Free radical detoxication |
| Tyrosinase |
Synthesis of melanin |
| Lysyl oxidase |
Collagen and elastin cross-linking |
| Amine oxidases |
Deamination of primary amines |
| Dopamine-β- monooxygenase |
Dopamine→norepi- nephrine |
| Peptidylglycine monooxygenase |
α-Amidation of neuro peptides |
• Functions of copper
Many clinical features of copper deficiency can be explained by changes in the activities of cuproenzymes. For instance, the ferroxidases, of which there are several examples, are involved in oxidising Fe2+ to Fe3+ to facilitate iron incorporation into transferrin. Ceruloplasmin, a serum protein, was the first to be identified. A reduction in ceruloplasmin (ferroxidase I) (EC 1.16.3.1) impairs the transport of iron to the erythropoietic sites, leading to hypochromic anemia. Hephaestin is located on the basolateral membrane of gut cells (Vulpe et al., 1999). The membrane bound form of ceruloplasmin is predominantly located in the brain (Jeong and David 2003), while zyklopen is central to trans-placental transfer of iron, though it is also located in retinal cells (Chen et al., 2010).Deficiency of the cuproenzyme lysyl oxidase (EC 1.4.3.13) may be responsible for the skeletal and vascular defects reported in copper deficiency. Lysyl oxidase is essential for the normal maturation of collagen, specifically in the steps involving the formation of lysine-derived cross-links (O'Dell, 1976). The latter are required for the formation of strong, flexible connective tissues (Rucker and Murray, 1978).
Depigmentation is often associated with a deficiency of tyrosinase (EC 1.14.18.1), an enzyme involved in the production of melanin. The latter is necessary for protection against excess ultraviolet exposure. The central nervous system disturbances in copper deficiency are the result of myelinization derangements or of abnormal catecholamine levels and associated decreased activity of dopamine β monooxygenase (EC 1.14.17.1) or reduced activity of cytochrome c oxidase (EC 1.9.3.1) (Mason, 1979).
• Absorption and metabolism of copper
The major site of copper absorption is the small intestine, although some copper is also absorbed from the stomach. Absorption is inversely related to the amount of copper in the diet, decreasing the likelihood of deficiency and toxicity (Turnlund et al., 1989). For dietary intakes above 5mg/d, absorption is < 20%, whereas for intakes < 1mg/d, absorption is as high as 50% (Figure 24b.1).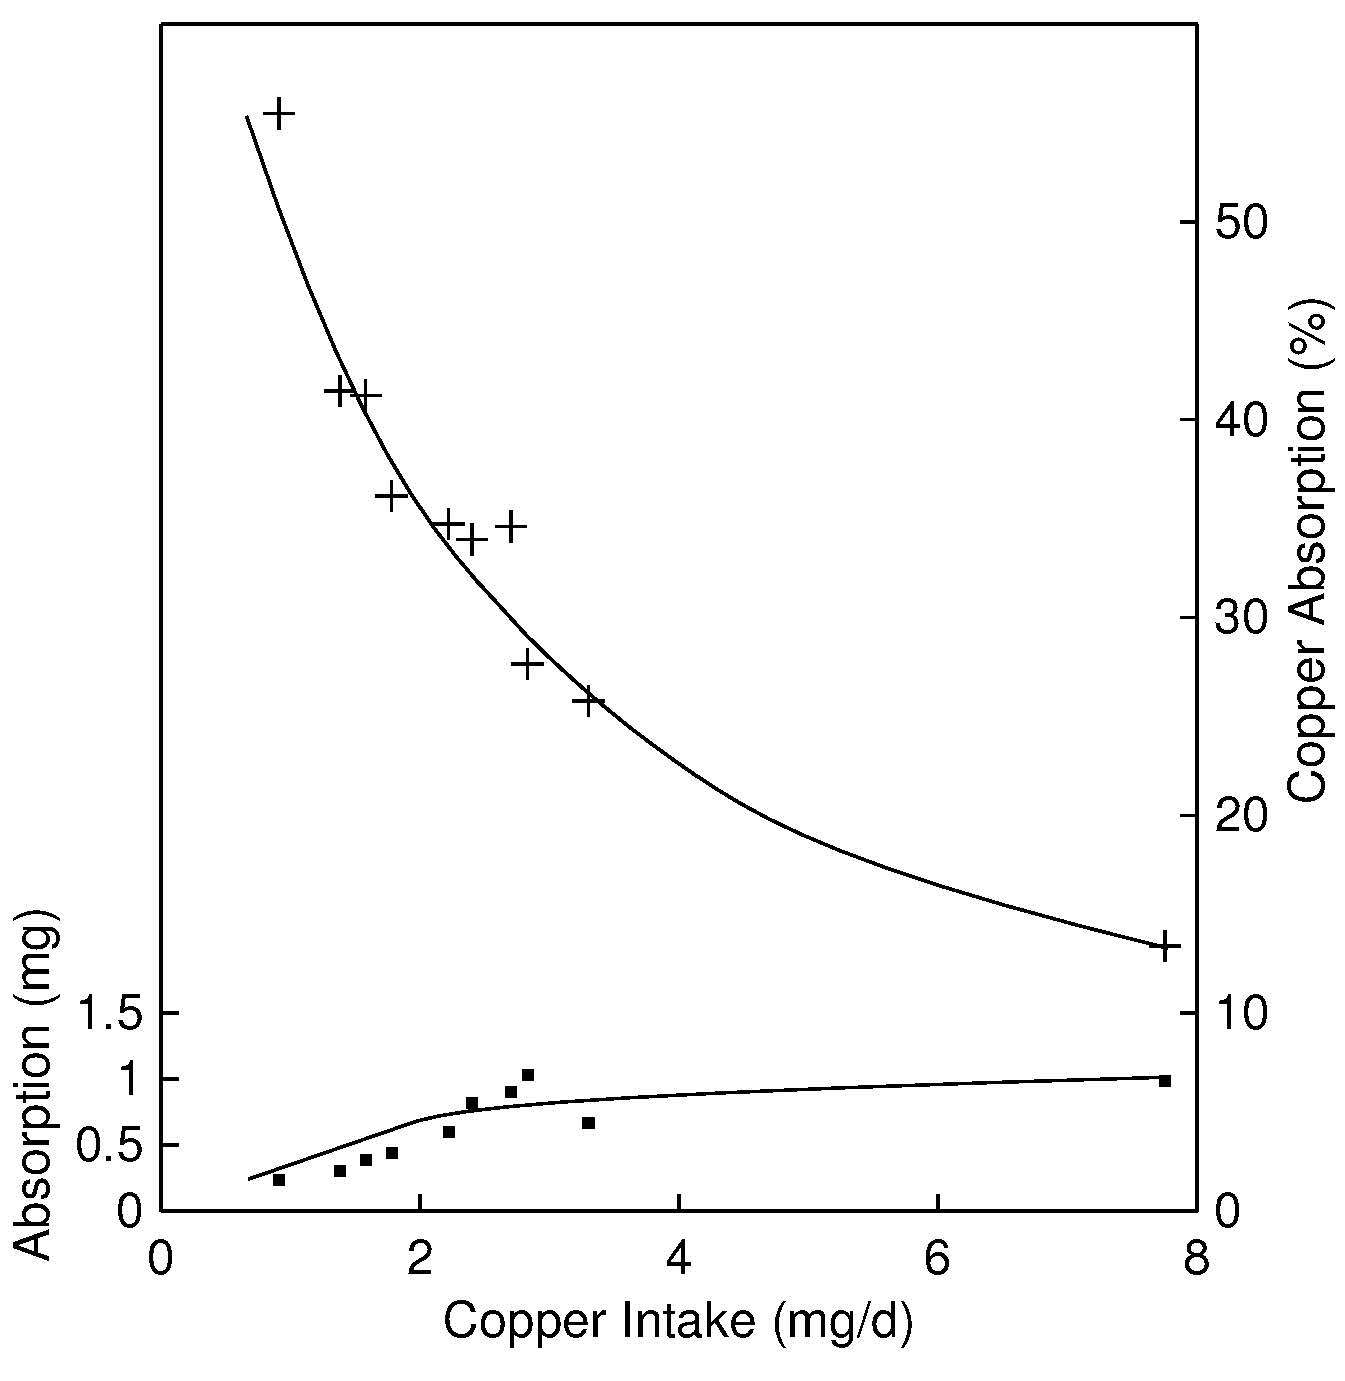
As noted above, on the apical membrane, facing the gut, copper is taken up by a carrier mediated process, involving a transporter named Ctr1 (Kuo et al., 2006). Following uptake, the Cu is transferred across the cell and excreted into the portal circulation using an energy-dependent process and a Cu-ATPase, known as ATP7A (Harris, 2000). This enzyme is deficient in Menkes disease patients, and its absence is responsible for the subsequent copper deficiency. It is mostly located in the gut, but it also plays an important role in trans-placental transport and may be involved in uptake across the blood brain barrier (Hardman et al., 2004).
Once absorbed, copper is transported via the portal blood, bound to albumin and transcuprein, mainly to the liver. In the liver, copper is incorporated into ceruloplasmin, and then distributed to other tissues. For further details, see the review by Linder et al. (1998) and Harris (2000).
At present, the mechanisms of copper regulation are only beginning to be understood. Tissue copper concentrations are maintained within a narrow range, through homeostatic mechanisms that operate at the level of intestinal absorption and biliary excretion. Of the two levels, biliary excretion is the more important. As more copper is absorbed, turnover is faster, and, hence, more copper is excreted into the gastrointestinal tract. Very little copper is excreted in the urine, and urinary losses do not help regulate copper stores. Relatively little copper is stored in the body, compared with other trace elements such as iron (Turnlund, 1998; McArdle et al. 1999).
Copper is taken into the gut cell through Ctr1. In the cell, and in fact in all other cells apart from red blood cells, copper is bound to one of a series of chaperones. The first to be identified was Atox1, followed by several others, each of which takes copper from the membrane transporter to specific target proteins (Palumaa, 2013). The copper is transported across the cell, excreted into the portal circulation through the enzyme which is defective in Menkes disease, ATP7A and transferred to the liver bound to albumin, transcuprein or as a low-molecular weight complex with histidine or other amino acids (Gambling et al., 2011).
Within the liver, Cu is stored as metallothionein, re-excreted in the bile or incorporated into ceruloplasmin. Excretion and Cp incorporation both involve a second Cu-ATPase, ATP7B. ATPB is a membrane protein, which changes location in the liver ER, depending on whether the copper being transported is excreted or incorporated into ceruloplasmin (McArdle et al.,1999).
• Copper deficiency in humans
Copper deficiency in humans is rare. It has been described in infants recovering from malnutrition (Graham and Cordano, 1969) and in premature and low-birth-weight infants fed cow's milk (al‑Rashid and Spangler, 1971; Griscom et al., 1971; Ashkenazi et al., 1973). Copper deficiency has also been reported in patients receiving prolonged total parenteral nutrition (TPN) unsupplemented with copper (Karpel and Peden, 1972; Dunlap et al., 1974; Vilter et al., 1974) and in a woman receiving a normal diet supplemented with antacids (Anonymous, 1984). Severely handicapped patients (n=60) receiving an enteral diet with only 15µg/1000kcal Cu for 12–66mo also developed copper deficiency (Higuchi et al., 1988).The earliest clinical manifestation of copper deficiency in humans is persistent neutropenia, usually followed by hypochromic microcytic anemia, scurvy-like bone changes, and osteoporosis (in infants) (Cordano et al., 1964; al-Rashid and Spangler, 1971; Karpel and Peden, 1972; Higuchi et al., 1988). The anemia probably results from defective iron mobilization and hemoglobin formation related to lower ceruloplasmin activity (Danks, 1988), or to increased susceptibility to oxidative damage (Johnson and Kramer, 1987).
Less frequent features of copper deficiency include hypopigmentation of the hair and hypotonia (low muscle tone), as well as impaired growth, an increased incidence of infections, and changes in the phagocytic capacity of the neutrophils (Uauy et al., 1998). In some experimental depletion-repletion studies, changes in blood clotting factors (Milne and Nielsen, 1996) and in markers of bone metabolism (Baker et al., 1999) have also been reported. Low copper intakes have been implicated as a risk factor in the development of cardiovascular disease (Lukaski et al., 1988; Klevay, 2000).
A few cases of adults with sickle cell disease who were receiving prolonged zinc therapy have developed hematological signs of copper deficiency (Prasad et al., 1978). Clinical features of copper deficiency, with the exception of anemia, occur in infants with Menkes kinky hair syndrome (KHS), an X-linked, recessive, hereditary disorder of copper metabolism with an intracellular defect of copper utilization (Danks et al., 1972).
Most of the reports of copper deficiency in humans have resulted from inadequate dietary intakes of copper, often associated with prolonged diarrhea, which prevents reabsorption of copper from the bile. Hence, it is not surprising that subjects with malabsorption syndromes — including tropical sprue, celiac disease, cystic fibrosis, and short-bowel syndrome resulting from intestinal resection — are at risk of copper deficiency (Rodriguez et al., 1985).
Diseases associated with chronic loss of proteins, such as nephritic syndrome and protein-losing enteropathy, may also cause copper deficiency as a result of loss of ceruloplasmin and of copper bound to albumin. High intakes of fructose and sucrose exacerbate the effects of copper deficiency, but the importance of this effect in humans is unclear (O'Dell, 1990).
• Food sources and dietary intakes
Copper is widely distributed in foods; the richest food sources are oysters, other shellfish, organ meats (e.g., liver, kidney), nuts, and dried legumes. Milk and dairy products are low in copper. The copper level in plants is not influenced by the copper content of the soil in which they grow (Institute of Medicine, 2001). Drinking water may contribute a relatively large amount of copper to the daily intake, especially if the water is slightly acidic or very soft and is supplied from copper pipes (Lönnerdal, 1996).Copper deficiency among the general population has not been described. Dietary intakes of copper for adult European populations range from 0.9 to 2.3mg/d (van Dokkum, 1995). Data are available on the copper intakes of the U.S. population based on the Continuing Survey of Food Intakes by Individuals (CSFII 1994–1996) and NHANES III (IOM, 2001) and for the U.K. population, based on the National Diet and Nutrition Surveys (Gregory et al., 1990; Gregory et al., 1995; Gregory et al., 2000; Finch et al., 1998; Whitton et al., 2011). Copper intakes of infants fed breast milk or cow's milk are often low. More recently, the European Food Safety Authority has published data on dietary intake values in the human population (EFSA Panel on Dietetic Products 2015).
The composition of mixed western diets has little effect on the bioavailability of copper in humans. Copper deficiency has been observed in some cases of excessively high intakes of iron or zinc supplements (Fischer et al., 1984; Barclay et al., 1991; Botash et al., 1992) induced by their adverse effect on copper absorption. There is some evidence that the adverse effect of high dietary iron intake on copper absorption may occur only when copper status is low or marginal (Cohen et al., 1985).
• Effect of high intakes of copper
Under normal circumstances, copper levels in the body are tightly regulated. However, several cases of accidental copper toxicity in humans have been described, arising from ingestion of copper sulfate (Chuttani et al., 1965), acidic drinks in prolonged contact with copper (Paine, 1968), or drinking water with an unusually high copper concentration (800µg/L) (Salmon and Wright, 1971). Adverse effects include nausea, gastrointestinal effects (nausea, diarrhea, cramps, abdominal pain), and, in some cases, liver damage (O'Donohue et al., 1993; Pizarro et al., 1999).Wilson disease results from defects in ATP7B, the Cu-ATPase responsible for transferring copper from the liver to the bile or to the sites of ceruloplasmin synthesis. The defect results in copper overload in the liver and the brain. Patients suffering from Wilson's disease exhibit symptoms of copper toxicity such as nausea, vomiting, diarrhea, acute hemolytic anemia, hepatic necrosis, hepatic central vein dilation, and jaundice (Zelkowitz et al., 1980). In Wilson's disease, copper accumulates in the liver because the copper in the liver cells can neither enter the bile nor participate in ceruloplasmin synthesis (Linder and Hazegh-Azam, 1996; Suzuki and Gitlin 1999). See Czlonkowska et al., 2019 for a comprehensive review. Idiopathic copper toxicosis has been described in an Austrian population and termed Tyrolean copper toxicosis (Muller et al., 1998). It is hypothesized that the disorder arises as a combination of an inherited genetic mutation and high coper intake. A similar disease has been described by Tanner and colleagues in Indian children (Tanner 1998), although the situation is probably more complex than a simple copper overload (Pankit and Bhave 2002). There is no evidence that high dietary copper intakes are a public health problem. The U.S Tolerable Upper Intake Level (UL) for copper for adults > 19y is 10mg/d. For pregnant and lactating women and adolescents 14–18y, the UL is set at 8mg/d (IOM, 2001). Currently in Europe (2020), EFSA is examining upper levels of copper to harmonise permitted pesticide levels with nutritional guidelines.
• Indices of copper status
The methods used to assess copper status in humans include static tests, as well as the measurement of the activities of certain copper enzymes. These methods are discussed below. Other approaches use categorical regression to determine the optimal levels of copper in the diet (Chambers et al., 2010). There is still no consensus on the best biomarker to use, in part, because of the efficiency of the homeostatic control that maintains tissue copper concentrations within a narrow range (Harvey and McArdle 2008; Harvey et al., 2009; Danzeisen et al., 2007). As a result, measures of copper status tend to be resistant to change, except when dietary intakes are very low or very high. Serum copper or serum ceruloplasmin are most often used to assess copper status, but the sensitivity and specificity of both these measures are poor. Hence, they should be combined with a more sensitive and specific functional measure such as cytochrome c oxidase in platelets or superoxide dismutase in erythrocytes. It is likely that in the future functional indicators, perhaps including antioxidant status, changes in immune function, and the lysyl oxidase activity in skin, will be used in conjunction with other biochemical markers.24b.1 Serum copper
There are two main forms of copper in serum; one is firmly bound to ceruloplasmin, the other is reversibly bound to serum albumin. and to amino acids and other, poorly defined components (Linder 2016). Serum also contains the two copper enzymes cytochrome c oxidase and monoamine oxidase.Serum copper concentrations are a reliable biomarker in cases of severe copper deficiency, when they are almost always low. However, they are not sensitive enough to be used as a measure of marginal copper status, as noted earlier, and do not reflect dietary intake, except when it is low. Normally, supplementation with copper does not increase serum copper because concentrations are under strict homeostatic control. Levels are only reduced after copper stores are significantly depleted. In healthy adults consuming diets adequate in copper, the lower end of the normal range for serum copper is 10µmol/L.
Experimental studies have also confirmed that serum copper is not a sensitive index of marginal copper status in adults (Reiser et al., 1985; Turnlund et al., 1989; Milne and Nielsen, 1996). In a depletion–repletion study of postmenopausal women fed a diet with only 0.57mg/d Cu for 105d, serum copper levels did not change significantly during the copper-depletion period (Figure 24b.2),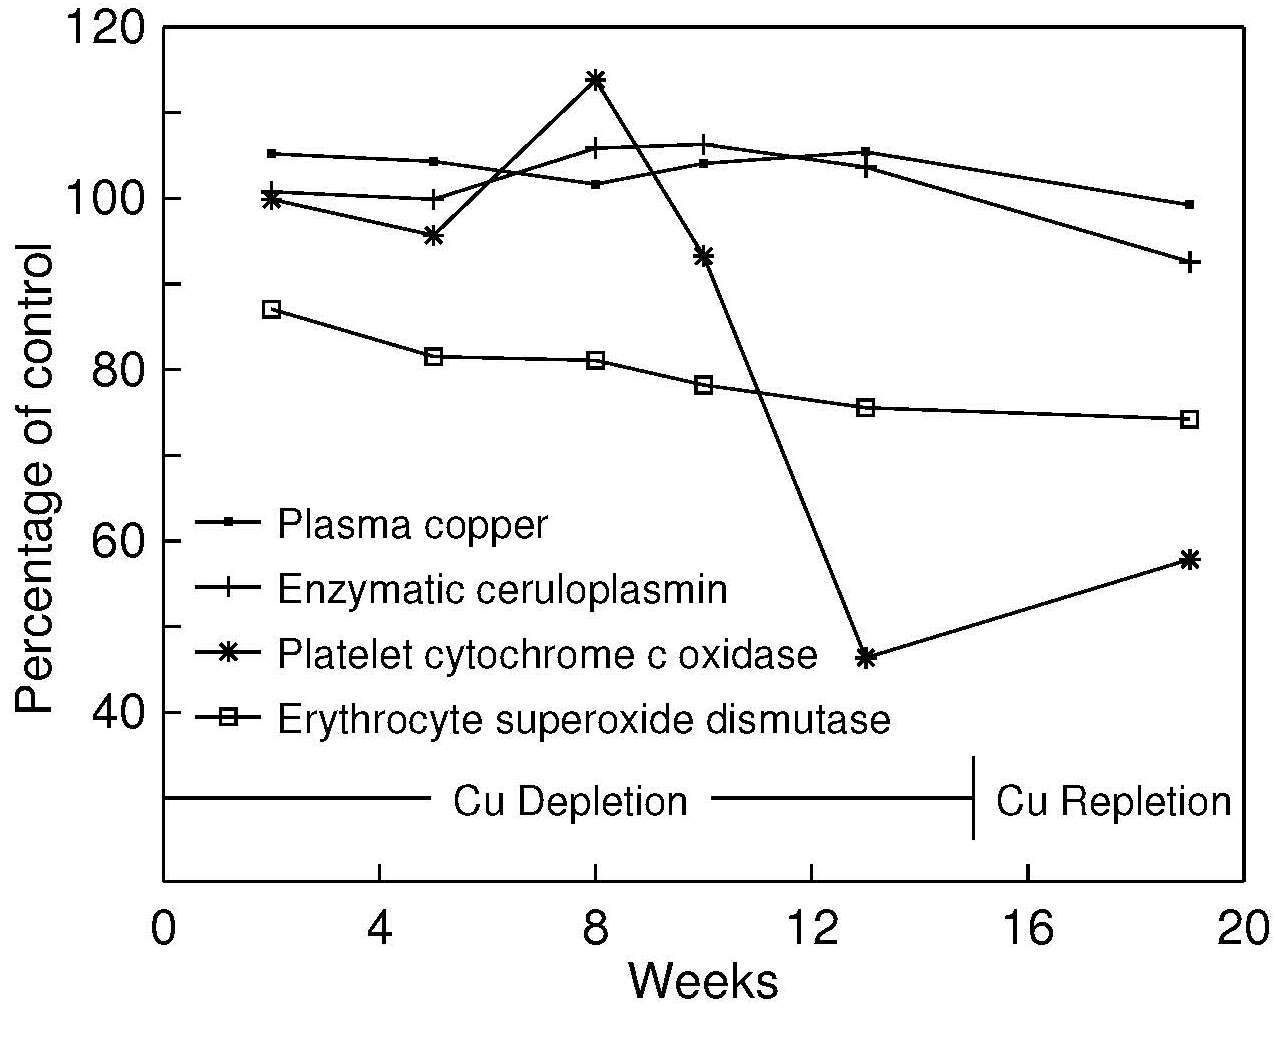
Eventually serum copper concentrations do fall. In patients receiving prolonged TPN unsupplemented with copper, falls of about 1.7µmol/L per week may occur (Solomons et al., 1976). Values < 9.5–11µmol/L have been reported in infants with copper deficiency (Cordano et al., 1964; Castillo-Duran and Uauy, 1988). Low serum copper concentrations also occur with the two genetic disorders of copper metabolism: Menkes kinky hair syndrome and Wilson's disease. In Menkes kinky hair syndrome, low serum copper concentrations arise from an intracellular defect of copper utilization, as discussed earlier (Danks et al., 1972). In Wilson's disease, the low serum copper levels are induced by defects in the hepatic storage of copper and in ceruloplasmin metabolism.
Plasma copper concentrations appear to be consistently lower than corresponding values in serum (Table 24b.2)| Subject no. | Serum (μmol/L) |
Plasma (μmol/L) |
Difference |
|---|---|---|---|
| 1 | 20.0 | 19.4 | 3% |
| 2 | 18.7 | 17.8 | 5% |
| 3 | 19.0 | 17.3 | 9% |
| 4 | 19.2 | 16.7 | 13% |
| 5 | 19.5 | 16.7 | 15% |
| 6 | 19.4 | 16.5 | 15% |
| 7 | 18.1 | 16.5 | 9% |
| 8 | 16.5 | 15.4 | 7% |
| Mean | 18.9±1.1 | 17.0±1.1 | 9±4 |
More recently, examination of the non-ceruloplasmin pool of copper, the exchangeable fraction, has suggested that this might be a good indicator of copper overload, as in diseases such as Wilson's disease (Woimant et al., 2019).
• Factors affecting serum copper
It is important to remember that most assays do not differentiate between the different forms of copper in serum and usually, changes in “serum copper" are generally caused by alterations in the concentration of ceruloplasmin. The vast majority of coper in serum is bound to ceruloplasmin. Estimates vary from 60% to 95% with the remainder being bound to a poorly characterised series of chelators (Linder 2016). As well as being a ferroxidase, involved in iron metabolism, ceruloplasmin is an acute phase protein, and concentrations can be altered by other factors than copper status. This makes interpretation of the changes described below complex. Age-related changes in serum copper concentrations are well documented. Newborn infants have low values, which rise to adult levels by 6 to 12mo of age (Salmenperä et al., 1986). In men, and in women not taking estrogen-containing preparations, serum copper levels increase with age until 55–64y, after which they decline (Table 24b.3)| Age group (years) | Men | Women |
|---|---|---|
| Serum copper (μmol/L) | ||
| 25–34 | 14.7 ± 0.6 | 14.8 ± 0.5 |
| 35–44 | 15.0 ± 0.3 | 16.7 ± 0.4 |
| 45–54 | 16.2 ± 0.4 | 17.8 ± 0.6 |
| 55–64 | 16.3 ± 0.4 | 18.8 ± 0.7 |
| 65+ | 15.3 ± 1.0 | 16.8 ± 0.5 |
| Ceruloplasmin (U/dL) | ||
| 25–34 | 9.9 ± 0.7 | 11.0 ± 0.6 |
| 35–44 | 10.8 ± 0.3 | 12.8 ± 0.4 |
| 45–54 | 11.9 ± 0.4 | 15.2 ± 1.1 |
| 55–64 | 11.8 ± 0.5 | 14.1 ± 0.8 |
| 65+ | 11.3 ± 1.2 | 12.3 ± 1.1 |
Gender influences serum copper. Levels in adult females tend to be higher than in males (Table 24b.3).
Pregnancy influences serum copper concentrations. Higher serum copper concentrations are evident after the third month of pregnancy (Halsted et al., 1968; Hambidge and Droegemueller, 1974). Whether this reflects changes in ceruloplasmin, which is part of the acute phase response, or an actual change in serum copper concentrations, is not always clear.
Estrogen-containing preparations, such as oral contraceptive agents and estrogen replacement therapy, elevate serum copper concentrations (hypercupremia) (Fischer et al., 1990; Nielsen et al., 1992). This effect is due to an estrogen-mediated rise in serum ceruloplasmin concentration No differences in copper absorption or copper balance have been reported between users and non-users of oral contraceptive agents (King et al., 1978; Crews et al., 1980). (Table 24b.4).
| Premenopausal women | ||
|---|---|---|
| Non-users of OCA | Users of OCA | |
| Serum copper (µmol/L) | 16.2±0.3 | 26.8±1.3 |
| Ceruloplasmin (U/dL) | 12.2±0.4 | 20.4±0.9 |
| Postmenopausal women | ||
| Non-users of estrogens | Users of estrogens | |
| Serum copper (µmol/L) | 18.1±0.4 | 25.9±1.2 |
| Ceruloplasmin (U/dL) | 14.5±0.7 | 19.7±1.0 |
Diurnal variation in serum copper concentrations has been noted (Cartwright, 1950; Guillard et al., 1979) with the highest levels occur in the morning (Lifschitz and Henkin, 1971; Cartwright et al., 1954; Yokoyama et al., 2000).
Regular strenuous exercise may also affect serum copper concentrations. Lukaski et al. (1983) showed values to be higher in male university athletes relative to controls.
Smoking raises serum copper concentrations (Kocyigit et al., 2001).
Infection, inflammation, and stress all elevate serum copper concentrations (Honkanen et al., 1991; Brown et al., 1993). This is a result of an increase in ceruloplasmin (an acute phase protein), effected by leukocytic endogenous mediators (Pekarek et al., 1972).
Malabsorption syndromes such as celiac disease, cystic fibrosis, and ulcerative colitis (Sternlieb and Janowitz, 1964) are often associated with low serum copper concentrations, arising from prolonged diarrhea which prevents reabsorption of copper from the bile (Rodriguez et al., 1985).
Certain disease states lead to alterations in serum copper concentrations. Levels increase in leukemia, Hodgkin's disease, various anemias, collagen disorders, hemochromatosis, and myocardial infarction and in patients with dilated cardiomyopathy (Mason, 1979; Oster, 1993). In other diseases (e.g., the nephrotic syndrome), serum copper concentrations are low (Cartwright et al., 1954).
• Interpretive criteria
| Age group (years) | n | Serum Cu (µmol/L) |
|---|---|---|
| 1 to < 2 | 15 | 21.1±4.6 |
| 2 to < 4 | 23 | 21.5±3.9 |
| 4 to < 6 | 19 | 19.4±5.3 |
| 6 to < 10 | 25 | 23.4±2.5 |
| 10 to < 14 | 21 | 21.1±3.7 |
| 14 to < 18 | 17 | 20.5±4.4 |
• Measurement of serum copper
The most widely used method for measuring serum copper is AAS, although inductively coupled mass spectrometry is becoming more common (McMillen et al., 2009). Generally, a direct technique is used, involving sample dilution with deionized water (1 part plasma or serum to 1 part deionized water) (Osheim, 1983; Smith et al., 1985): a signal-enhancing mixture such as butanol and water is also sometimes used (Meret and Henkin, 1971). In some instances, use of a “high solids” burner head may be necessary (Boling, 1966). Sometimes, the protein in the blood sample is removed using an acid such as trichloroacetic acid (Kelson and Shamberger, 1978), but this procedure may introduce volume errors during the deproteinization step and adventitious contamination from the acid and is not recommended. Analytical variation for serum copper by AAS is usually small; Gallagher et al. (1989) reported it to be < 2.6%. For very small pediatric samples, graphite furnace AAS, with Zeeman-effect background correction, may be used (Wang and Demshar, 1993). Increasingly inductively coupled plasma spectrometry (ICP) is being used because it is a multi-element technique with a detection limit and sensitivity better than flame AAS (Nixon et al., 1986). Standard reference materials for the analysis of copper in serum are available from NIST, Gaithersburg, MD.24b.2 Serum ceruloplasmin
Ceruloplasmin is the major copper-containing protein in the α2-globulin fraction of human serum. More than 60% to 95% of serum copper is associated with ceruloplasmin (Wirth and Linder, 1985), so changes in serum copper generally parallel the level of ceruloplasmin in the blood.Ceruloplasmin (EC 1.16.3.1) is a copper transport protein synthesized primarily in the liver. It is a single-chain glycoprotein with six copper atoms per molecule. A ferroxidase, it assists in iron transport by oxidizing intracellular Fe2+ to Fe3+, which can then combine with transferrin. Ceruloplasmin is also among those enzymes involved in the acute-phase reaction of inflammation and in the scavenging of oxygen radicals to protect cells against oxidative damage (Linder and Hazegh-Azam, 1996).
Ceruloplasmin levels in serum, like copper, are significantly reduced in cases of severe copper deficiency that can occur with the hereditary diseases associated with disturbances in copper metabolism: Menkes kinky hair syndrome and Wilson's disease. However, the response of ceruloplasmin to marginal copper deficiency or short-term copper depletion is variable (Milne and Nielsen, 1993; 1996). In most short-term studies of copper depletion (e.g., Milne and Nielsen, 1996) or supplementation (e.g., Kehoe et al., 2000), there has been little or no response by ceruloplasmin (Figure 24b.2).
Many of the factors that influence serum copper also affect serum ceruloplasmin and limit its usefulness as a marker of copper status, except in cases of severe copper deficiency. Furthermore, the complications and variations in measuring ceruloplasmin and copper in disorders such as Wilson's disease mean that their value as biomarkers need to be carefully assessed (Walshe, 2010).
• Factors affecting ceruloplasmin
Age and gender influence serum ceruloplasmin activity in the same manner as serum copper as shown in a Table 24b.3 (Fischer et al., 1990).Estrogen-containing preparations tend to increase the serum ceruloplasmin activity, as shown in Table 24b.4 (Fischer et al., 1990). Ceruloplasmin synthesis and secretion by the liver is regulated in the long term by estrogen, probably through stabilization of mRNA (Middleton and Linder, 1993).
Pregnancy can increase serum ceruloplasmin activity (Fischer et al., 1990) again via the effect of estrogen on ceruloplasmin synthesis. This effect may be related to the copper needs of the growing fetus during pregnancy (Lee et al., 1993).
Infection and inflammatory stress can lead to markedly elevated ceruloplasmin activity levels in serum (Brown, 1998). Ceruloplasmin is an acute-phase protein and the inflammatory hormones (interleukin-1 [IL-1], IL-6, and tissue necrosis factor) regulate its acute synthesis and secretion by the liver (Linder and Hazegh-Azam, 1996). Hence, it is not surprising that serum ceruloplasmin activity is also elevated in rheumatoid arthritis (DiSilvestro et al.,1992).
• Interpretive criteria
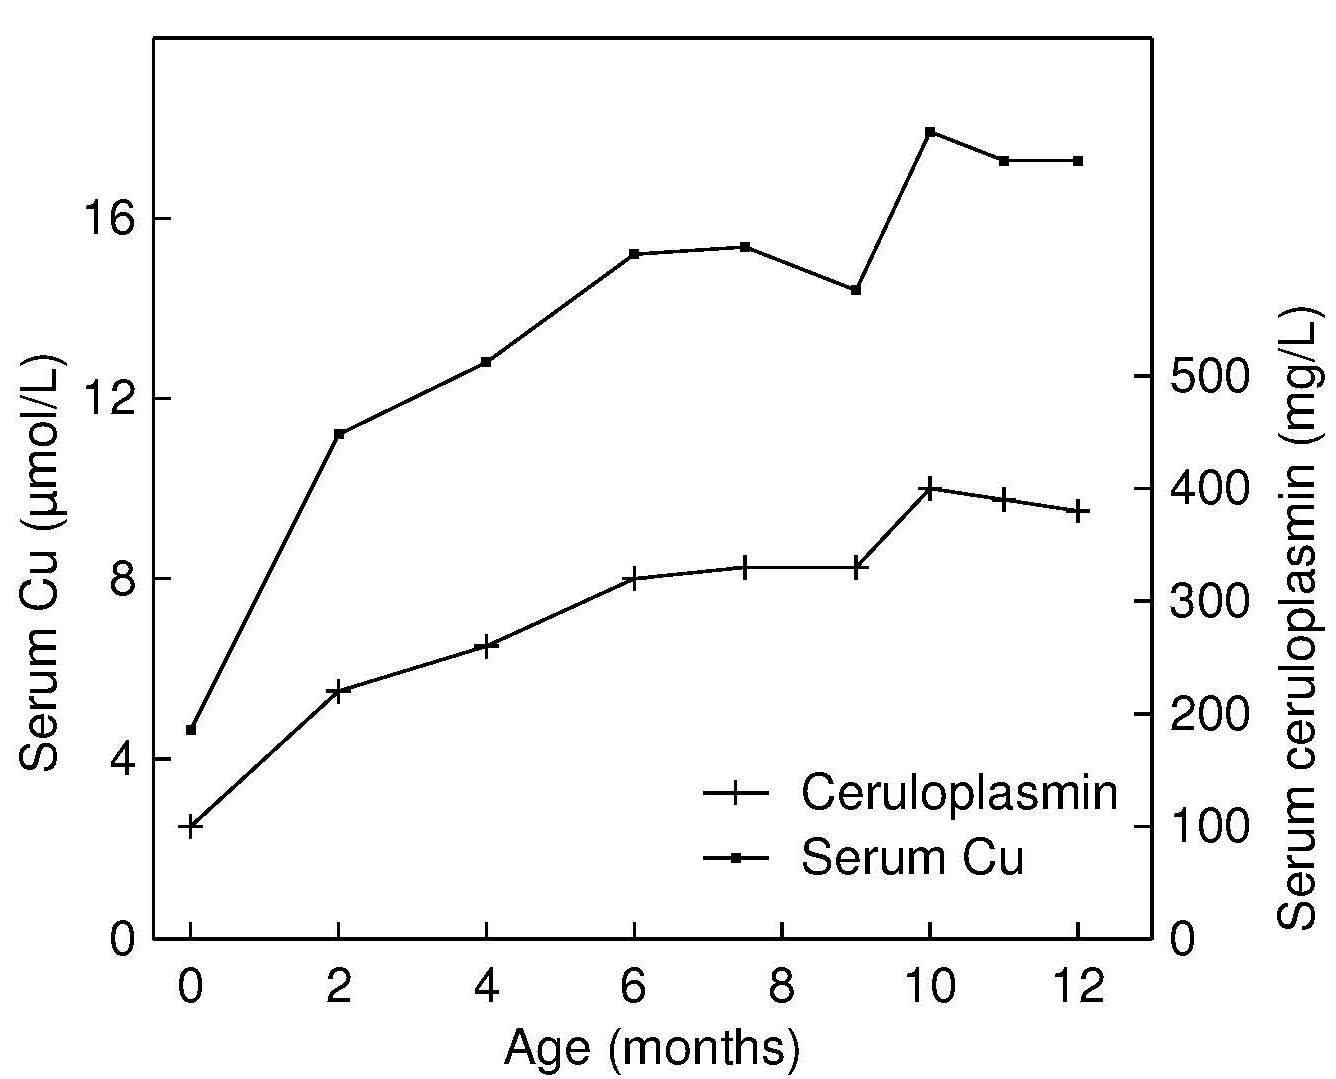
Reference data for serum ceruloplasmin are limited. Salmenperä et al. (1986) have published reference values for exclusively breastfed infants followed during the first year of life, and they are shown in Figure 24b.3. Levels increase steadily during the first year of life, paralleling the trend for serum copper. Milne (1994). suggests that a ratio of enzyme activity (ceruloplasmin oxidase activity) to ceruloplasmin protein concentration may be a useful index of copper status. The ratio has several advantages. Effects of age, sex, or hormone use are small (Table 24b.6)| Age (years) | Group | Enzyme activity (mg/L) | RID
(mg/L) | ENZ/RID |
|---|---|---|---|---|
| 20–29 | M (n = 10) F (n = 10) FOC (n = 10) | 408 503 612 | 266 330 371 | 1.56 1.53 1.71 |
| 30–39 | M (n = 10) F (n = 10) FOC (n = 11) | 416 516 744 | 296 314 525 | 1.49 1.66 1.42 |
| 40–49 | M (n = 11) F (n = 11) | 442 519 | 337 359 | 1.31 1.48 |
| 50–59 | M (n = 9) F (n = 13) FE (n = 4) | 441 516 593 | 310 370 384 | 1.43 1.44 1.57 |
| 60–69 | M (n = 8) F (n = 10) | 470 559 | 284 354 | 1.70 1.60 |
| 70+ | M (n = 7) F (n = 7) | 485 470 | 332 368 | 1.51 1.29 |
| ANOVA | Gender Decade | 0.0001 NS | 0.0002 0.03 | NS NS |
Table 24b.6 presents mean ceruloplasmin values measured both enzymatically (ENZ) and by radial immunodiffusion, and the ratio of the enzyme activity to the immunoreactive protein for males and females by age and hormone use (Milne and Johnson, 1993). Values for ceruloplasmin for the two assays were standardized to mg/L by using purified human ceruloplasmin as a standard.
• Measurement of serum ceruloplasmin
Serum ceruloplasmin can be assayed enzymatically by measuring p-phenylenediamine oxidase activity (Sunderman and Nomoto, 1970). Ceruloplasmin protein levels can be measured immunochemically by radial immunodiffusion techniques (Mancini et al., 1965; Buffone et al., 1979). Alternatively, nephelometry (Buffone et al., 1979) or immunoelectophoresis techniques (Gibbs and Walshe, 1979) and ELISA (various commercial kits are available) can be used. Some discrepancies have been reported between radial immunodiffusion and nephelometry, which may be attributed to different sources of antibodies used for the assays (Buffone et al., 1979). Analytical variation for serum ceruloplasmin performed by radial immunodiffusion ranges up to 6% (Gallagher et al., 1989) .24b.3 Erythrocyte superoxide dismutase
Approximately 60% of the copper found in erythrocytes is present in the cytosol as superoxide dismutase (Cu,Zn-SOD, EC 1.15.1.1). This enzyme, which contains both divalent copper and divalent zinc, has a molecular weight of approximately 32,500. It is important as a scavenger of the free radical O–2 that causes damage to membranes and biological structures. It catalyzes the dismutation reaction, converting the highly reactive superoxide anion O–
2, to less reactive hydrogen peroxide and oxygen:
| Measure | Time | Study (n=8) | Control (n=9) |
|---|---|---|---|
| Plasma copper (µmol/L) | Before After | 15.4±10.5 26.0±5.4 | 22.4±4.1 |
| Ceruloplasmin (mg/L) | Before After | 330±260 500±140 | 540±120 |
| SOD (U/g Hb) | Before After | 1073±312 1371±207 | 1461±451 |
O–
2 + O–
2 + 2H+ →SOD→ H2O2 + O2
Studies with both animal models and humans have shown that
the activity of erythrocyte Cu,Zn-SOD is depressed in copper
deficiency and that the activity is often, but not always,
restored during copper repletion
(Bettger et al., 1979;
Okahata et al., 1980;
Uauy et al., 1985;
Milne et al., 1990;
Milne and Nielsen, 1996).
Table 24b.7
presents data on
erythrocyte Cu,Zn-SOD activity in infants recovering from
malnutrition and receiving marginal copper intakes: levels
returned to normal after copper supplementation
(Uauy et al., 1985)
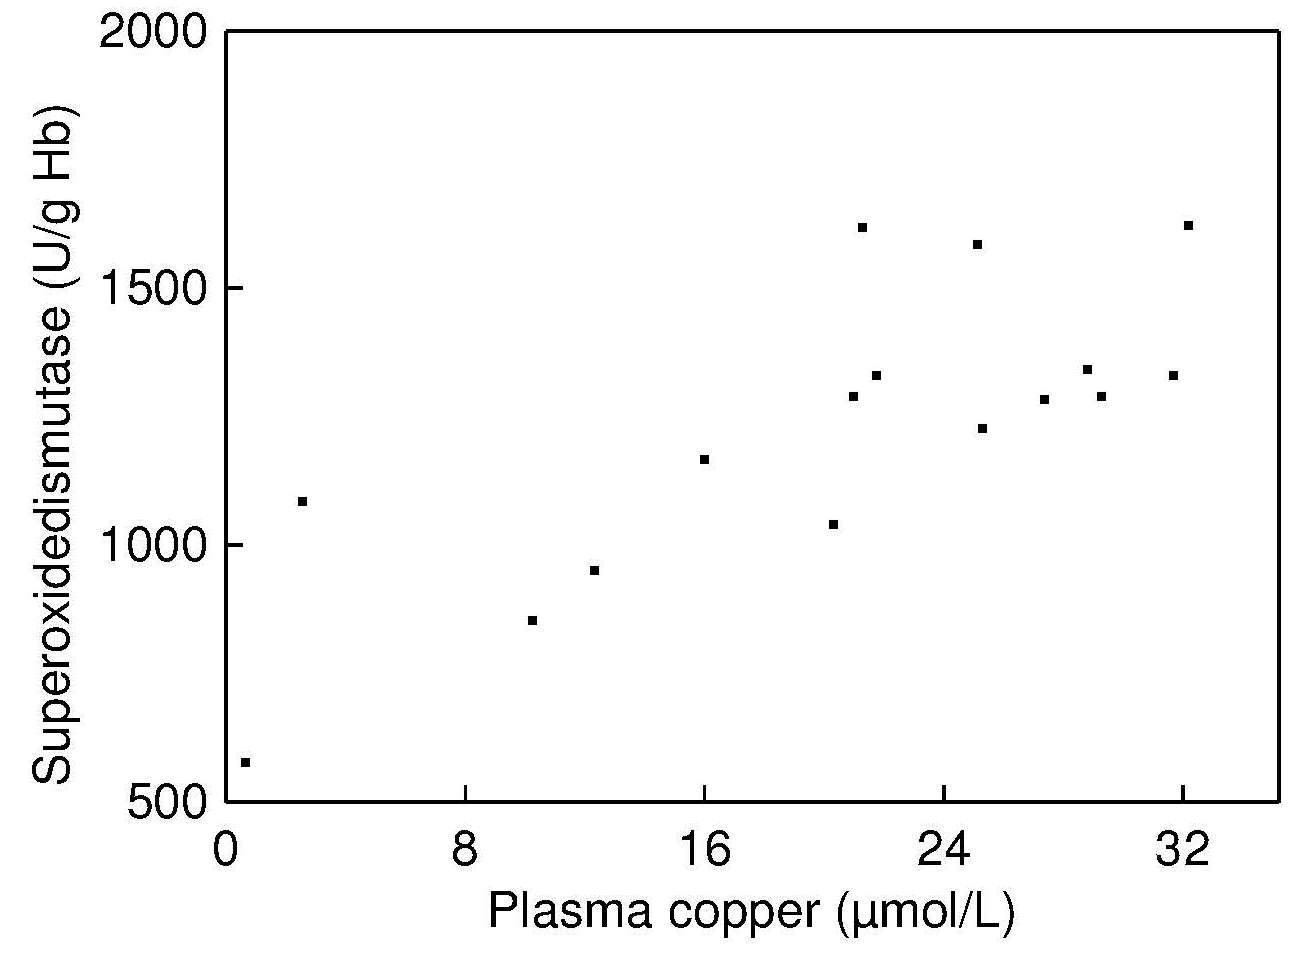
and there was a significant positive correlation
between erythrocyte Cu,ZnSOD and plasma copper
concentrations in these malnourished infants
(Figure 24b.4).
Such a correlation was not reported by Fischer et al.,
(1990).
in their study of healthy adults, probably because
the individuals studied had a copper status within the
normal range.
Positive correlations between erythrocyte Cu,Zn-SOD activity and other measures of copper status (e.g., liver cytochrome c oxidase) have also been observed in some animal studies (Bettger et al., 1979; Andrewartha and Caple, 1980).
Erythrocyte Cu,Zn-SOD activity appears to be a more sensitive index of copper depletion than serum copper or ceruloplasmin. In several experimental copper depletion-repletion studies in humans (Reiser et al., 1985; Milne and Nielsen, 1996), erythrocyte Cu,ZnSOD activity declined significantly during the depletion phase, despite no detectable decrease in serum copper or ceruloplasmin. This trend is shown in Figure 24b.2.
Nevertheless, the response of erythrocyte Cu,Zn-SOD activity to copper repletion in these experimental studies has not been consistent. Several investigators have failed to show a response by erythrocyte Cu,Zn-SOD to copper supplementation (Turnlund et al., 1990; Medeiros et al., 1991). Even in a later study by Kehoe et al. (2000) involving two different copper compounds and two levels of copper supplementation, the activity of Cu,Zn-SOD in erythrocytes (and leukocytes) did not respond to the copper supplements.
It appears that the study duration, amount of copper fed, and probably rates of cell turnover all influence the response of erythrocyte Cu,Zn-SOD activity to copper repletion (Klevay et al., 1984; Milne et al., 1988; Turnlund et al., 1990; Medeiros et al., 1991; Milne and Nielsen, 1996; Kehoe et al., 2000). In Figure 24b.2 the erythrocyte Cu,Zn-SOD activity remained at a plateau during copper repletion, perhaps associated with the rate at which new erythrocytes were being synthesized. In contrast, in the study of malnourished copper-deficient infants (Table 24b.7), erythrocyte Cu,Zn-SOD activity increased to normal levels after supplementation with copper (80µg/kg/d) for 120d. Furthermore, Cu,Zn-SOD levels increase in a variety of diseases, including pancreatitis (Ściskalska et al. 2020). In some conditions that produce oxidative stress (Lukaski et al., 1990), including alcoholism and Down's syndrome (Del Villano et al., 1980; Porstmann et al., 1990), erythrocyte Cu,Zn-SOD activity may be elevated. In rheumatoid arthritis patients, lower levels than those in controls have been observed (DiSilvestro et al., 1992). Activity levels, but not total concentration, appears to be reduced in hyperglycemic, but not normal, diabetic patients possibly by glycosylation of the active site of the enzyme (Kotake et al., 1998).
Very few investigators have used erythrocyte Cu,Zn-SOD activity as an index of copper status in community-based studies. Fischer et al. (Fischer et al., 1990) measured erythrocyte Cu,Zn-SOD activity (and serum copper and ceruloplasmin) in 384 free-living adults and examined the relationships with age, sex, estrogen use, smoking, alcohol use, and exercise, as noted earlier. Table 24b.8| Age group (years) | Men (Mean±SEM) | Women (Mean±SEM) |
|---|---|---|
| 25–34 | 82.1±6.3 | 74.7±2.9 |
| 35–44 | 76.7±1.4 | 75.3±2.7 |
| 45–54 | 76.2±2.1 | 79.0±5.7 |
| 55–64 | 77.8±1.8 | 75.5±3.9 |
| 65+ | 77.4±2.9 | 68.9±3.9 |
| Women Pre- menopausal | Non-users of oral contr. 75.1±2.1 | Users of oral contr. 77.2±6.1 |
| Women Post- menopausal | Non-users of estrogens 76.7±3.5 | Users of estrogens 73.8±7.9 |
• Interpretive criteria
Interpretive criteria for erythrocyte Cu,ZnSOD activity are limited. Laboratories should establish their own reference range for erythrocyte Cu,Zn-SOD activity. Milne and Johnson (1993) have compiled ranges for healthy adults based on the assay of Winterbourne et al. (1975). However, there were relatively small numbers of subjects in each age group. Activity levels are unaffected by age, gender, and hormone use. The U.K. National Diet and Nutrition Survey of young people aged 4–18y measured erythrocyte Cu,Zn-SOD activity; levels decreased for both boys and girls with increasing age. Mean, median, and the lower and upper 2.5 percentile values by age and sex are presented (Gregory et al., 2000). However, work is still required to confirm the utility of erythrocyte Cu,Zn-SOD activity in studies of the copper status of the general population.• Measuring erythrocyte Cu,Zn-SOD
There is no standard assay for the measurement of erythrocyte Cu,Zn-SOD activity. Several methods are available; some are very time consuming, require large samples, necessitate the removal of hemoglobin immediately after sample collection, and are subject to interferences.The assay generally involves the inhibition of oxidation-reduction reactions which are catalyzed by the superoxide anion. The latter may be generated enzymatically by, for example, xanthine plus xanthine oxidase, which, in turn, reduces cytochrome c. The reduction of cytochrome c is followed spectrophotometrically (Marklund and Marklund, 1974).
Several of these procedures are now automated. L'Abbé and Fischer (1986) developed a method for determining Cu,Zn-SOD activity that can be used with small samples. Commercial kits based on either an enzyme-linked immunosorbent assay or on a spectrophotometric assay are now available for measuring Cu,Zn-SOD activity in human serum and urine.
The analytical coefficient of variation for the erythrocyte superoxide dismutase assay when determined using an automated method ranges from 1.9% to 11.9%. The within subject variation for erythrocyte Cu,Zn-SOD activity is generally high (Gallagher et al., 1989).
24b.4 Cytochrome c oxidase
Cytochrome c oxidase (EC 1.9.3.1) is present in most tissues of living organisms and is the terminal enzyme of the electron transport chain. It reacts directly with molecular oxygen in cellular respiration; it catalyzes the electron transfer from cytochrome c to O2.Cytochrome c oxidase activity in erythrocytes, platelets, or mononuclear leukocytes (lymphocytes and monocytes) has potential as a sensitive measure of copper status. Animal studies have generally reported reduced tissue cytochrome c oxidase activity as an early sign of copper deficiency (Underwood, 1971). in association with a reduction in the respiratory capacity of mitochondria, especially in the liver, heart, and brain. Coupling of respiration to phosphorylation is generally not affected (Linder and Hazegh-Azam, 1996). In some of these animal studies, cytochrome c oxidase activity in platelets correlated very strongly with liver copper levels (r = 0.99; p < 0.0001) (Johnson et al., 1993).
Genetic defects in the activity of cytochrome c oxidase, whereby activity is only about 50% of normal, may lead to neurological, cardiac, and muscle disease in children (DiMauro et al., 1985; Tulinius et al., 1991; Van Coster et al., 1991). Reduced activity of cytochrome c oxidase has also been reported in leukocytes in infants and children with Menkes kinky hair syndrome, a genetic defect in copper metabolism (Garnica et al., 1977).
More recently, results of copper depletion-repletion studies have reported that platelet cytochrome c oxidase activity may be more sensitive than either serum copper or ceruloplasmin to changes in copper intake. In Figure 24b.2 for example, the activity of cytochrome c oxidase in platelets was significantly lower (p < 0.0001) at the end of the copper-depletion period than at baseline Milne and Nielsen, 1996); levels for many women were below the reference range for comparable healthy women (Table 24b.9)| Age (years) | Group | Platelets U/109 cells | Mononuclear blood cells U/106 cells |
|---|---|---|---|
| 20–29 | M F FOC | 2.75 (10) 2.36 (9) 2.87 (9) | 0.33 (9) 0.27 (7) 0.32 (7) |
| 30–39 | M F FOC | 2.94 (9) 2.75 (9 ) 3.87(10) | 0.31 (8) 0.36 (10) 0.39 (11) |
| 40–49 | M F | 3.52 (9) 3.08 (10 ) | 0.40 (10) 0.35 (9) |
| 50–59 | M F FE | 3.89 (9) 3.88 (12) 3.54 (3) | 0.35 (9) 0.38 (10) 0.42 (3) |
| 60–69 | M F | 4.92 (7) 4.56 (9) | 0.43 (6) 0.37 (9) |
| 70+ | M F | 4.51 (6) 3.65 (5) | 0.45 (4) 0.39 (7) |
| ANOVA | Gender Decade | NS 0.0001 | NS 0.004 |
Cytochrome c oxidase activity responded similarly in both platelets and mononuclear leukocytes to copper repletion in young women fed a copper-depleted diet. However, baseline values were not measured, so that the response of these indices to depletion cannot be evaluated (Milne et al., 1988).
The activity of cytochrome c oxidase in both platelets and mononucleated leukocytes tends to be higher in older adults, and varies markedly between subjects (Table 24b.9, Milne and Johnson, 1993). The activity in mononuclear cells, but not platelets, was affected by oral contraceptive use, and only in the 30–39y age group. Adolescents with cystic fibrosis also have lower cytochrome c oxidase activity in mononucleated leukocytes, compared with age and sex matched controls (Percival et al., 1995). The postulated mechanism relates to the alterations in chloride transport in cystic fibrosis, which, in turn, impairs copper transport (Alda and Garay, 1990).
The interaction between copper metabolism and cytochrome c oxidase activity is complex and mediated by transporters, chaperones and affected by their metals and anions. For a recent review see Cobine et al. (2021).
• Interpretive criteria
Table 24b.9 presents mean cytochrome c oxidase activity in platelets and mononuclear blood cells (lymphocytes and monocytes) by age and sex for adults 20 to > 70y. Subjects were healthy, nonpregnant, and nonsmokers and were not taking any vitamin or mineral supplements, or prescribed medications, with the exception of estrogen.• Measurement of cytochrome-c oxidase
Platelets and mononuclear cells have a shorter lifespan (≈10d) than erythrocytes (≈120d) and therefore activities in these shorter-lived cell types better reflect the metabolically active pool of endogenous copper. However, the isolation of such specific cell types is time consuming and complex, as noted in Section 15.1.3. Moreover, the enzyme cytochrome c oxidase is labile, and between subject variation is large. Hence, before the test can be used in community studies, the assay method must be rigorously standardized. An assay developed by Prohaska and Wells (1974) is often used, as are kits that measure ferrocytochrome to ferricytochrome colourimetrically.24b.5 Skin lysyl oxidase
Lysyl oxidase (EC 1.4.3.13) is another extracellular copper-containing enzyme that is essential for the normal maturation and function of collagen, specifically in the steps involving the formation of lysine-derived cross-links. The latter are required for the formation of strong, flexible connective tissue (Rucker and Murray, 1978).Copper deficiency in animals results in low lysyl oxidase activity in heart, aorta, connective tissue, lung, and skin, which is reversed with copper supplementation (O'Dell, 1976). Decreased lysyl oxidase activity may be responsible for the skeletal and cardiac abnormalities reported in copper deficiency (Kagan and Trackman, 1991). In rats, despite no differences in bone weight or femoral ash content, torsional strength of the femur was markedly reduced in copper deficiency (Jonas et al., 1993).
To date, very few experimental copper depletion-repletion studies have examined the effect of low dietary copper on the activity of skin lysyl oxidase. Results in Figure 24b.5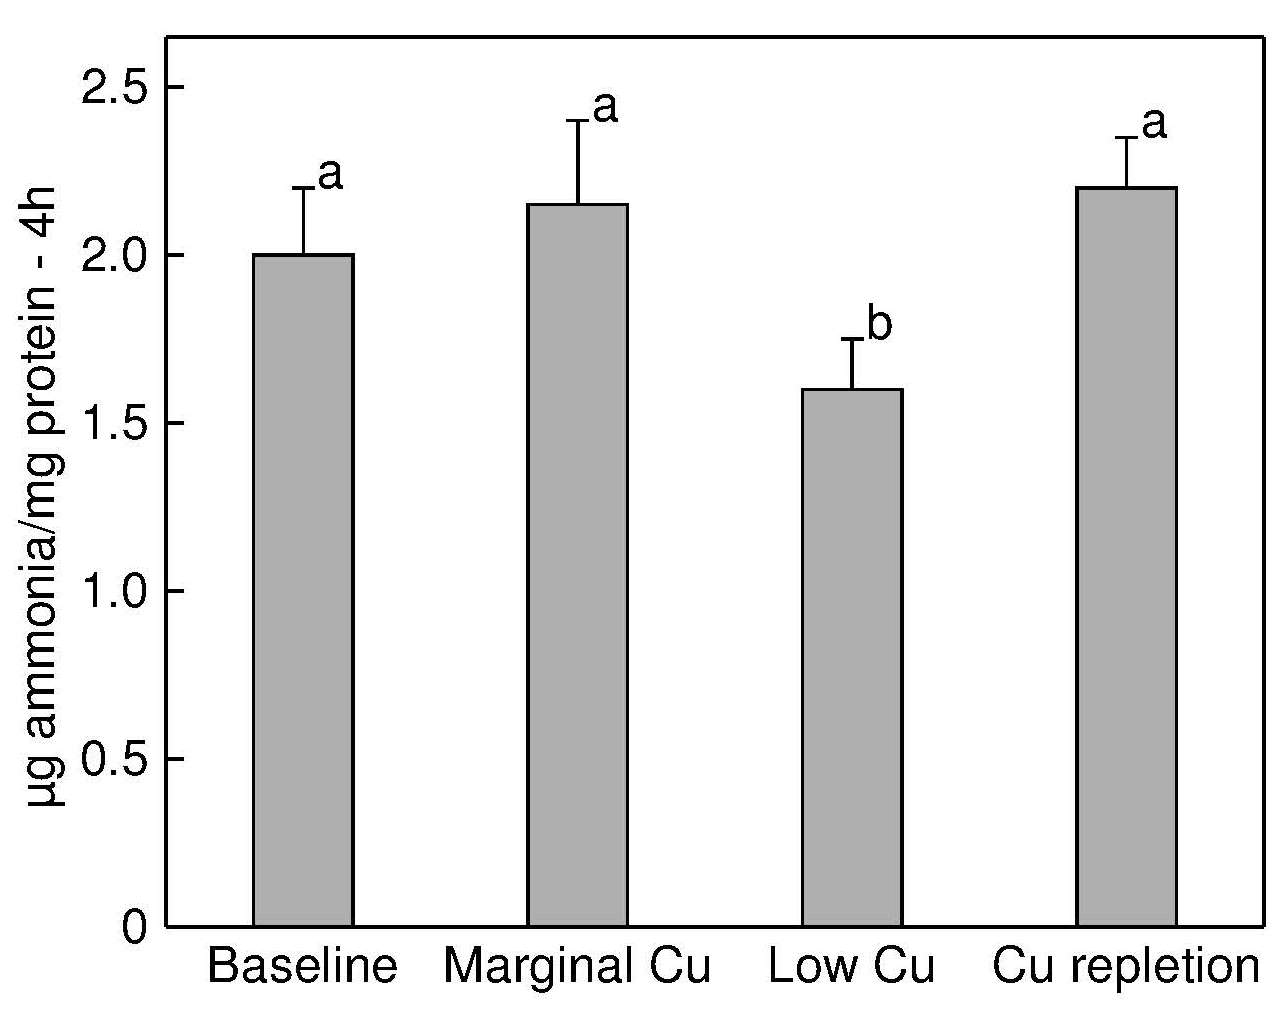
24b.6 Diamine oxidase
Diamine oxidase (EC 1.4.3.6) is a copper metalloenzyme that is responsible for the deamination of putrescine, cadaverine, and histamine (Wolvekamp and de Bruin, 1994). The activity of this enzyme has been reported to be low in some studies in rats (Kehoe et al., 2000) and renal dialysis patients with copper deficiency (DiSilvestro et al., 1997). In an experimental copper supplementation study of healthy adults, the activity of diamine oxidase in serum increased significantly during all three Cu-supplementation regimens in both males and females, as shown in (Table 24b.10,| Group (n) | Mean (SE) | Mean (SE) |
|---|---|---|
Men (7) Women (9) | 3mg CuSO4/d 0.87 (0.27) 1.64 (0.47) | Placebo 0.27 (0.17) 0.33 (0.17) |
Men (9) Women (11) | 3mg CuGC/d 1.21 (0.36 ) 1.92 (0.41) | Placebo 0.47 (0.01) 0.42 (0.23) |
Men (7) Women (10) | 6mg CuGC/d 1.55 (0.49) 2.37 (0.79) | Placebo 0.44 (0.28) 1.16 (0.32) |
The activity of this enzyme is, however, modified by conditions other than copper status, including pregnancy (Kusche et al., 1974), uremia (Tam et al., 1979), malabsorption syndromes or gastrointestinal damage (Bayless et al., 1981), and kidney dialysis (DiSilvestro et al., 1997). Further studies are needed with other population groups to establish the specificity of this enzyme to changes in copper status. A sensitive automated colorimetric assay developed by Takagi et al. (1994) can be used for the assay of serum diamine oxidase.
24b.7 Copper chaperones
Copper, once inside the cell, is bound to one of a series of chaperones, depending on its final target. The first to be identified was in yeast, and was termed ATX1 (Lin and Culotta 1995). Subsequently, several others have been identified and the best candidate for an indicator of status is CCS. In rat feeding studies, CCS in erythrocytes is responsive to both marginal and deficient diets (Bertinato et al., 2003) and also showed sensitivity to secondary copper deficeincy induced by Zn overload (Iskandar et al., 2005). Other labs confirmed these results in both rats and mice and in copper deficiency and excess (Prohaska et al., 2003). Prohaska and colleagues went one step further, suggesting the CCS:SOD1 ratio may be a more sensitive marker of status (Prohaska et al. 2003).Araya and colleagues tested the hypothesis that CCS would not be affected by inflammatory processes, unlike ceruloplasmin, by measuring CCS mRNA and CCS protein in serum in volunteers who had inflammatory responses, as demonstrated by clinical history and C-reactive protein. They showed no change in either CCS protein or mRNA, supporting the idea that CCS could be used as a copper marker, and not as an indicator of ceruloplasmin (Araya et al., 2014).
24b.8 Other indices of copper status
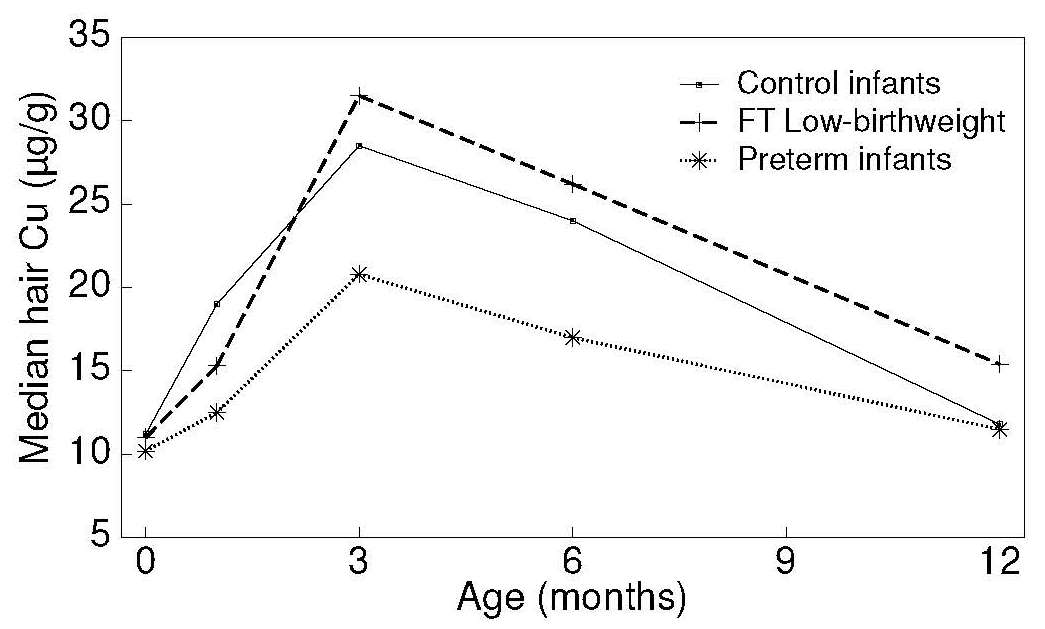
• Hair copper concentrations
Concentrations of copper in hair appear to correlate with levels in the liver (Jacob et al., 1978), heart, and kidney (Klevay, 1981). of rats. However, the validity of hair copper concentrations as a biomarker of copper status in humans is less certain. In a detailed human study of therosclerosis patients, hair copper concentrations did not correlate with the copper content of heart, muscle, liver, kidney, aorta, or rib (Aalbers and Houtman, 1985).
Many studies
have confirmed that gender (in adults), pregnancy,
lactation, prematurity, hair color, race, and age all affect
hair copper concentrations
(Petering et al., 1971;
Creason et al., 1975;
Gibson and DeWolfe, 1980;
Taylor, 1986).
The marked rise in hair (and serum) copper concentrations during
early infancy is presumably associated with the
redistribution of tissue copper which occurs at this time,
and not with changes in dietary copper intake
(Gibson and DeWolfe, 1980)
(Figure 24b.6).
Normal hair copper levels are found in two conditions in which copper accumulates in the liver — primary biliary cirrhosis (Epstein et al., 1980) and Wilson's disease (Rice and Goldstein, 1961; Gibbs and Walshe, 1965). Additionally, infants with copper deficiency, characterized clinically by neutropenia and biochemically by concentrations of serum copper and ceruloplasmin below the detection limit, did not have lower hair copper levels than age and sex-matched controls (Bradfield et al., 1980). Similarly, the copper content of the hair of children with Menkes kinky hair syndrome is normal (Danks, 1980). It appears, therefore, that hair copper cannot be used as a biomarker of copper status in humans.
• Urinary copper concentrations
Urinary copper is seldom used as an index of copper status; levels are very low in healthy subjects (10–60µg/d) because copper is efficiently reabsorbed by the renal tubules. The main excretory route for copper is the biliary system. Urinary copper concentrations do decrease in persons receiving TPN copper-deficient solutions (Solomons, 1979), conserving body copper. However, in a 13wk experimental depletion-repletion study in which men were fed three levels of dietary copper, urinary copper levels were unaffected by dietary copper levels (Turnlund et al., 1990).
• Other indices
Very limited data are available on copper concentrations in erythrocytes (Vitoux et al., 1999), and fingernails (Martin, 1964). Elevated values for erythrocyte copper have been reported in patients with the two inherited metabolic disorders associated with defects in copper metabolism (Wilson's disease and Menkes syndrome), as well as in children with Down's syndrome and cystic fibrosis. Further studies are needed to ascertain the validity of these measures of copper status.Changes in some biochemical markers of bone metabolism have been noted during experimental copper depletion-repletion (Baker et al. 1999). and also in some supplementation trials (Baker et al., 1999; Cashman et al., 2001). Results suggest that changes in both urinary pyridinoline and deoxypyridinoline (biomarkers of bone resorption) may serve as additional functional markers of copper status in populations that consume diets low in copper; details of these biomarkers of bone resorption are given in Section 23.1.5.
Peptidylglycine α-amidating monooxygenase (PAM) is a cuproenzyme required for neuropeptide synthesis. Prohaska and colleagues have suggested its enzyme activity, but not protein levels, may be modulated by mild copper deficiency (Bousquet-Moore et al. 2010; Prohaska et al. 1995). .