
Gibson RS1
and Meredith-Jones K2.
Principles of Nutritional
Assessment: Body Size
3rd Edition
July 2024
Abstract
Body size can be assessed from measurements of stature (height or length), weight, and head circumference using standardized procedures described here. When height cannot be measured, published equations based on knee height, lower leg length, arm span or demi-span are used. To interpret the measurements, indices such as weight-for-age, body-mass-index-for-age, stature-for age, weight-for stature, and body mass index (BMI, weight / height2) are constructed. To evaluate the anthropometric indices, they can be compared with appropriate growth reference data using Z‑scores or percentiles. For international use, the WHO prescriptive Child Growth Standard for children (0–5y) and the WHO growth reference for school-age children and adolescents (5–19y) should be used. Statistically determined reference limits or cutoffs can also be applied to generate “anthropometric indicators” such as stunting (stature-for-age < −2 Z‑score), wasting (weight-for-stature < −2 Z‑score), overweight (weight-for-stature > +2 Z‑score), and thinness, overweight, and obesity based on BMI-for-age < −2, > +2, and > +3 Z‑scores, respectively. Both stature-for-age at < − Z‑score and weight-for-stature at < −2 Z‑score are recommended by WHO because together they can distinguish between stunting and wasting. To assess changes in stature over time, however, use of stature-for-age difference rather than stature-for-age Z‑score is now preferred. To assess and compare the severity of malnutrition across countries, five prevalence thresholds for wasting, overweight, and stunting can be used. Recognition of an elevated mortality risk for children suffering from multiple anthropometric deficits simultaneously has led to the development of the Composite Index of Anthropometric Growth Failure (CIAF). This is used to characterize the overall burden of under‑ and ‑over-nutrition in children age < 5y so they can be identified and prioritized for intervention. Changes in body weight over time are used in both clinical and public health settings. In clinical settings lack of weight gain and weight loss are used identify pediatric undernutrition, whereas weekly weight gain is used to monitor response of children with severe acute malnutrition (SAM) to feeding programs. In public health, changes in body weight over time are often monitored because of their increased risk of mortality. New U.S guidelines for gestational weight gain are now available which have been adopted by WHO for low-income populations until specific country cutoffs are available. BMI is currently the indicator of choice for defining underweight, overweight, and obesity in adults and children. However, the limitations of BMI alone has led to the use of both BMI and waist circumference because the distribution of abdominal visceral fat has an even greater cardiometabolic risk than excess body fat per se. The BMI cutoffs used to classify adults as underweight (BMI < 18.5kg/m2), overweight (BMI > 25kg/m2), and obese (BMI > 30kg/m2) are based on adverse health risks and sometimes risk of mortality. In adults, WHO recommends the use of universal BMI cutoffs for overweight (BMI > 25kg/m2) and obesity (BMI > 30kg/m2); three classes of obesity are also defined. This classification has been adopted by several countries, including Canada and the United States, with the highest class indicative of severe obesity (i.e., BMI > 40kg/m2). Cutoffs to define grades of low BMI values indicative of underweight in adults are also recommended together with a classification to identify populations with a public health problem. Increasingly, low- and middle-income countries are impacted by both under- and over-nutrition, a condition termed the “double burden of malnutrition”. In children, no simple cutoff to define thinness, overweight, or obesity can be used because BMI has a characteristic curvilinear shape with age. Instead, countries have compiled their own ways of defining thinness, overweight, and obesity in children. Three classification schemes are described with cutoffs defined by BMI-for-age Z‑scores or percentiles based on international or national growth reference data. They include those set by the International Obesity Task Force (IOTF), the new WHO classification based on their international growth standard and growth reference, and the U.S classification based on the 2000 CDC growth charts. Clearly, there is an urgent need for consensus on BMI cutoffs for thinness, overweight, and obesity in childhood that are defined by adverse health risks. Only in this way can valid international comparisons across countries on the prevalence of thinness, overweight, and obesity in childhood be made. CITE AS: Gibson RS and Meredith-Jones K. Principles of Nutritional Assessment: Body Size. https://nutritionalassessment.org/bodysize/Email: Rosalind.Gibson@Otago.AC.NZ
Licensed under CC-BY-4.0
( PDF ).
10.0 Anthropometric assessment of body size
The most widely used anthropometric measurements of body size are those of stature (height or length) and body weight. These measurements can be made quickly and easily and, with care and training, accurately. Head circumference measurements are often taken in association with stature. Details of standardized procedures for these measurements of body size are summarized below and are given in detail in (Lohman et al., 1988). Indices such as head-circumference-for-age, weight-for-age, weight-for-stature, and stature-for-age and the ratio of weight to stature are derived from these measurements. Of these, stature-for-age and weight-for-stature have been recommended by the World Health Organization (WHO, 1995a) for use in low-income countries. In combination, they can distinguish between stunting and wasting. There is also recognition that individual children may be simultaneously wasted and stunted, which has prompted interest in identifying the combination of anthropometric deficits with the greatest risk of mortality (McDonald et al., 2013). In epidemiological studies body mass index (BMI) (wt/ht2, as kg/m2) is used to define thinness, overweight, and obesity. Increasingly, BMI is accompanied by waist circumference to provide an assessment of abdominal fat in children, adolescents, and adults. In hospital settings, anthropometric indices of body size are used primarily to identify under- or over-nutrition and obesity, and to monitor changes after a nutrition intervention.10.1 Measurements of body size
Of the various measurements of body size, head circumference is important because it is closely related to brain size. It is often used with other measurements to detect the pathological conditions associated with either an unusually large (macrocephalic) or small (microcephalic) head. Recumbent length is measured in infants and children < 2y. Height is measured in older children and adults. The interpretation of length (and weight) at birth and during later infancy requires a valid and precise estimate of gestational age: making such an estimate is often difficult in many low-income countries. To assess growth over short time periods, lower-leg length in infants and children can be measured. In adults, knee-height measurements are used to estimate height in those persons with severe spinal curvature and in those who are unable to stand. Alternatively, arm span or demi-arm span can be measured when actual height cannot be performed. Weight in infants and young children can be measured using a suspended scale and a weighing sling, or for greater precision (within 10g), a pediatric scale. For older children and adults, portable electronic digital scales with a taring capacity are recommended. Elbow breadth is used as a measure of frame size, which is relatively independent of adiposity and age (Frisancho, 1990); it should be measured with flat-bladed sliding calipers. For details on the measurement techniques and standardization protocols used in the World Health Organization (WHO) Multicenter Growth Reference Study (MGRS), the reader is referred to: the WHO Anthropometry training course available from WHO (Training Course).10.1.1 Head circumference
For the measurement of head circumference, a narrow, flexible, non-stretch tape made of fiberglass or steel (range 0–200cm, calibrated to 1mm, and about 0.7cm wide) should be used. Any head-bands or hair-pins should be removed and braids undone for the measurement. An infant or child below the age of two years should be held on the mother's lap, whereas older children can stand with the left side facing the measurer, with arms relaxed and legs apart. The child must look straight ahead so the line of vision is perpendicular to the body and the Frankfurt plane — that is, an imaginary plane which passes through the external auditory meatus (the small flap of skin on the forward edge of the ear) and over the top of the lower bone of the eye socket immediately under the eye — is horizontal. The tape is placed just above the supraorbital ridges (i.e., slightly above the eyebrows) covering the most prominent part of the frontal bulge and over the part of the occiput that gives the maximum circumference (i.e., fullest protuberance of the skull at the back of the head) Figure 10.1. Care must be taken to ensure that the tape is at the same level on each side of the head and pulled tightly to compress the hair and skin. Measurements are recorded to the last completed 1mm (de Onis et al., 2004).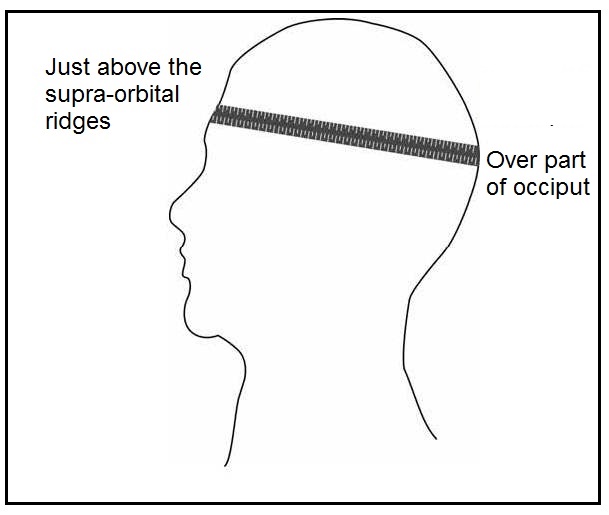
10.1.2 Gestational age
The assessment of gestational age is necessary for the interpretation of any size-for-age measurement of infants and for following the neurodevelopmental progress of preterm infants. It is also essential for the management of pregnancy and treatment of the newborn. Several strategies are available for estimating gestational age. Prenatal measures of gestational age include calculating the number of completed weeks since the beginning of the last menstrual period, prenatal ultrasonography, and clinical methods. Of these, the definition of gestational age on the basis of the last menstrual period (LMP) is most frequently used in low-income countries, but it is associated with several problems: errors may occur because of irregular menses, bleeding early in pregnancy, and incorrect recall by mothers. Macaulay et al. (2019) concluded that use of LMP for gestational age dating during early pregnancy was not sensitive in identifying late- and post-term pregnancies based on a comparison of gestational age estimates from LMP and ultrasonography. Prenatal ultrasonography during the first or second trimester is considered by many to be the gold standard for assessment of gestational age. Estimates are based on different ultrasonic measures of fetal size, with crown-rump length considered the best single parameter for the first trimester, whereas for a second- or third-trimester scan, a combination of multiple biometric parameters such as the biparietal diameter, head circumference, femoral length, and abdominal circumference are recommended (Butt & Lim, 2019). Measurements are most accurate when made early in gestation. Fetal growth charts based on ultrasound biometric measurements from multi-national prospective observational longitudinal studies have been developed by WHO (Kiserud et al., 2017) and by the INTERGROWTH-21st project (Papageorghiou et al., 2014). These fetal growth charts are based on serial ultrasound examinations during pregnancy in which women with obstetric conditions that may influence growth were excluded. The standards of the INTERGROWTH-21st project are based on populations from urban centers in eight countries in which maternal health care and the nutritional needs of women were met (Brazil, China, India, Italy, Kenya, Oman, the UK and the USA). The objective was to generate universal multi-ethnic growth standards that represent how fetuses should grow (i.e., the standards are prescriptive) when nutritional, environmental, and health constraints on growth are minimal. Fetal growth charts for estimated fetal weight and common ultrasound biometric measurements at 14–42wks of gestation are presented (Papageorghiou et al., 2014). Unfortunately, ultrasonography is not universally available, especially in low-income countries, and the quality of both the equipment used and the technical training varies. Instead, clinical methods of prenatal assessment such as measurement of symphysis-fundal height (in cm) are often used, which should correlate with the week of gestation after 20wks. International standards for symphysis-fundal height based on serial measurements from the fetal growth longitudinal study of the INTERGROWTH-21st Project are also available (Papageorghiou et al., 2016). Alternative clinical methods sometimes used include the auscultation of fetal heart tones (audible at 11–12wks), and the recording of fetal movements (Alexander & Allen, 1996; (Butt & Lim, 2019). Several scoring systems, based on external and neurological criteria, have been developed to estimate maturity — and thus gestational age — postnatally. The scoring systems initially devised by Dubowitz et al. (1970) and later modified by Ballard et al. (1979) have been widely adopted. Both methods appear to have limited accuracy at the extremes of gestation. Some (Tergestina et al., 2021) but not all (Stevenson et al., 2021) investigators advocate foot length, measured postnatally (< 48h) with calipers, as useful in resource-limited settings. To date, the measurement of gestational age postnatally where ultrasound is not possible continues to be problematic (Stevenson et al., 2021).10.1.3 Recumbent length
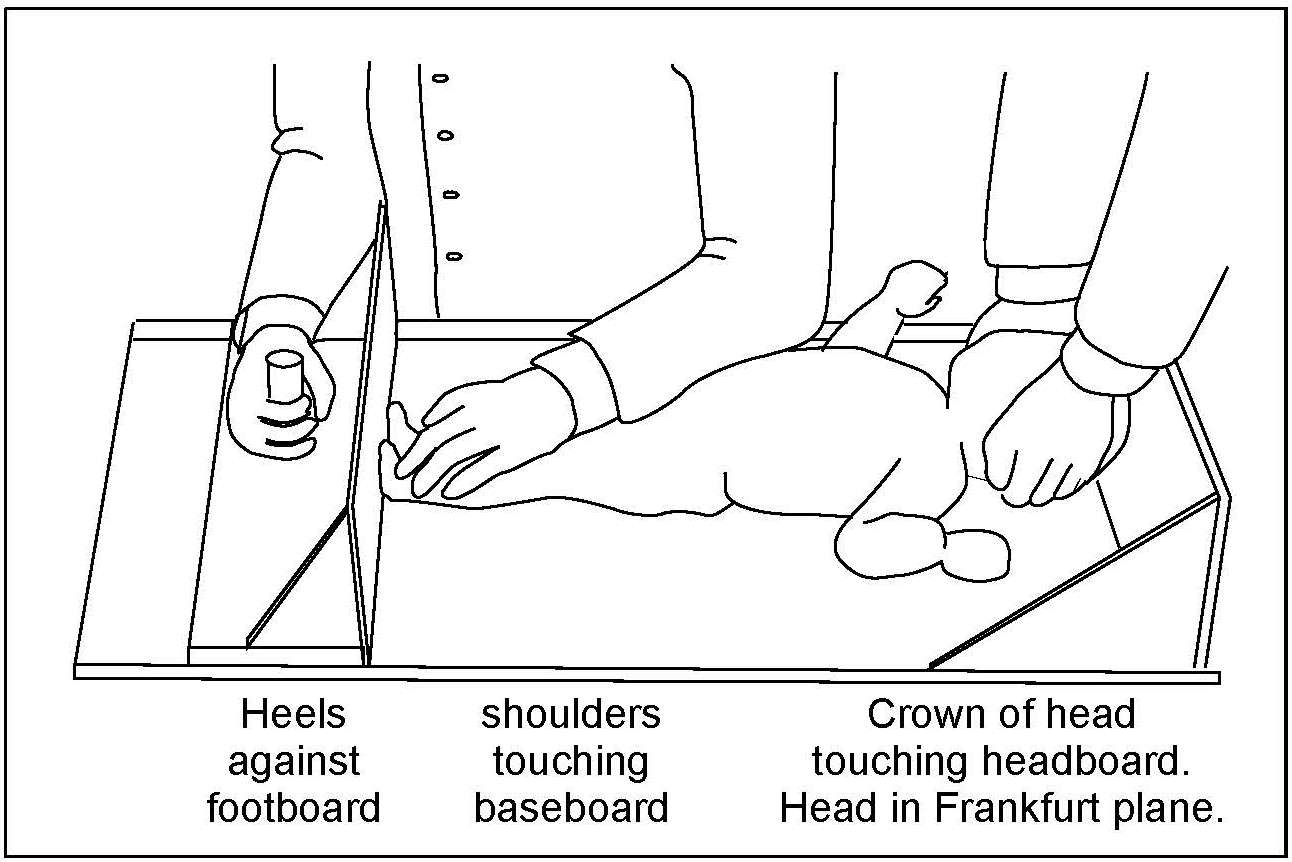
For infants and children < 2y (i.e., < 85cm), recumbent length is measured, preferably using an infantometer with a range of 30–110cm, and preferably equipped with an electronic digital reader. Recumbent length should be recorded to the nearest millimeter, or even more precisely (i.e., 0.1mm) when possible. Wooden or perspex length measuring boards (Figure 10.2)
10.1.4 Standing height
Children aged ≥ 2y and adults should be measured in the standing position, if possible (WHO, 1995a), using a free-standing stadiometer (range 65–206cm) with a fixed vertical backboard and an adjustable head piece, preferably equipped with a digital reader capable of measuring stature to 0.1mm. Clothing should be minimal when measuring height so that posture can be clearly seen. Shoes and socks should not be worn, hair ornaments should be removed, and braids undone. The subject is asked to stand straight with the head in the Frankfurt plane (Figure 10.4), knees straight, with heels together and toes apart pointing slightly outward at a 60° angle. The back of the head, shoulder blades, buttocks, and heels must be in contact with the vertical backboard of the stadiometer. Arms should be hanging loosely at the sides with palms facing the thighs. For younger subjects, it may be necessary to hold the heels to ensure they do not leave the ground.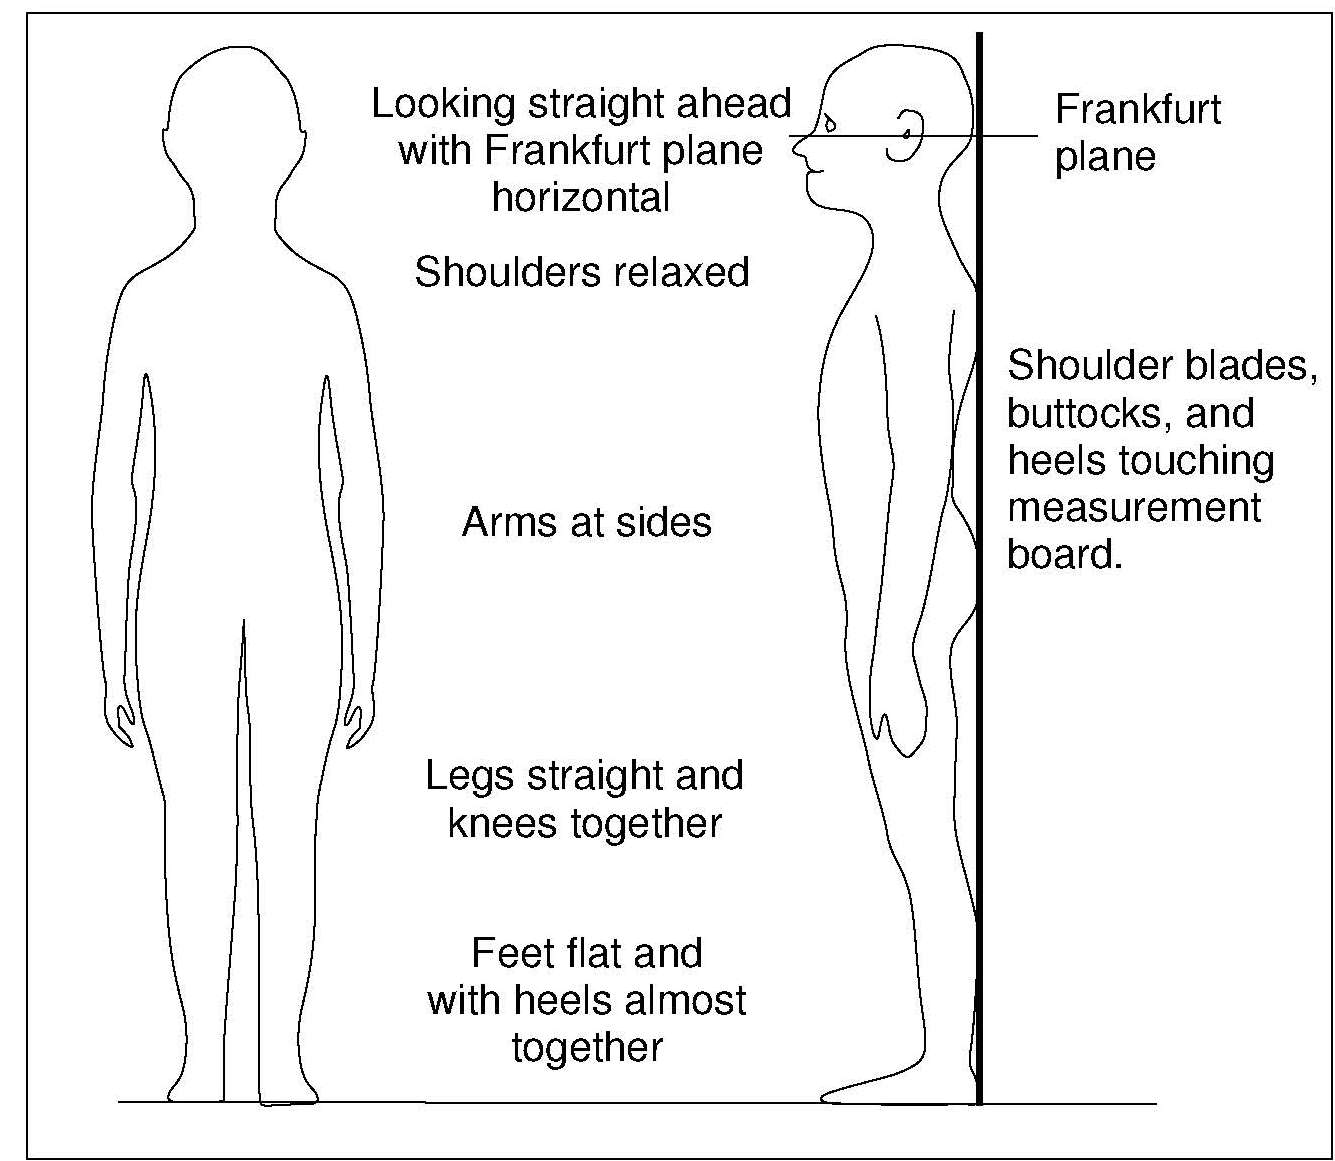
10.1.5 Knee height in children aged over 3y
The measurement of knee height in children is termed “knemometry”. The measurement is taken from the distance between the heel and knee of the right leg (i.e. the lower leg length) when the child is sitting. At least three and preferably six measurements are needed for an accurate determination of the lower leg length in a child (Hermanussen et al., 1988). A training period of several weeks is required prior to routine measuring of lower leg length in children > 3y (Ahmed et al., 1995). The main application of knemometry is for physically disabled children and in certain pediatric units specializing in growth disorders. Knemometry can also be used to assess the effect of therapeutic interventions (e.g., steroid therapy etc) on short-term growth (Gradman & Wolthers, 2010; Battin et al., 2012). By measuring knee height, growth increments in children are said to be detected more readily and over a shorter time frame than by conventional height measurements. Moreover, knee height measurements can be made with greater precision. Several factors other than growth influence the measurement of lower leg length, and hence must be controlled. For example, as diurnal variations influence the measurement, it is preferable for all measurements to be performed during the afternoon, and by one trained operator. Before the measurements, children should avoid vigorous physical activity for at least 2h, and instead, stand or walk slowly for 5–10min. To measure lower leg length in children > 3y, the children must be able to sit quietly and co-operate. The first knemometer for measuring children > 3y was developed by Valk in 1971, and modified in 1983 to improve its accuracy. Portable devices, termed a knee height measuring devices (KHMDs), are now also available for measuring changes in lower leg length in children > 3y (Cronk et al., 1989). Extremely low TEMs have been reported for the original Valk knemometer (0.09 and 0.16) (Hermanussen et al., 1988), whereas the newer, less costly portable knemometers, have a slightly poorer performance (Cronk et al., 1989). For children < 3y, a mini-knemometer can be used to measure lower leg length (Section 10.1.6). Measurement using a knemometer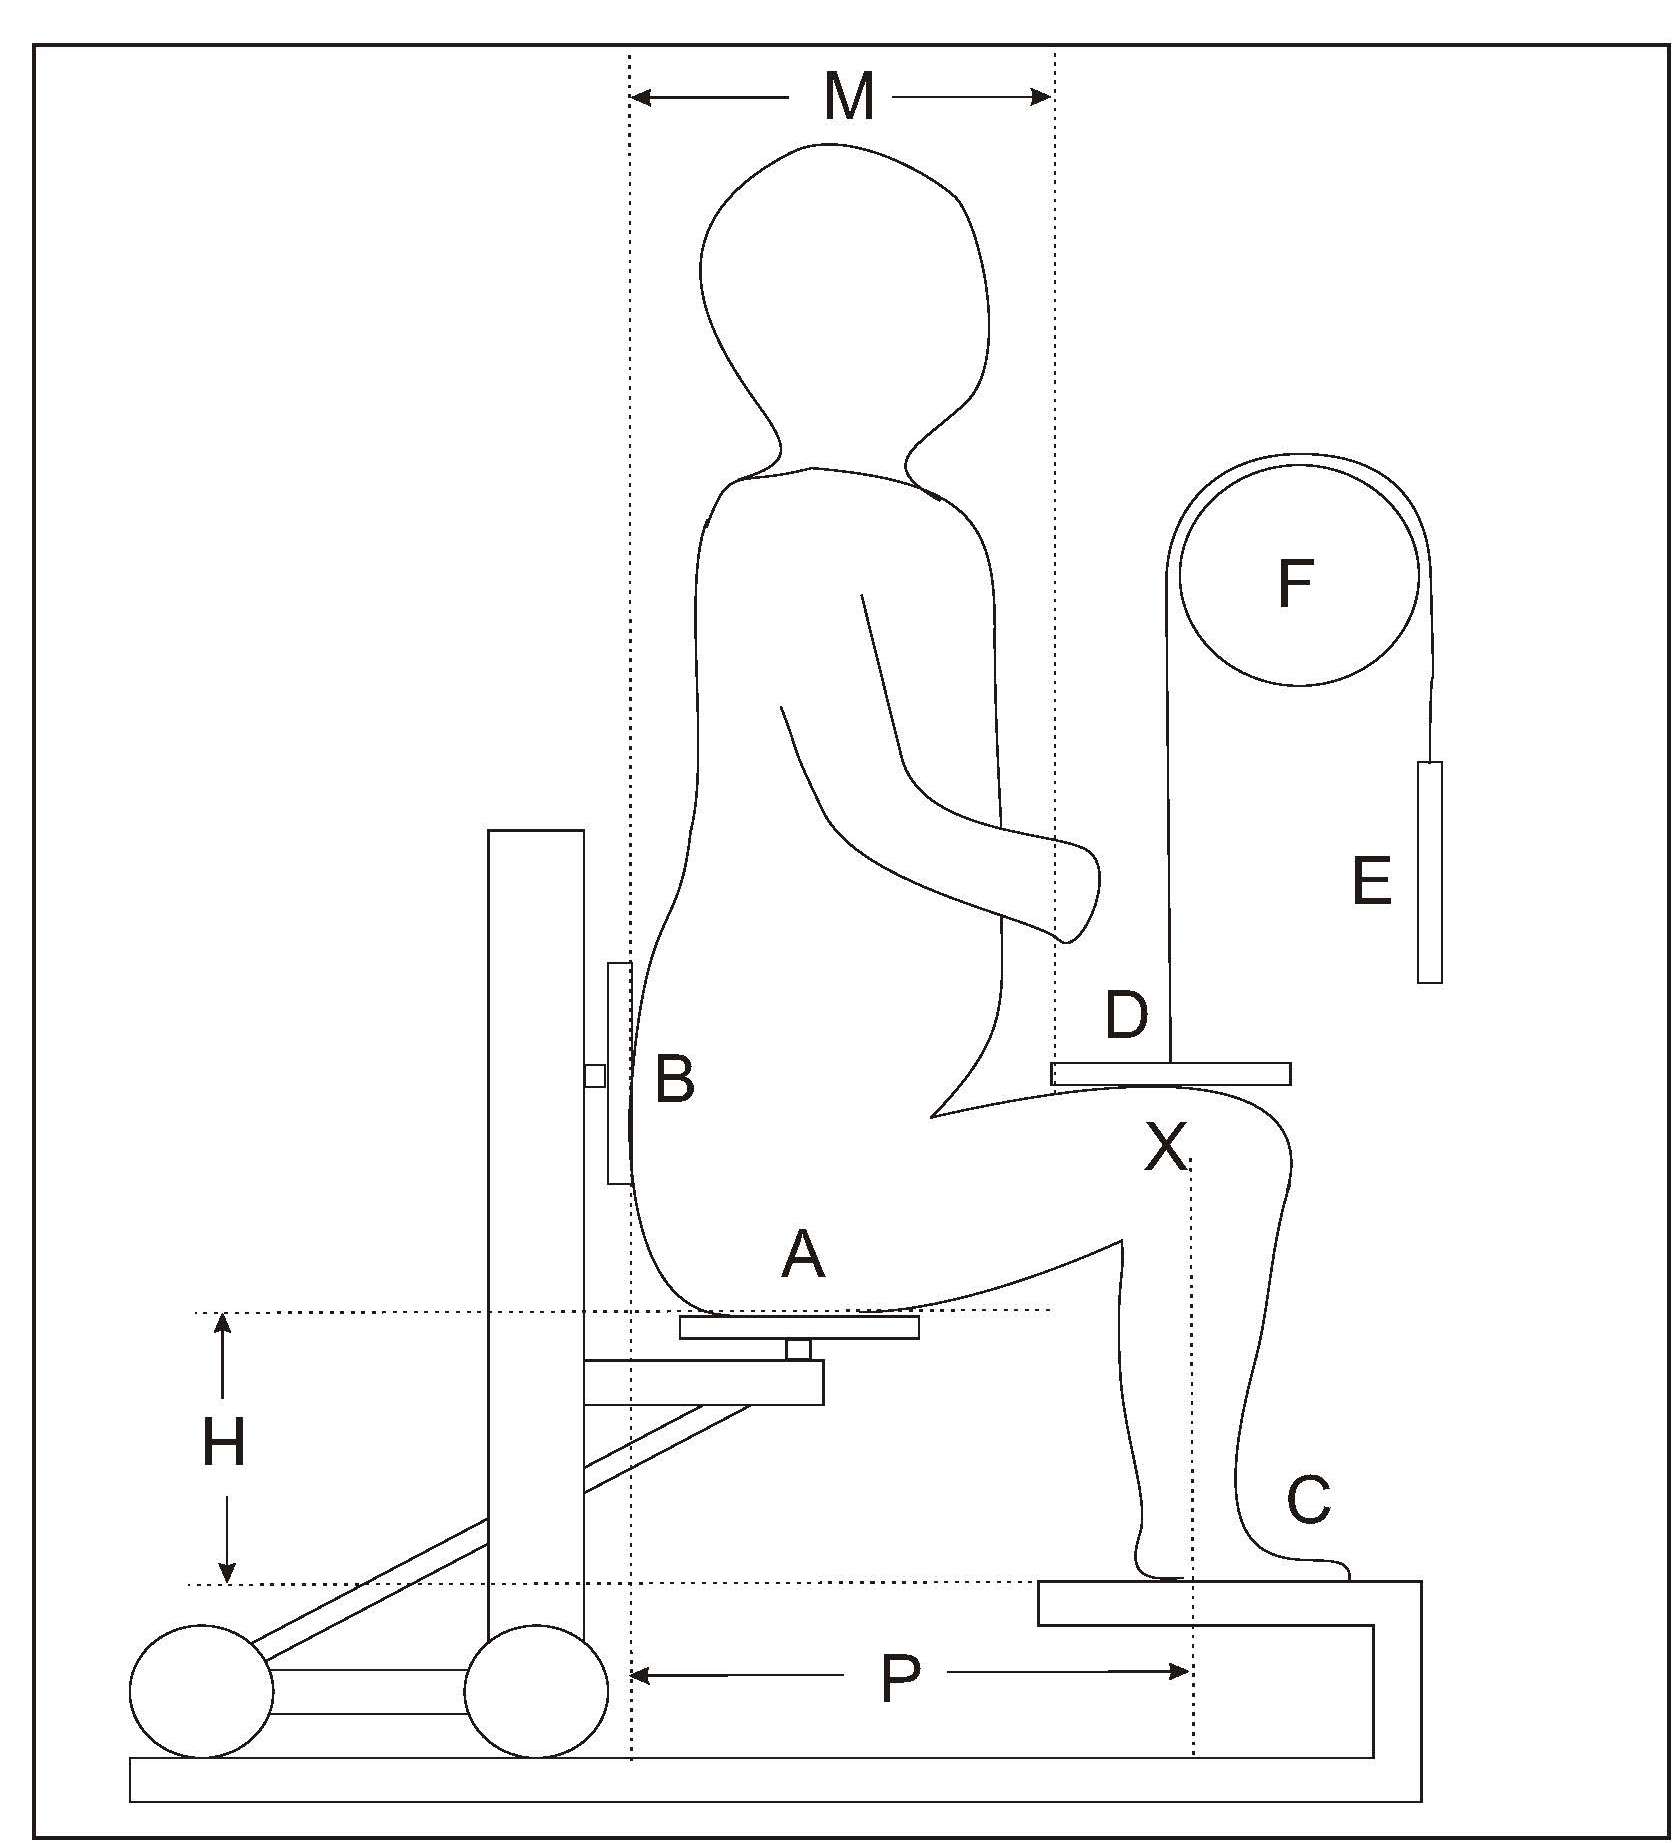
- sitting height of the child
- distance between the chair and the measuring board
- individual sitting position of the child (i.e., distance between the lateral condyle (X) and the back of the chair (B).
10.1.6 Lower leg length in infants and children aged < 3y
Lower leg length (i.e., knee-heel length) is also used to measure short term changes in linear growth over 1–8wks during infancy and early childhood. For preterm infants, normal infants, and toddlers < 3y, a hand-held electronic knemometer (Michaelsen et al., 1991), a mini-knemometer (Hermanussen & Seele, 1997), or an inexpensive vernier or electronic caliper (Skinner et al., 1997; Engström et al., 2003) can be used. Reports for the TEM for these three instruments vary across studies, in part depending on whether the readings are recorded blinded or not, and the number of consecutive readings taken (Hermanussen & Seele, 1997; Skinner et al., 1997; Engström et al., 2003). In general, the inexpensive electronic caliper has a lower TEM than the handheld mini-knemometer (Figure 10.6) and could be used when assessing lower leg length in preterm infants over a short time period (Engström et al., 2003). The mini-knemometer contains a commercially available electronic slide that discriminates intervals of 10µm. The slide is connected to two measuring arms (A, B) with metallic holders, as shown in (Figure 10.6). The infant's knee and heel are placed between the holders. Knee and heel holders of different sizes can be fitted, depending on the age of the infant.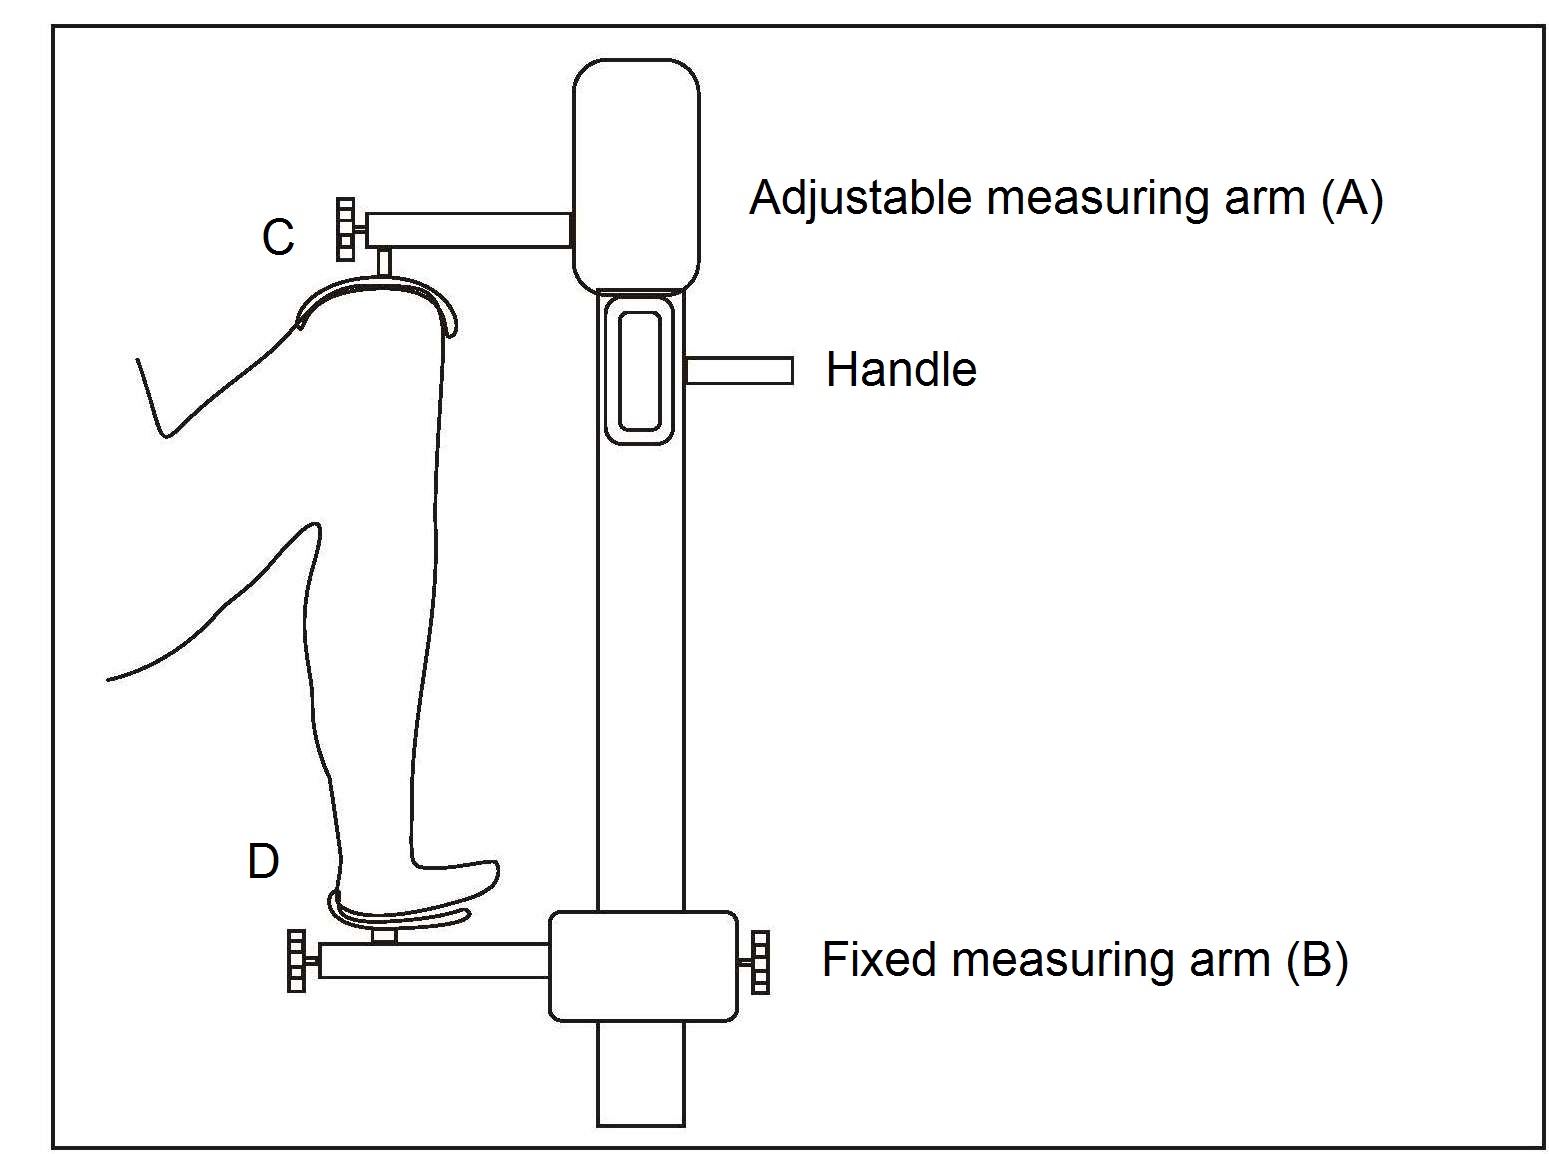
10.1.7 Knee height in adults
Knee height is highly correlated with stature and may be used to estimate height in persons with severe spinal curvature or who are unable to stand. Knee height is measured with a caliper consisting of an adjustable measuring stick with a blade attached to each end at a 90° angle. Recumbent knee height is measured on the left leg, which is bent at the knee at a 90° angle, while the subject is in a supine position (Figure 10.7). One of the blades is positioned under the heel of the left foot and the other is placed over the anterior surface of the left thigh above the condyles of the femur and just proximal to the patella. The shaft of the caliper is held parallel to the shaft of the tibia, and gentle pressure is applied to the blades of the caliper.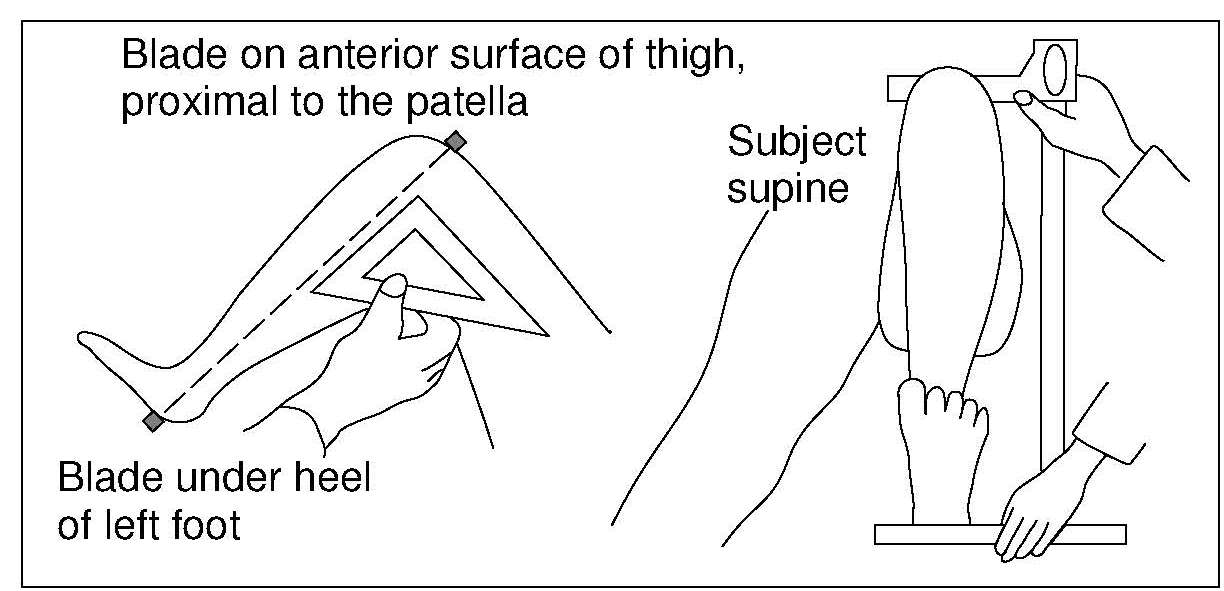
10.1.8 Arm span and demi-span
Arm span, like knee height, is also highly correlated with stature and, hence, can be used as an alternative measurement when actual height cannot be used such as in elderly persons when degenerative and osteoporotic changes give rise to spine curvature (Goswami et al., 2018). Arm span is also often used as an alternative to height for the calculation of body mass index (BMI) in older adults (Arlappa et al., 2016), and as a reliable surrogate of both recumbent length and height in healthy children, when these measurements are unobtainable or unreliable (Forman et al., 2014). The measurement of arm span is easier if carried out against a flat wall (Figure 10.8), to which is attached a fixed marker board at the zero end of a horizontal scale. Sliding on the scale is a vertical movable arm. The horizontal scale should be positioned so that it is just above the shoulders of the subject. Two examiners are needed to measure arm span: one is at the fixed end of the scale; the other positions the movable arm and takes the readings. In elderly persons, an assistant may be needed to support and maintain the arm being assessed in a 90° position (Silva de Lima et al., 2018).
10.1.9 Weight in infants and children
In field surveys, a suspended scale and a weighing sling may be used for weighing infants and children < 2y (Figure 10.9). They should be weighed naked or with the minimum of clothing. After slipping the subject into the sling, the weight is recorded as soon as the indicator on the scale has stabilized.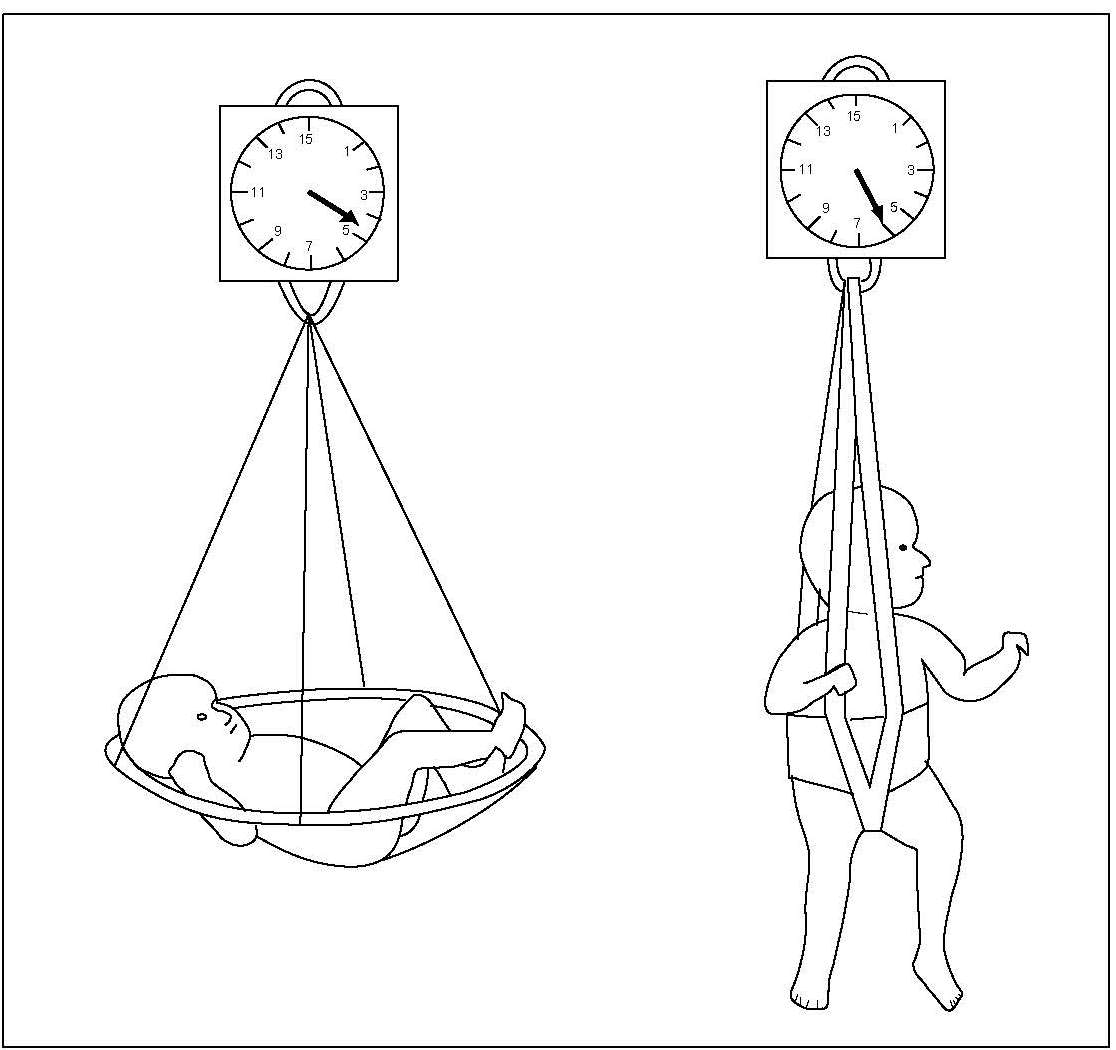
10.1.10 Weight in older children and adults
The measurement of weight in older children and adults should be done preferably after the bladder has been emptied and before a meal. A portable digital electronic weight scale, preferably one that has a taring capacity, and has been calibrated to 0.1kg, should be used (Figure 10.10B).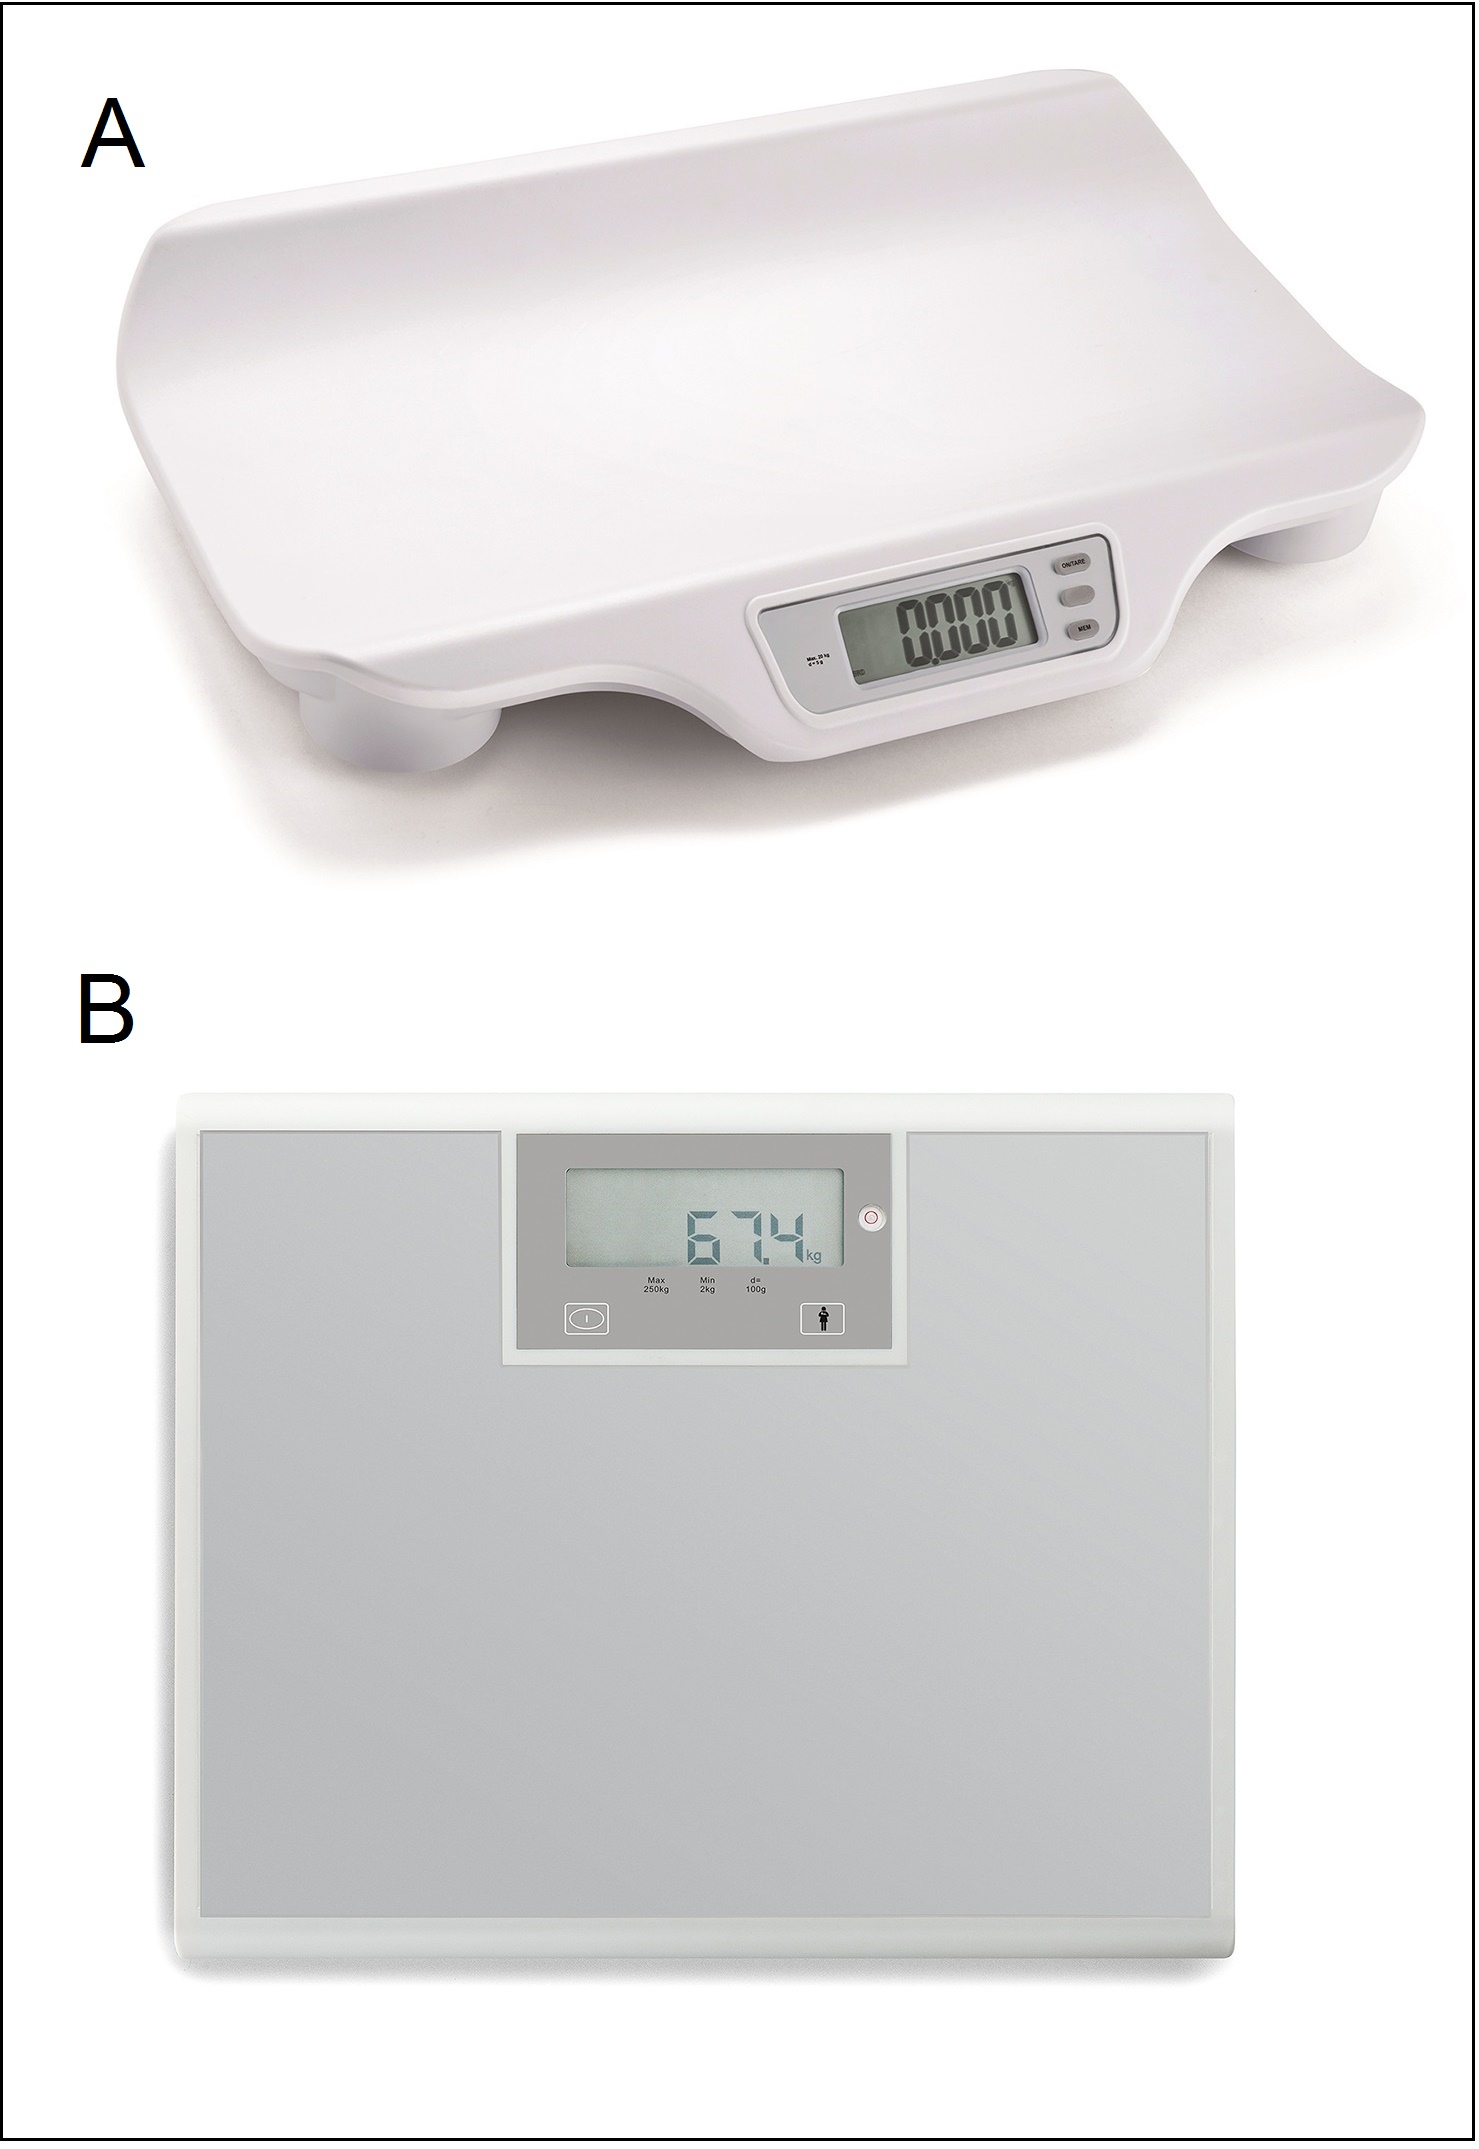
10.1.11 Elbow breadth
Elbow breadth is a good measure of skeletal dimensions and, hence, frame size. The measure is less affected by adiposity than many other anthropometric dimensions and is highly associated with lean body mass and muscle size (Frisancho, 1990).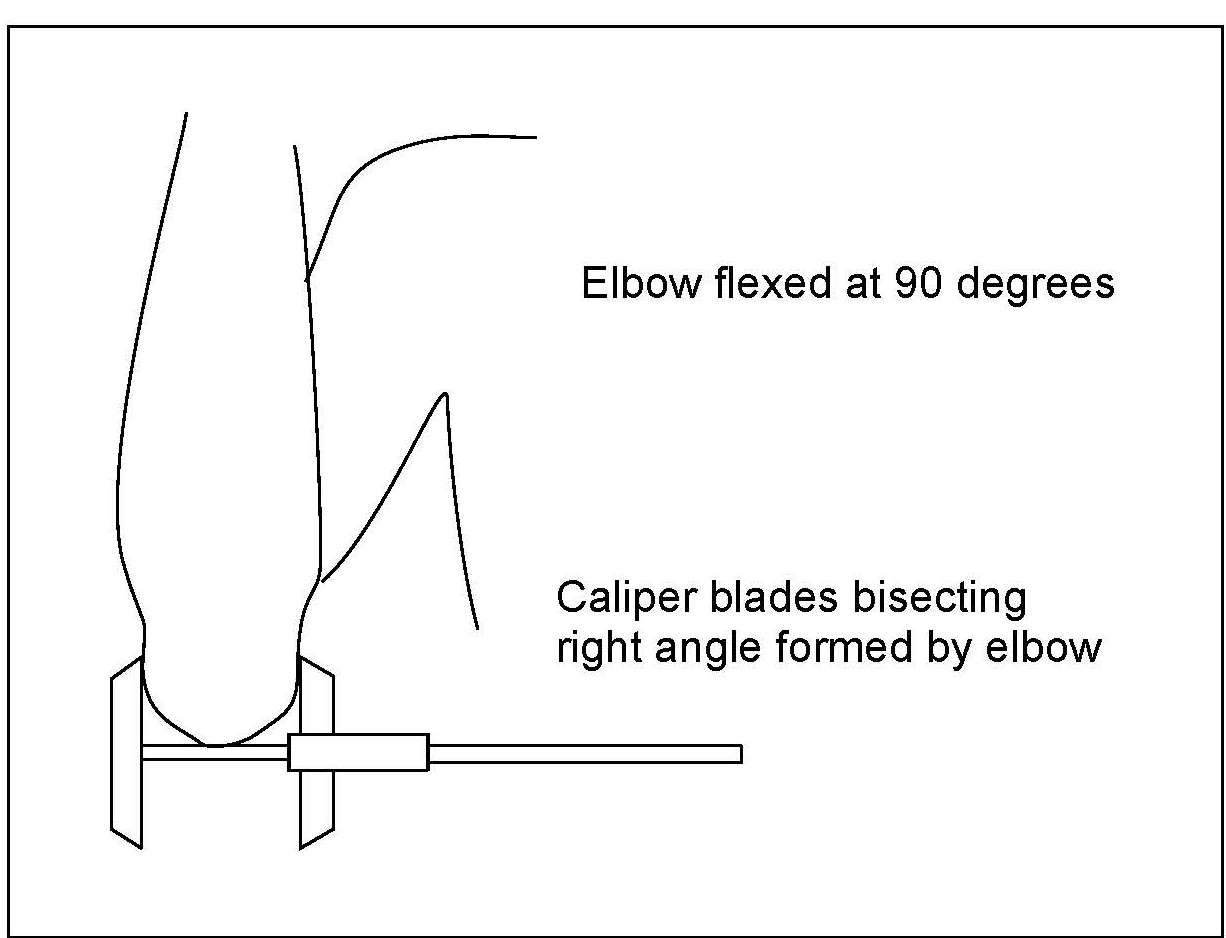
10.2 Growth indices, indicators, and recommended growth reference data
The correct interpretation and grouping of anthropometric measurements require the use of anthropometric indices (WHO, 1995a). They are usually calculated from two or more raw anthropometric measurements. In the simplest case the indices are numerical ratios such as wt/ht2 (kg/m2). Combinations such as weight-for-age, length / height-for-age (i.e., stature-for-age), and weight-for-stature are more complex. These latter growth indices are not ratios and, to avoid confusion with numerical ratios, should not be written as “wt/age”, “ht/age”, and “wt/height”. Anthropometric indices are often evaluated by comparison with the distribution of appropriate reference data using standard deviation scores (Z‑scores) or percentiles. From this, the number and proportion of individuals (as %) with anthropometric indices below or above a predetermined reference limit or cutoff are often calculated. A commonly used statistically defined reference limit for the three main growth indices is a Z‑score of −2 (i.e., 2SD below the WHO growth reference median). When used in this way, the index and its associated reference limit become an “indicator”. Growth indicators are often used for public health or socio-medical decision making at the population level. They are also used in clinical settings to identify individuals at risk of malnutrition. Examples of frequently used anthropometric growth indicators and their corresponding application are shown in Table 10.1.| Anthropometric indicator | Application |
|---|---|
| Proportion of children (of defined
age and sex) with WHZ < −3 | Prevalence of severe wasting |
| Proportion of children (of defined
age and sex) with WHZ < −2 | Prevalence of wasting |
| Proportion of children (of defined
age and sex) with WHZ > +2 | Prevalence of overweight |
| Proportion of children (of defined age and sex) with HAZ < −2 | Prevalence of stunting |
| Proportion of children (of defined age and sex) with WAZ < −2 | Prevalence of underweight |
| Proportion of children (of defined age and sex) with BMIZ +1 to +2 | Prevalence of “at risk of over- weight”(for those 0–5y) |
| Proportion of children (of defined age and sex) with BMIZ > +2 | Prevalence of overweight
(for those aged 0–5y) |
| Proportion of children (of defined age and sex) with BMIZ > +3 | Prevalence of obesity
(for those aged 0–5y) |
Box 10.1. INTERGROWTH-21st international standards for
monitoring growth and development from early pregnancy to 2y.
Of the indicators listed in
Table 10.1,
three are also included
as components of the six Global Nutrition Targets for 2030 set by
WHO/UNICEF and shown in Box 10.2.
- Fetal growth standards based on serial ultrasound measurements: Papageorghio et al. (2014).
- Estimated fetal weight standards: Stirnemann et al. (2017).
- Fetal growth velocity standards from the Fetal Growth longitudinal Study: Ohuma et al. (2021).
- Gestational weight gain standards based on women enrolled in Fetal Growth longitudinal study: Ismail et al. (2016).
- Newborn weight, length, and head circumference by gestational age and sex: Villar et al. (2014).
- Postnatal growth standards for preterm infants: Villar et al. (2015).
Box 10.2 Global nutrition targets for 2030
Policy briefs provide details of the extensions of
each of the 2025 Global Nutrition
Targets. WHO has also developed a web-based tracking tool to
assist countries to set national targets and chart progress for
achieving the six global targets (See Section 10.2.6).
Additional factors that must be considered when selecting an index
or combination of indices to evaluate growth include the
availability of accurate measuring equipment, the training of
examiners to collect accurate information and to interpret the
results correctly, and the time required to take the measurements.
Finally, often overlooked are the costs of not identifying
undernourished children or incorrectly identifying adequately
nourished children as undernourished
(Gorstein et al., 1994).
Details of the growth indices, the indicators derived from them and
their associated applications, together with their advantages and
limitations, are discussed below. Information on the available interpretive criteria for each growth index is also included.
.
- Stunting. Target: 50% reduction in the number of children under 5 who are stunted.
- Anemia. Target: 50% reduction of anemia in women of reproductive age.
- Low birthweight. Target: 30% reduction in low birthweight.
- Childhood overweight. Target: Reduce and maintain childhood overweight to less than 3%.
- Breastfeeding. Target: Increase the rate of breastfeeding in the first 6 months up to at least 70%.
- Wasting. Target: Reduce and maintain childhood wasting to less than 3%.
10.2.1 Head circumference-for-age
Intrauterine growth retardation, or chronic malnutrition during the first few months of life, may hinder brain development and result in an abnormally low head circumference. Hence, head circumference is a widely used proxy of neural growth and brain size. When brain size is outside of normal values, it is an important risk factor for cognitive and motor delay. Head circumference-for-age can be used as an index of chronic malnutrition for children < 2y but is not sensitive to less extreme malnutrition (Yarbrough et al., 1974). Beyond age 2y, growth in head circumference is slow and its measurement is no longer useful, so an indicator based on head circumference-for-age is not included in Table 10.1 (Harris, 2015). Certain non-nutritional factors, including some diseases and pathological conditions (e.g., microcephaly), genetic variation, and cultural practices such as binding of the head during infancy, as well as a difficult or forceps-assisted delivery at birth, may also influence head circumference. Interpretive criteria Microcephaly in an infant is defined as a measurement of head circumference that is more than 2SD below the mean of an age- and sex-appropriate growth chart, whereas in severe microcephaly, head circumference is more than 3SD below the mean (Harris, 2015). For international use, the WHO Child Growth Standards that include head circumference by age and sex from birth to 13wks, birth to 2y, and birth to 5y are recommended (Growth Standards). These standards, unlike the INTERGROWTH-21st standards described below, only include term newborn infants. Papageorghiou et al. (2014) have produced international standards for fetal growth in which head circumference was measured using ultrasound from 14wks to 42wks gestation. The 3rd, 5th, 10th, 50th, 90th, 95th, and 97th smoothed percentile curves for fetal head circumference are available. International standards for newborn head circumference by gestational age (33–42wks) and sex are also available from the INTERGROWTH-21st Project. Pregnancies of all women who met strict eligibility criteria for a population at low risk of impaired fetal growth were selected and followed prospectively. Gestational age was estimated using ultrasound. Hence, these multi-ethnic growth standards represent how fetuses should grow (i.e., the standards are prescriptive) and can be used to diagnose fetal growth restrictions world-wide and allow comparisons of newborn size across multi-ethnic populations (Villar et al., 2014). Free software is available through the INTERGROWTH-21st Project website to calculate Z‑scores and centiles.10.2.2 Weight-for-age
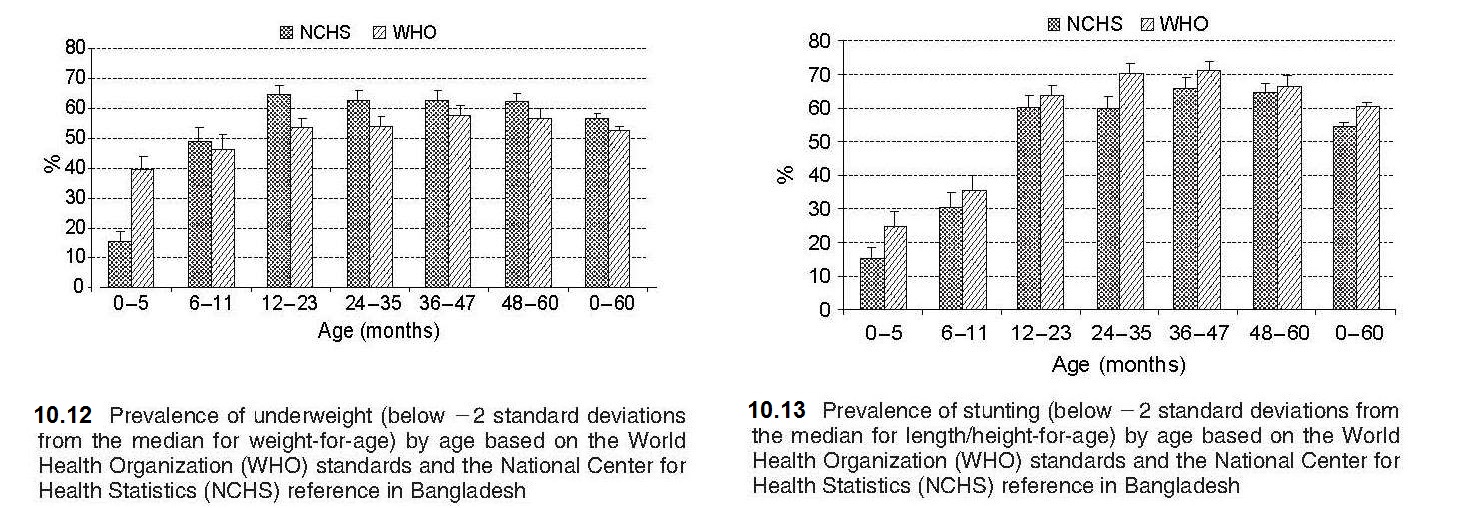
Weight-for-age reflects body mass relative to chronological age. Low weight-for-age is described as “lightness” and reflects a pathological process referred to as “underweight”, arising from gaining insufficient weight relative to age, or losing weight (WHO, 1995a). Because of its simplicity and the availability of scales in most health centers in low- and middle-income countries, weight-for-age is widely used in children from 6mo to 7y to assess underweight. Underweight is defined by the indicator weight-for-age < −2 Z‑score (relative to the WHO Child Growth Standard) and was selected as one of the indicators to track the progress in addressing poverty and hunger for the UN Millennium Development Goals (MDGs). These are now replaced by the UN Sustainable Development Goals (SDGs) (2015–2030), which include the indicators to monitor progress shown in Box 10.2. A major limitation of weight-for-age is that it is influenced by both the height and weight of a child, making interpretation difficult. For example, weight-for-age fails to distinguish tall thin children (i.e., those with low weight-for-height) from those who are short (i.e., low height-for-age) but with adequate weight. As a result, the use of weight-for-age alone to estimate the prevalence of undernutrition leads to a gross underestimate of the problem in populations where the prevalence of low height-for-age (i.e., linear growth retardation) is high but that of low weight-for-height (i.e., wasting) is low (e.g., Guatemala) (WHO, 1995a). Conversely, in countries undergoing the nutrition transition and experiencing progressive increases in childhood overweight and obesity, use of weight-for-age alone will result in overstating their progress in reducing underweight and mask stunting (Uauy et al., 2008). To interpret any single measurement of weight (or height) in relation to the reference data, the exact age of the child at the date of the measurement must be calculated from the date of birth. Software, such as WHO AnthroPlus, can calculate exact ages in decimal fractions of a year, from birth and visit dates (AnthroPlus 2009). Details of WHO Anthro Growth Standards are given here (Growth Standards). Even when information on the date of birth is available, ages are sometimes reported following rounding off the most recently attained whole month. This practice should not be followed, because it results in systematic errors (Gorstein et al., 1989). In the event that documentary evidence of the date of birth is not available, it may be necessary to obtain at least the month and year of birth using a local events calendar. Information on the development of a local events calendar is available (FAO, 2008). Details of other methods that can be used to assess the age of children are given in Chapter 9. Birthweight is also measured in health centers in low-income countries as well as maternity hospitals because it is an important indicator of fetal and neonatal health. Low birthweight (LBW) is defined as < 2500g at birth, and very low birthweight as < 1500g. South Asia is a region where 25% of births are LBW, which is of concern given that LBW infants are at risk of poor health and development outcomes. Consequently, as noted earlier, one of the Global Nutrition Targets is to achieve a 30% reduction in low birthweight by 2030 in recognition of the importance of LBW for survival, development and health in the lifespan (WHO, 2014). Low birthweight may be a consequence of premature birth (i.e., before 37wks gestation), being intrauterine growth restricted (IUGR), or both. To assess fetal growth restriction, the weight of the newborn is compared to the achievement of the expected weight for a given gestational age. Small for gestational age (SGA), defined as being born below the 10th percentile of a sex-specific birthweight distribution at a specified gestational age, is often used as a proxy to identify IUGR neonates. Methods for estimating gestational age have been described in Section 10.1.2. Interpretive criteria For international use, data for weight-for-age, expressed as Z‑scores and percentiles, are available for term infants and children (0–6mos; 0–2y; 6mo–2y; 2–5y; 0–5y) based on the WHO Child (Growth Standards), as noted earlier. These data only include term newborn infants (i.e., not gestational age specific at birth), unlike the birthweight data of the INTERGROWTH 21st Project (Villar et al. 2014). Data for weight-for-age for children beyond age 10y are not available (de Onis et al., 2007) because beyond age 10y, children are experiencing the pubertal growth spurt and may appear to have excess weight based on weight-for-age when in fact they are just tall. The U.S. CDC 2000 growth reference data, however, provide weight-for-age growth charts for boys and girls from birth to 36mos and 2–20y (Kuczmarski et al., 2002). As emphasized earlier (Section 10.2), weight data for children > 6y who participated in NHANES III survey were excluded from these revised CDC 2000 weight growth charts because the inclusion of these data shifted the upper percentile curves. Differences in the prevalence of underweight (i.e., weight-for-age Z‑score < −2) according to the WHO standard and the older NCHS reference have been reported based on the same dataset, as noted in Section 10.2. Such differences have affected the ranking of countries with respect to underweight. For example, using the 1996–1997 DHS survey from Bangladesh, the prevalence of underweight was much higher (i.e., 2.5 times greater) during the first six months but lower thereafter when based on the WHO standard compared to the NCHS reference (de Onis et al., 2006). As noted earlier (Section 10.2), this difference has arisen because the WHO standard is based on breast-fed infants whose growth pattern in infancy differs substantially from that of the predominantly formula-fed infants of the NCHS reference (de Onis et al., 2006). International standards for optimal fetal growth and newborn weight (and length and head circumference) by sex and gestational-age (33–42wks) are available from the INTERGROWTH-21st Project (Villar et al., 2014; Papageorghiou et al., 2014). Reliable estimates of gestational age were obtained by ultrasound measurements and newborn anthropometric measurements obtained within 12h of birth. These international fetal growth standards should be used worldwide to diagnose fetal growth restriction uniformly and monitor growth from early pregnancy through to the neonatal period (Papageorghiou et al., 2018), rather than locally-produced reference data. Use of these international fecal growth standards derived from a healthy population reduces the risk of under-diagnosing fetal growth restriction, which may occur when locally-produced reference data that includes high-risk mothers are used. The international standard for weight by gestational age and sex for newborn infants allows the accurate assessment of the prevalence of SGA infants worldwide. The 3rd, 10th, 50th, 90th, and 97th smoothed percentile curves and the numerical values for birthweight according to gestational age (33 to 43wks) are available (Villar et al., 2014). For more details of the INTERGROWTH-21st Project, see Box 10.1.10.2.3 Weight-for-stature
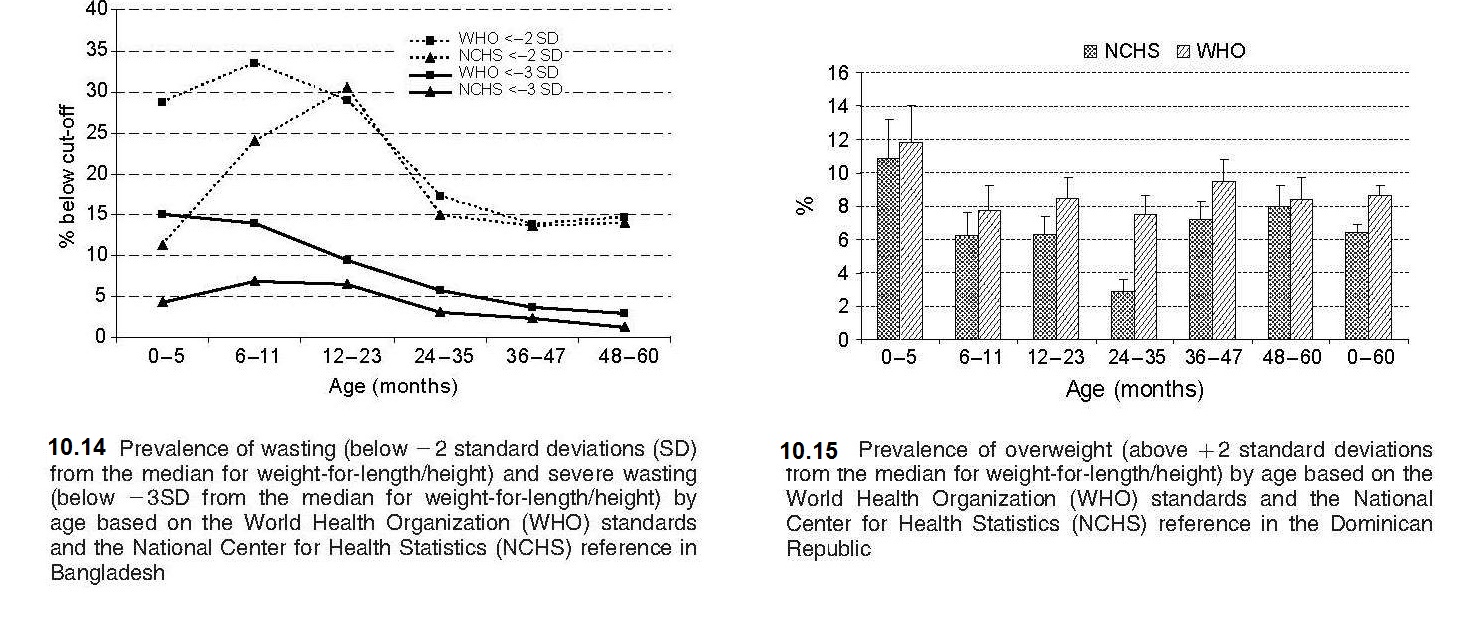
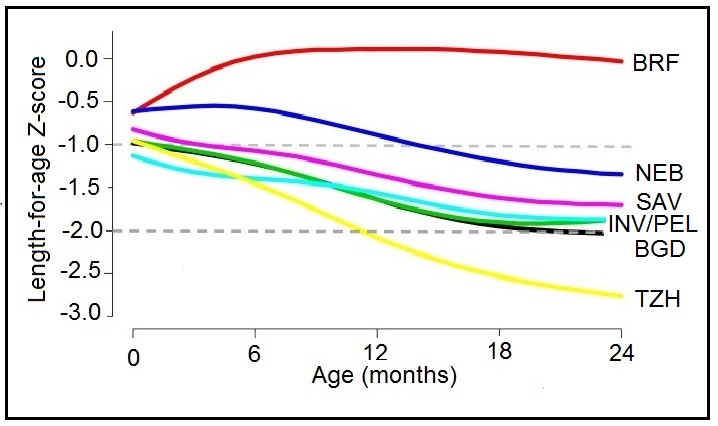
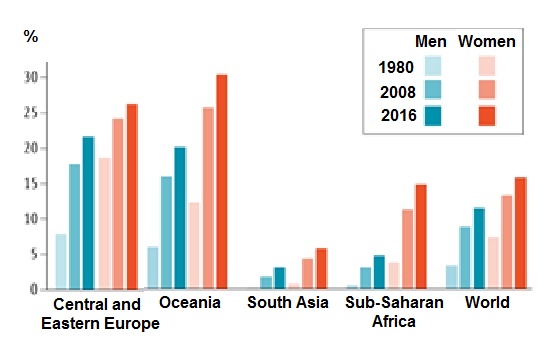
Weight-for-stature, often referred to as “Weight-for-length/height”, measures body weight relative to length or height. Low weight-for-stature in children is described as “thinness” and reflects a pathological process referred to as “wasting”. It arises from a failure to gain sufficient weight relative to stature or from losing weight. High weight-for-stature in children is termed “overweight” and arises from gaining excess weight relative to length or height or from gaining insufficient length or height relative to weight (WHO, 1995a). The prevalence of wasting is defined as the proportion of children with a Z‑score for weight-for-stature < −2 (i.e., below −2SD from the WHO median for weight-for-length/height). Wasting often develops very rapidly, and is associated with both changes in the food supply and the prevalence of infectious diseases. Wasting can be reversed quickly with an appropriate intervention. As a result, weight-for-stature is the preferred anthropometric index for identifying young children who are most likely to benefit from a feeding program, or for evaluating the benefits of intervention programs. It is more sensitive to changes in nutritional status than stature-for-age. A Z‑score between −2 and −3 is often defined as “moderate acute malnutrition”. Children with moderate acute malnutrition have specific nutrient needs, details of which are available in Golden (2009). When the Z‑score for weight-for-stature falls below −3, severe acute malnutrition (SAM) is present (WHO / UNICEF, 2009). Children are sometimes discharged following treatment for SAM when weight-for-stature reaches a Z‑score of > −2 relative to the WHO Child (Growth Standards) with no pitting edema (WHO, 2013). This discharge criterion is based on the lower risk of mortality reported compared to those children with a Z‑score more negative than −2.0. In the past, the peak prevalence of wasting was said to occur in children at aged 12–23mos, triggered by inappropriate complementary feeding and the depleting effects of infectious diseases, particularly diarrhea (WHO, 1986). However, these early studies were based on the use of the NCHS reference in which the majority of the infants were formula-fed, with a different growth pattern compared to their breast-fed counterparts, as noted earlier. As a result, use of the new WHO Child Growth Standard based on breast-fed infants has revealed an alarming level of wasting during infancy, particularly in South Asian countries, a trend that was masked when the earlier NCHS reference was applied, as shown in Figure 10.16.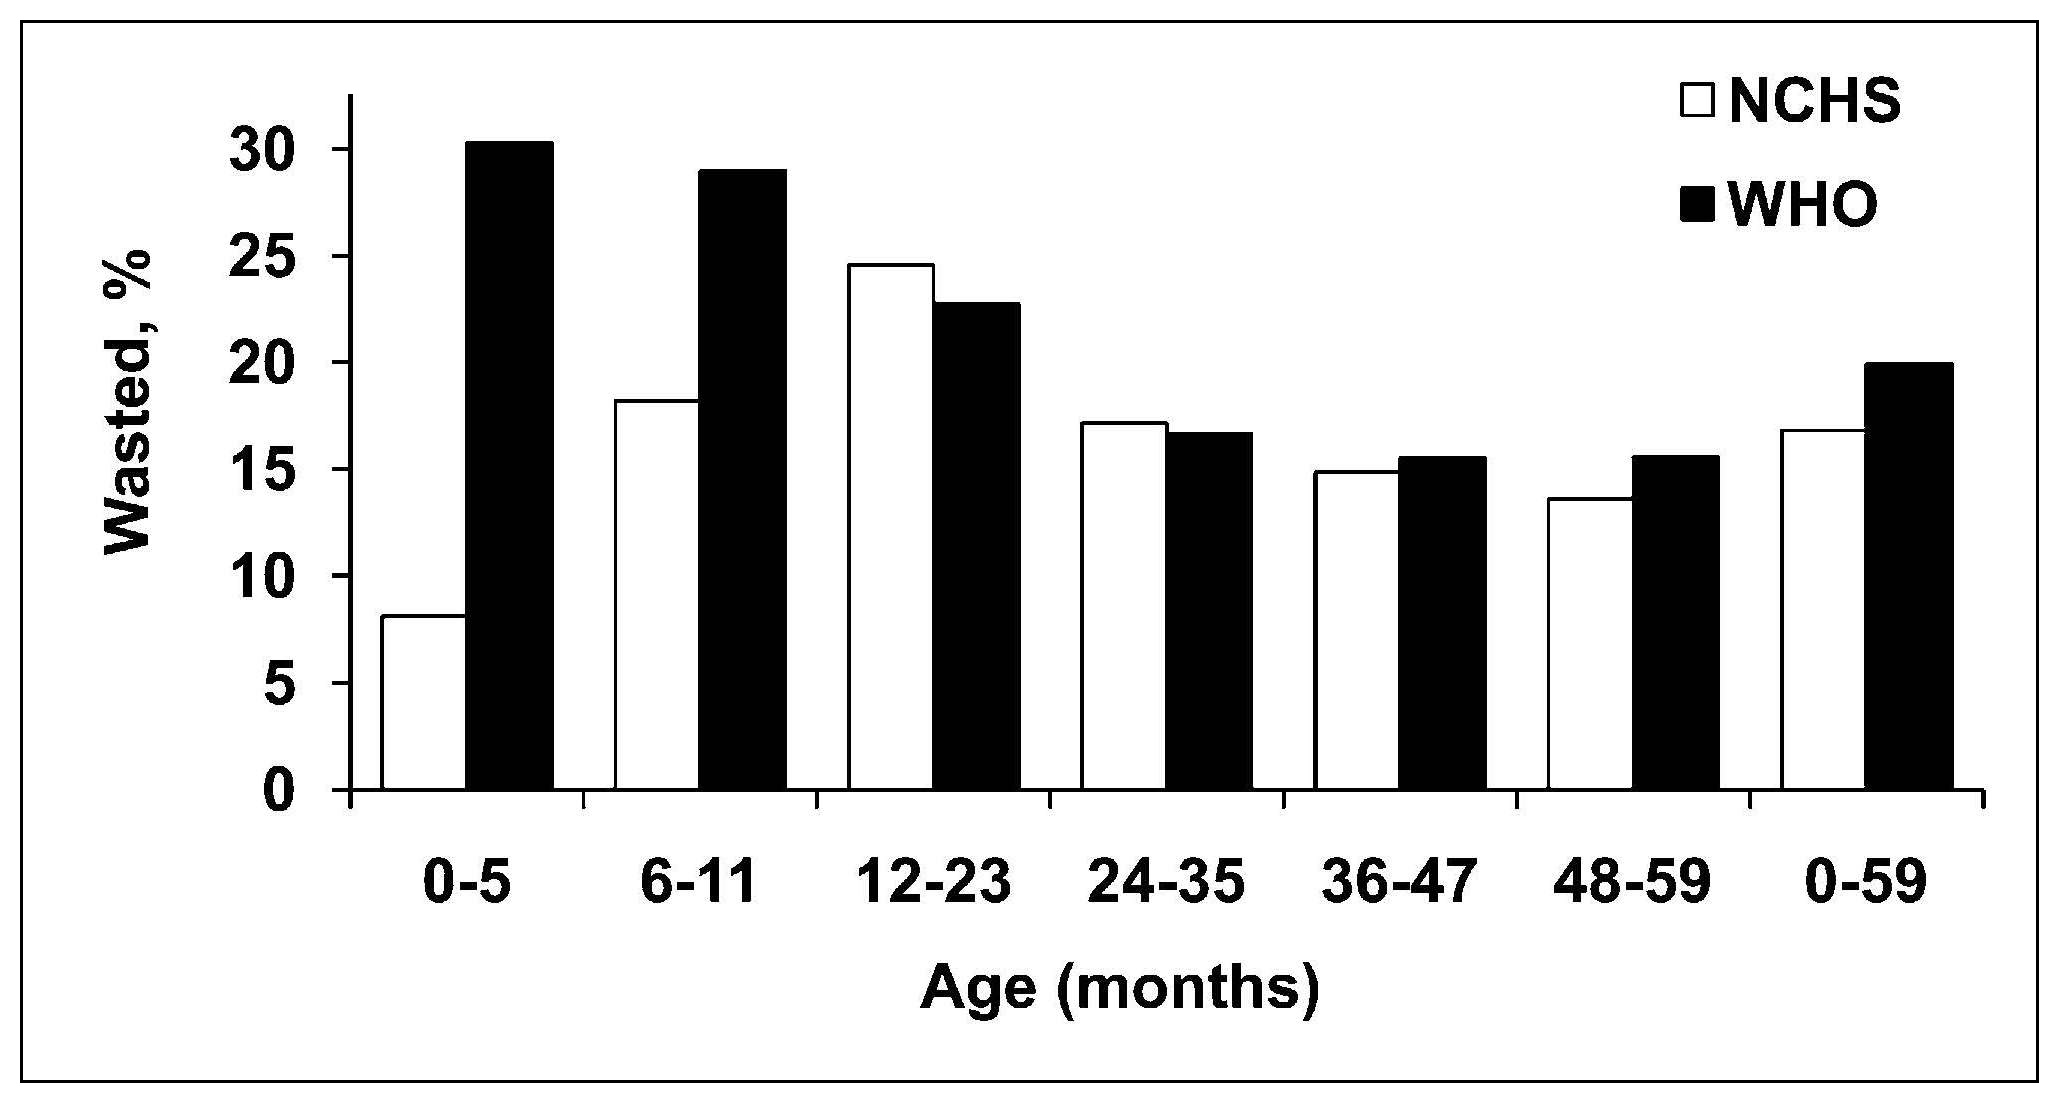
10.2.4 Length or height-for-age
Length or height-for-age (i.e., stature-for-age) is a measure of achieved linear growth that can be used as an index of past nutritional or health status. Recumbent length is measured in infants and children less than 2y, and height in older children. Low height-for-age is defined as “shortness” and reflects either a normal variation or a pathological process involving failure to reach linear growth potential. The outcome of the latter process is the gaining of insufficient height relative to age and is referred to as linear growth retardation (or linear growth faltering) (Leroy & Frongillo, 2019). The number of children suffering from linear growth retardation is much higher than the number of children who are stunted (Roth et al., 2017). Stunting is defined as having a length or height-for-age Z‑score < −2SD based on the WHO Child Growth Standard for children age 0–5y (Growth Standards). When the prevalence of stunting is greater than 40%, it is considered a severe public health problem (WHO, 1995a). In populations with a high prevalence of stunting, usually the entire height distribution has shifted downward, suggesting that most, if not all individuals, have been affected and are not growing to their full potential. However, when the prevalence is much lower and approximates the expected level (i.e., ~ 2.5% of a healthy population), then those with low height-for-age are likely to be genetically short. WHO/UNICEF, 2021 has set a 50% reduction in stunting for children <5y by 2030 as one of the global nutrition targets (Box 10.2). The prevalence of linear growth retardation generally peaks during the second or third year of life (Roth et al., 2017; Leroy et al., 2015). This age pattern is much less affected by the growth reference data used than wasting (de Onis et al., 2006), although the prevalence estimates for stunting do appear to be higher based on the WHO Child Growth Standard compared to the older NCHS reference data. The difference is attributed to the tighter variability of the WHO standards which affects the placement of the usual reference limit for stunting (i.e., −2SD)( de Onis et al., 2006). These discrepancies in the trends for stunting are evident in Figure 10.18, based on data from India. Here, the greatest difference between the WHO and NCHS reference is apparent in the 0–5mos age group (i.e., 20% vs. 10%).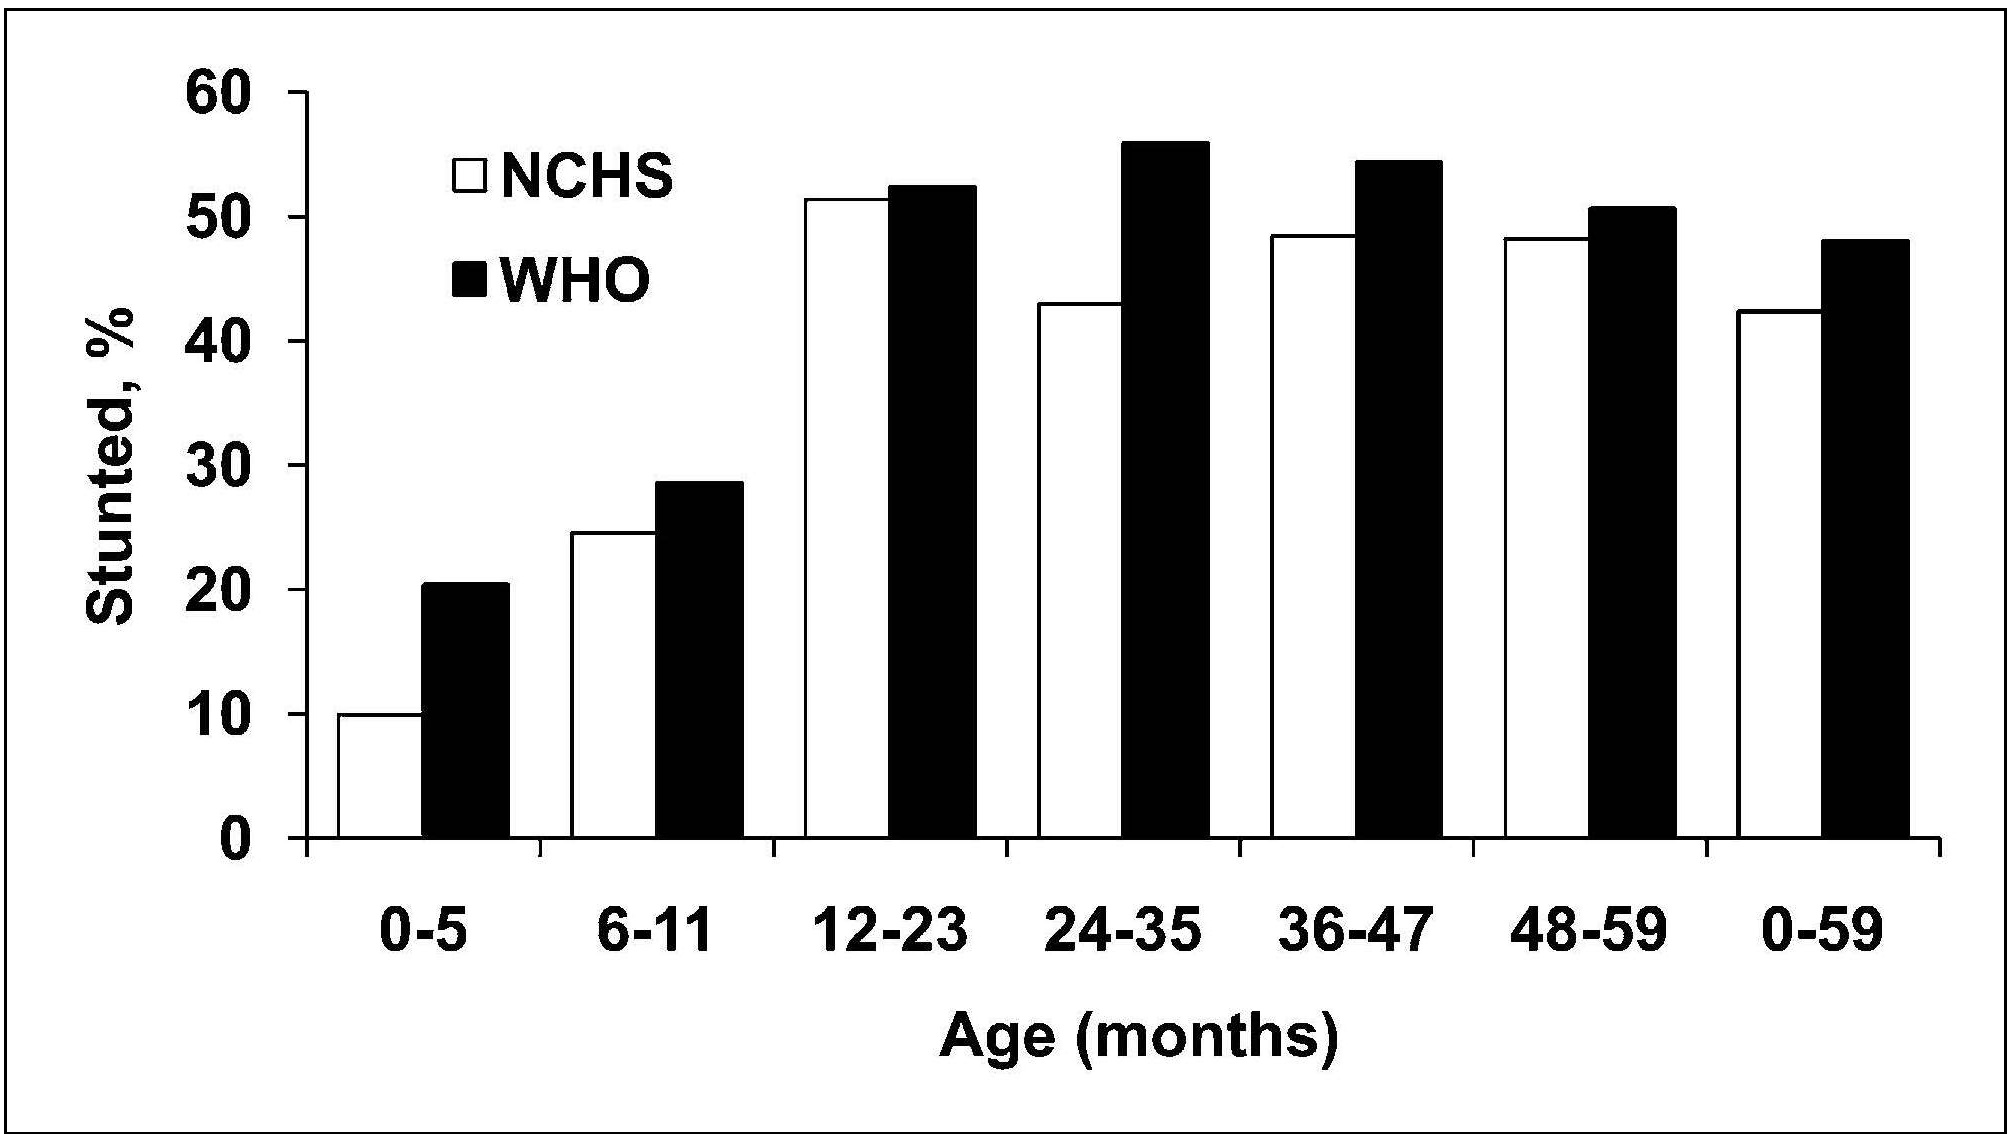
10.2.5 Height-for-age difference
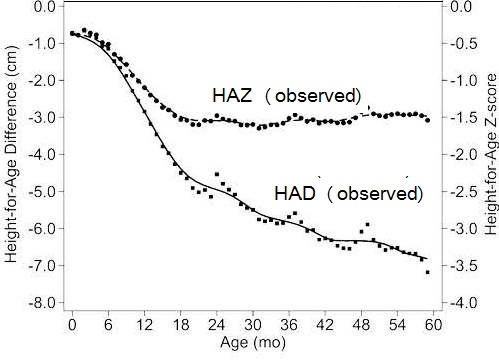
Height-for-age Z‑scores (HAZ) are widely used to assess children's attained height at a given age (see Chapters 9 and 13 for more details on Z‑scores) However, some investigators have used positive changes in attained mean height-for-age Z‑scores to identify population-level catch-up growth in children (Crookston et al., 2010). Leroy et al. (2014) have raised concern over the appropriateness of using height-for-age Z‑scores to evaluate such changes in linear growth with age over time because the cross-sectional standard deviations used in the denominator of height-for-age Z‑scores and shown in Box 10.3 are constructed from cross sectional data and are not constant over time, but increase linearly from birth to 5 years of age. As a result, a child with a constant absolute height deficit will appear to improve with age based on the HAZ. Instead, Leroy et al. (2014) recommend using height-for-age difference (HAD) to describe and compare height changes as populations of children age. Height-for-age difference (in cm) is defined as: child's height compared to standard, expressed in centimeters. It is calculated by subtracting the sex- and age-specific median height (from the WHO Child Growth Standard) from the child's actual height as shown in Box 10.3.
Box 10.3 Height-for-age Z‑scores (HAZ) and
height-for-age difference (HAD)
Figure 10.20
compares changes in growth in populations of
children between 0–60mos based on HAD and HAZ using
data from 51 nationwide surveys from low- and middle-income
countries
(Leroy et al., 2014).
- Growth deficits in height in groups of children are expressed as the mean of the individual deficits. These are calculated as the difference between the measured height and the median age- and sex-specific height from the 2006 WHO growth standard. This HAD can be used in absolute terms or it can be used standardized by dividing HAD by the SD from the growth standards to calculate HAZ: \[ \small \mbox{HAD = observed height − median height growth standard}\] \[ \small \mbox{HAZ =}\frac {\mbox{observed height − median height growth standard}}{\mbox{SD growth standard}}\] Thus: \[ \small \mbox{HAZ =}\frac {\mbox{HAD}}{\mbox{SD}}\]
- HAZ is constructed using cross-sectional SDs. HAZ is useful to assess the attained height of children at a given age but is inappropriate to assess changes in height as children age; HAZ is thus inappropriate to assess catch-up growth in height (Leroy et al., 2014). Assessing catch-up growth using HAZ is mathematically different from using HAD and has been demonstrated to lead to erroneous conclusions (Leroy et al., 2015). From Leroy et al. (2020)
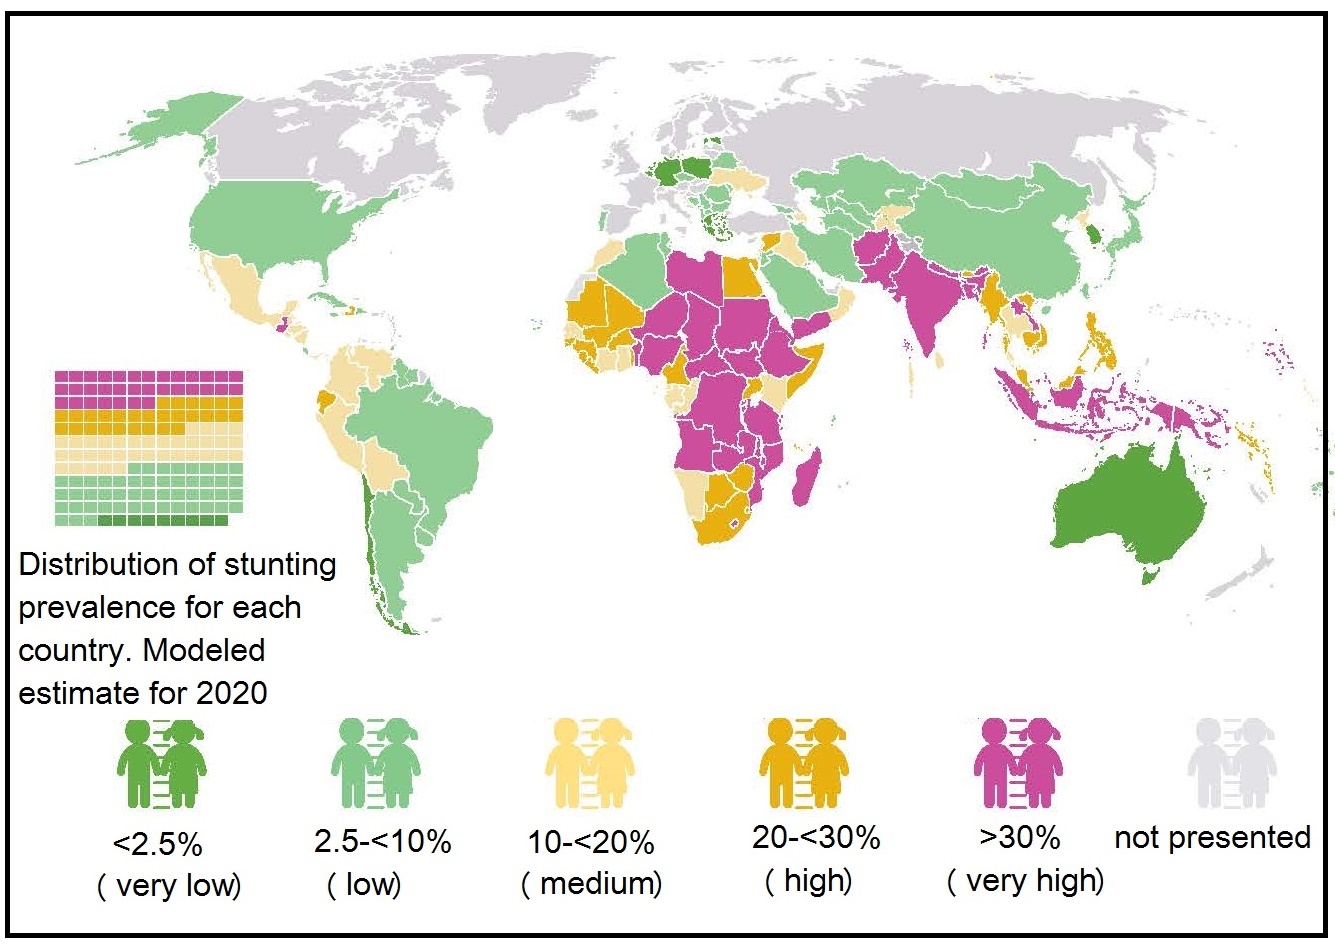
10.2.6 Classification of the severity of malnutrition based on the prevalence of wasting, overweight, and stunting
UNICEF/WHO/World Bank Group (2023) update the joint global and regional estimates of malnutrition among children under 5 years of age each year. These estimates of prevalence and numbers affected for child stunting, overweight, wasting and severe wasting are derived for the global population as well as by regional groupings of United Nations. A new country-level model was used to generate the country, regional and global estimates for stunting and overweight, for the 2021 edition and annual estimates from 2000 to 2020 are newly available. These estimates do not account for the impact of COVID-19, but the pandemic is expected to exacerbate all forms of malnutrition. This is likely due to worsening household income especially in vulnerable populations, constraints in the availability and affordability of nutritious food, disruptions in essential nutrition services, and reduced physical activity. The severity of malnutrition in young children age < 5y was originally classified into five classes of severity based on the prevalence (as %) of wasting, stunting, and overweight. This practice was adopted to highlight the levels and trends across countries, and identify the areas of greatest need and hence likely to gain the most benefit from an intervention (de Onis et al., 2019). The five prevalence levels are shown in (Table 10.2).| Wasting | overweight | Stunting | ||||||
|---|---|---|---|---|---|---|---|---|
| Prevalence thresholds (%) | Labels | (n) | Prevalence thresholds (%) | Labels | (n) | Prevalence thresholds (%) | Labels | (n) |
| < 2·5 | Very low | 36 | < 2·5 | Very low | 18 | < 2·5 | Very low | 4 |
| 2·5 – < 5 | Low | 33 | 2·5 – < 5 | Low | 33 | 2·5 – < 10 | Low | 26 |
| 5 – < 10 | Medium | 39 | 5 – < 10 | Medium | 50 | 10 – < 20 | Medium | 30 |
| 10 – < 15 | High | 14 | 10 – < 15 | High | 18 | 20 – < 30 | High | 30 |
| ≥ 15 | Very high | 10 | ≥ 15 | Very high | 9 | ≥ 30 | Very high | 44 |
10.2.7 Composite Index of Anthropometric Failure (CIAF)
Currently, the UNICEF/WHO/World-Bank classification scheme provides no estimates on children suffering simultaneously from multiple anthropometric deficits such as stunting plus wasting. However, there is increasing recognition that individual children may be at risk of both conditions simultaneously, might be born with both, pass from one state to the other over time, and accumulate risks to their health and life through their combined effects. In response to these concerns, Nandy and Svedberg (2012) proposed the Composite Index of Anthropometric Failure (CIAF). This is an aggregate measure aimed to estimate the overall burden of undernutrition in children age < 5y that incorporates children who are wasted and/or stunted and/or underweight based on the WHO Child Growth Standard (Growth Standards). The original CIAF model identifies six groups of children defined by the categories B to G, shown in Table 10.3. The overall CIAF excludes those children not in anthropometric failure (i.e., group A) and counts all children who have wasting, stunting, or are underweight (i.e., groups B to F), thus providing a single measure to estimate the overall prevalence of undernutrition (Porwal et al., 2021) (Table 10.3).| Categories of Undernutrition | Wasting | Stunting | Under- weight | N = 30,500 | (%) | |
|---|---|---|---|---|---|---|
| A | No failure | No | No | No | 18,434 | 51.8 |
| B | Wasting (Low weight- for-height WTHT) only | Yes | No | No | 1392 | 4.6 |
| C | Wasting and Underweight [Low weight-for-height (WTHT) and low weight-forage (WTA)] | Yes | No | Yes | 1729 | 6.5 |
| D | Wasting, Stunting and Underweight (All three anthropometric failures) | Yes | Yes | Yes | 1222 | 6.0 |
| E | Stunting and Underweight [Low height-for-age (HTA) and Low weight-for-age (WTA)] | No | Yes | Yes | 3552 | 16.6 |
| F | Stunting only [Low height-for-age (HTA)] | No | Yes | No | 3467 | 11.5 |
| Y | Underweight only [Low weight-for-age (WTA)] | No | No | Yes | 704 | 3.0 |
| Overall CIAF | B + C + D+ E + F + Y | 12,066 | 48.2 |
| Group | Anthropometric Status | CIAF - Prevalence (95% CI) |
|---|---|---|
| A | No failure | 54.5 (50.9–58.1) |
| B | Wasting only | 4.2 (3.0–5.5) |
| C | Wasting and underweight | 9.0 (7.2–10.8) |
| D | Stunting, wasting, and underweight | 5.6 (4.3–7.0) |
| E | Stunting and underweight | 7.6 (5.9–9.2) |
| F | Stunting only | 18.4 (15.8–21.0) |
| Y | Underweight only | 0.8 (0.3–1.2) |
| B to Y | Overall undernutrition (CIAF) | 45.5 (42.0–49.1) |
| eCIAF - Prevalence (95% CI) | ||
| A | No failure | 42.7 (39.4–46.1) |
| B | Wasting only | 4.2 (3.0–5.5) |
| C | Wasting and underweight | 9.0 (7.2–10.8) |
| D | Stunting, wasting, and underweight | 5.6 (4.3–7.0) |
| E | Stunting and underweight | 7.6 (5.9–9.2) |
| F | Stunting only | 12.3 (10.2–14.4) |
| Y | Underweight only | 0.8 (0.3–1.2) |
| G | Stunting and overweight | 6.1 (4.7–7.4) |
| H | Overweight only | 11.7 (9.5–14.0) |
| B to H | Overall malnutrition (eCIAF) | 57.3 (53.9–60.6) |
10.2.8 Weight changes
Body weight is the sum of the protein, fat, water, and bone mass in the body. Changes in body weight do not provide any information on the relative changes among these components. Increasingly changes in the components of body composition are assessed using laboratory-based methods, such as dual-energy X-ray absorptiometry (DXA), deuterium dilution, or bioelectrical impedance analysis. For details of these techniques, see Chapter 14. Body weight is the sum of the protein, fat, water, and bone mass in the body. Changes in body weight do not provide any information on the relative changes among these components. In normal adults, there is a tendency for increased fat deposition with age, concomitant with a reduction in muscle protein. Such changes are not evident in body weight measurements but can be seen by determining either body fat or the fat-free mass. In healthy persons, the daily variations in body weight are generally small (i.e., less than ±0.5kg). In conditions of acute or chronic illness, however, negative energy-nitrogen balance may occur as the body can use endogenous sources of energy (including protein) as fuel for metabolic reactions. Consequently, body weight declines. In conditions of total starvation, the maximal weight loss is approximately 30% of initial body weight, at which point death occurs. In chronic semistarvation, body weight may decrease to approximately 50%–60% of ideal weight. In contrast, when persistent positive energy balance occurs, there is an accumulation of adipose tissue, and body weight increases. Body weight can only be used to assess the severity of undernutrition in subjects with relatively uncomplicated, nonedematous forms of semistarvation (Heymsfield et al., 1984). In disease conditions in which edema, ascites (fluid in the abdominal cavity), dehydration, diuresis, massive tumor growth, and organomegaly occur, or in obese patients undergoing rapid weight loss, body weight is a poor measure of body energy-nitrogen reserves. In such conditions, a relative increase in total body water, for example, may mask actual weight loss that results from losses of fat or skeletal muscle. Massive tumor growth may also mask losses of fat and muscle tissue, which may occur during severe undernutrition. Hence, additional anthropometric measurements (e.g., mid-upper-arm circumference and triceps skinfold thickness) should be taken to obtain more information on the origin of any change in body weight (Heymsfield et al., 1984). To assess weight changes, the actual and usual weight of an individual must be known. From these two measurements, the percentage of usual weight, percentage of weight loss (or weight gain), and rate of change can be calculated using the equations shown in Box 10.4. The individual's actual weight can also be compared with appropriate age- and sex-specific reference data.
Box 10.4
\[ \small \mbox{% Usual wt. =}\frac
{\mbox{actual wt.}}{\mbox{usual wt.}} \mbox{× 100%}\]
\[ \small \mbox{% Wt. loss =}\frac
{\mbox{usual wt. − actual wt.}}{\mbox{usual wt.}} \mbox{× 100%}\]
\[ \small \mbox{Rate of change =}\frac
{\mbox{body weight present − body weight initial }}{\mbox{day present − day initial}} \mbox{ (kg/d)}\]
Weight changes in children
In low income countries, where there
is a high prevalence of under-nutrition,
weekly weight gain has often been
used to monitor short-term response of children
to a feeding program. For example in the past, in children with severe
acute malnutrition (SAM), percentage weight gain was applied as the
discharge criterion. However, use of a weight-based assessment can be
misleading in children with SAM. Such children may have diarrheal
disease accompanied by dehydration or edema, both of which have an
affect on body weight
(Modi et al., 2015).
Both lack of weight gain and weight loss in a child have been
shown to be independently and more closely related to
mortality than other indicators of undernutrition,
such as BMI-for-age based on survival data from 2402 rural children
aged 0–24mos fom the Democratic Republic of Congo
(O'Neill et al., 2012).
These two indicators are also included in a set of diagnostic indicators
developed to identify pediatric under nutrition by the the U.S. Academy of
Nutrition and Dietetics and
the American Society for Parenteral and Enteral Nutrition (ASPN)
(Becker et al., 2015).
Pediatric undernutrition in developed countries
generally occurs in a setting of acute or chronic illness.
Nevertheless more studies are needed to evaluate the feasibility,
suitability, validity, and reliability of these
indicators to identify pediatric undernutrition
(Mogensen et al., 2019).
With the growing concern about the dual burden of nutrition,
changes in body weight are being monitored in apparently healthy children.
For example, changes in body weight over a 15y period
(both weight loss and weight gain)
have been monitored in apparently healthy children and
adolescents (n=> 150,000) in Germany
(Vogel et al., 2022).
A change outside ±0.2 BMI‑SDs per year was classified as a high
positive or high negative change.
Between 2005–2020, there was a small but stable positive
trend in the proportion of children with a high positive weight
change, especially within those children with obesity.
This trend was accompanied by a decrease in the proportion
with a high negative weight change.
During COVID‑19, the weight gain was substantial across
all weight and age groups (i.e., 1–6y; 6–12y;
12–18y), as noted by others
(Jia, 2021;
Brooks et al., 2021):
COVID-19 has aggravated the childhood obesity pandemic.
Weight changes in adults
The U.S Academy of Nutrition and Dietetics and the American Society for Parenteral
and Enteral Nutrition (ASPN) have also devised a series of diagnostic
characteristics to identify and document
malnutrition (undernutrition) in adults in
acute, chronic, and transitional care settings in
developed countries.
Six clinical charateristics were identified to support a
a diagnosis of malnutrition in adults, one of which was
percentage weight loss from baseline
(White et al., 2012).
For more details of these diagnostic indicators, the reader is
referred to Chapter 27, Nutritional assessment of hospital patients.
Marked changes in body weight in healthy adults with age have been documented
in several national surveys in industrialized countries. Such changes may have
long-term consequences on health.
In general during the period from young to middle
adulthood, adults gain weight more rapidly and
accrue excess adiposity, whereas
from middle to late adulthood, weight begins to stabilize or even decrease,
especially around age 70y, when the
decrease may continue for the remainder of life.
Several investigators have examined the association
between weight changes across adulthood and mortality.
For example, in a prospective cohort study of
US adults participating in NHANES from
1988 to 2014, Chen et al.
(2019)
reported stable obesity across adulthood, weight gain
from young (age 25y) to middle
adulthood (mean age 47y),
and weight loss from middle to late adulthood,
were associated with increased risk of mortality.
These findings suggest that maintaining a normal healthy
weight across adulthood, and especially preventing
weight gain in early adulthood, is
important for preventing premature deaths in later life.
The potential effect of weight loss and weight gain
among older adults has also been investigated.
In a systematic review and meta-analysis
of community-dwelling older adults aged > 65y,
the effect of weight loss on increased risk of all-cause mortality
was stronger than weight gain
(Alharbi et al., 2021),
as noted by others
(Karahalios et al., 2017).
However, the point at
which weight loss may indicate increased mortality
risk has not been clearly defined.
Further research is needed to determine whether
these associations vary with gender,
initial weight, and whether or not the
weight loss/gain was intentional.
Nevertheless, caution when interpreting the results
of some of these epidemiological studies is warrented.
Methodological issues of concern include confounding by smoking,
reverse causation due to existing chronic diseases,
especially among the elderly, and non-specific loss
of lean mass and function in the frail elderly
(Fontana & Hu, 2014).
Gestational weight changes
The U.S. National Research Council
(2009)
have compiled new guidelines
for gestational weight gain in response to the increase in
the proportion of U.S. women of reproductive age
who are overweight and obese. Gestational weight gain includes
gains in maternal and fetal fat-mass and fat-free mass,
as well as the placenta and amniotic fluid.
How these different components of gestational weight gain
influence both maternal and offspring health remains uncertain:
see Widen and Gallagher
(2014)
for more details.
For the first time, the new U.S guidelines consider those
health outcomes of both mother and child during and after
delivery which are plausibly related to gestational weight gain,
and the trade-offs between them. For the mother,
the most important health outcomes considered were
postpartum weight retention and unscheduled cesarean
delivery, whereas for the infants the outcomes were
preterm birth, extremes of birthweight
(expressed as small- or large-for gestational age),
and childhood obesity
(Rasmussen et al., 2010).
Table 10.5
| Total Weight Gain | Rates of Weight Gain* 2nd and 3rd Trimester | |||
|---|---|---|---|---|
| Prepregnancy BMI | Range in kg | Range in lbs |
Mean (range) in kg/week |
Mean (range) in lbs/week |
| Underweight (< 18.5 kg/m2) | 12.5–18 | 28–40 | 0.51 (0.44–0.58) | 1 (1–1.3) |
| Normal weight (18.5–24.9 kg/m2) | 11.5–16 | 25–35 | 0.42 (0.35–0.50) | 1 (0.8–1) |
| Overweight (25.0–29.9 kg/m2) | 7–11.5 | 15–25 | 0.28 (0.23–0.33) | 0.6 (0.5–0.7) |
| Obese (≥ 30.0 kg/m2) | 5–9 | 11–20 | 0.22 (0.17–0.27) | 0.5 (0.4–0.6) |
10.3 Body mass index in adults
| Index | Formula |
|---|---|
| Weight/height ratio | wt/ht |
| Body Mass Index | wt/(ht)2 |
| Ponderal index | ht / ∛wt |
| Benn's index | wt/(ht)p |
10.3.1 BMI and measures of body fat and disease risk
The validity of BMI as an index of the percentage body fat and fat mass (in kg) in adults has been assessed by comparing BMI with body fatness estimated initially using a 2‑component model, although more recently multi-component models of body composition are being used (Gallagher et al., 1996; Wells et al., 2010; Silva et al., 2013). In the simpler 2‑component model, total body mass is partitioned into total body fat and fat-free mass, applying the principle that if one of the components is measured, the other can be estimated. However, when using this approach, the calculation of body fat depends on certain theoretical assumptions. The hydration of fat-free mass, for example, is assumed to be constant within and between individuals even though inter-individual variability is known to exist, especially during growth and maturation in children, in pregnancy, and among adults with varying adiposity (Wells et al., 2010; Most et al., 2018; Gutiérrez-Marin et al., 2021; Gallagher et al., 1996).
10.3.2 WHO classification of overweight and obesity in adults
The WHO International Obesity Task Force defined obesity as a condition in which abnormal or excessive fat accumulation may impair health. (WHO, 2000). They have recommended the use of a graded classification of both overweight and obesity to:- Compare weight status within and between populations
- Identify individuals and groups who are at increased risk of morbidity and mortality
- Identify priorities for intervention at both the individual and community levels
- Allow interventions to be evaluated appropriately
| Classification | BMI (kg/m2) | Risk of comorbidities |
| Underweight | < 18.50 | Low (but risk of other clinical prob- lems is increased) |
| Normal weight | > 18.5 to < 25.0 | Average |
| Overweight | 25 to < 30.0 | Increased |
| Class 1 obesity | 30 to < 35.0 | Moderate |
| Class 2 obesity | 35 to < 40.0 | Severe |
| Class 3 obesity | > 40.0 | Very severe |
| Classification | BMI (kg/m2) | Risk of comorbidities |
| Underweight | < 18.50 | Low (but risk of other clinical prob- lems is increased) |
| Normal weight | > 18.5 to 22.9 | Average |
| Overweight | ≥ 23 | |
| At risk | 23 to 24.9 | Increased |
| Class 1 obesity | 25 to 29.9 | Moderate |
| Class 2 obesity | ≥ 30.0 | Severe |
10.3.3 Canadian classification of overweight and obesity in adults
The BMI classification system for adults used by Health Canada has been adapted from that of WHO (2000) The classification applies to adult women (nonpregnant and nonlactating) and men between the ages of 18 and 65y (Douketis et al., 2005).| Health Canada Classification | BMI (kg/m2) | Risk of developing health problems |
| Underweight | < 18.50 | Increased |
| Normal weight | 18.50 to 24.99 | Least |
| Overweight | 25.00 to 29.99 | Increased |
| Obese Class I | 30.00 to 34.99 | High |
| Obese Class II | 35.00 to 39.99 | Very high |
| Class 2 obesity | ≥ 40.00 | Extreme high |
10.3.4 U.S. classification of overweight and obesity in adults
The cutoff points that define normal weight, overweight, and the various categories of obesity in the United States are now the same as those used by WHO (2024) and are presented in Table 10.7. Obesity is often subdivided into three categories in the United States, with class III (i.e., BMI > 40) designated as “severe obesity”. These BMI cutoff points for adults define overweight and class I to III obese individuals and identify those who may be at increased risk for cardiovascular disease and other obesity-related conditions. However, within these categories, personal additional risk assessment is also needed because degree of risk can vary. For more details on the assessment and treatment of cardiovascular risk factors and obesity-comorbidities for individuals with overweight or class I to III obesity, the reader is referred to the AHA/ACC/TOS guideline (2013). Note that these guidelines also recommend the measurement of waist circumference in patients with BMI 25–34.9kg/m2. The waist circumference cutoff points indicative of increased cardiometabolic risk used in the United States are > 88cm for women and > 102cm for men. These same waist circumference cutoffs are also used for adult Canadians. See Chapter 11 for more details of the measurement of waist circumference.10.3.5 BMI and chronic energy deficiency in adults
In low-income countries, low values for BMI in adults have been consistently associated with a decline in work output, productivity, and income generating ability, as well as a compromised ability to respond to stressful conditions (Ferro‑Luzzi et al., 1992). Underweight has also been associated with increased mortality. For example, in an early study in India, a progressive increase in mortality rate below a BMI of 18.5 was reported, with an almost threefold higher rate after ten years for those with BMI below 16 (Naidu & Rao, 1994). Whether the individuals were ill prior to the measurement is unknown, however, making it difficult to assign the trend to any causal relationship. Nevertheless, some evidence for such a relationship has been reported based on more recent meta-analysis of prospective studies across continents (Di Angelantonio et al., 2016; Wild & Byrne, 2016), as well as from an analysis of the Global Burden of Disease Study (2017). In developed countries, some of the early studies of low BMI and mortality failed to control for two principal sources of bias: cigarette smoking, and the elimination of thin adults with early mortality, many of whom may had been already ill when measured (Manson et al., 1987). More recently, Flegal et al. (2005) investigated excess deaths associated with underweight (as well as overweight and obesity) in the U.S NHANES data. In their study, they noted an increase in mortality with both underweight (BMI < 18.5) and with obesity (BMI ≥ 30), but not with overweight (i.e., BMI ≥ >25 but < 30). In most developed countries today, underweight is common in adults in hospitals and nursing homes, almost invariably secondary to disease, although in some more affluent countries underweight has been associated with osteoporosis, infertility, and impaired immunocompetence (Health Canada, 2003). A single cutoff point of < 18.5kg/m2 is frequently used to define low BMI values, indicative of underweight in both men and women in both low-income and more affluent countries (Naidu & Rao, 1994; Health Canada, 2003; NCD Risk Factor Collaboration, 2017). FAO has categorized three degrees of underweight based on BMI and adopted the term “chronic energy deficiency” for underweight (Shetty & James, 1994). The FAO classification of adult chronic energy deficiency based on the three degrees of underweight are shown in Table 10.10.| Chronic energy deficiency grade | BMI (kg/m2) |
| Normal | > 18.50 |
| Grade I | 17.0 to 18.4 |
| Grade II | 16.0 to 16.9 |
| Grade III | < 16.0 |
| Situation | Percent of population with
BMI (kg/m2) < 18.5 |
| Low prevalence (warning sign, monitoring required) | 5 to 9 |
| Medium prevalence (poor situation) | 10 to 19 |
| High prevalence (critical situation) | 20 to 39 |
| Very high prevalence (critical situation) | ≥ 40 |
10.4 BMI in children and adolescents
Body mass index is also now the internationally recommended screening indicator of overweight and obesity in both children and adolescents (WHO, 1995a). The recommendation arises from the following observations: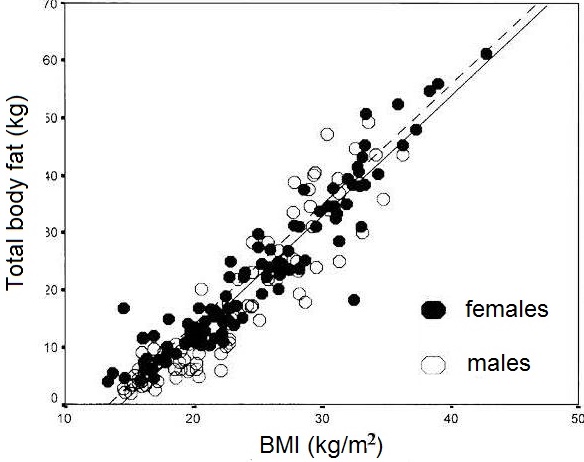
- Strong positive relationships between BMI and body fatness (measured in children by densitometry, magnetic resonance imaging, or DXA). Figure 10.26 presents the relationship between BMI and total body fat (via DXA) in 198 healthy Italian children and adolescents aged 5–19y
- Higher BMI among children in longitudinal studies is associated with tracking in the higher levels of blood pressure, serum lipids, and other factors that in adults are related to higher cardiovascular risk (Freedman & Sherry, 2009; Reilly et al., 2010; Kelly et al., 2013).
10.4.1 International Obesity Task Force (IOTF) mass index cutoffs for overweight and obesity in children
In 1998, WHO convened an International Task Force on Obesity to define overweight and obesity in children and adolescents. This expert group agreed to recommend the adoption of an earlier approach developed by the European Childhood Obesity group (Poskitt, 1995) but based on an international reference population. To accomplish this recommendation, Cole et al. (2000) compiled data for BMI for children 2–18y from six large nationally representative cross-sectional growth studies (Brazil, Great Britain, Hong Kong, the Netherlands, Singapore, and the United States). The data were used to construct two country-specific percentile curves passing through the adult definitions of both overweight (BMI > 25kg/m2) and obesity (> 30kg/m2) at age 18y for each sex. The curves were then averaged across countries by age to yield sex-specific curves for each cutoff. A major disadvantage of these international (IOTF) cutoffs, however, was that they could not be expressed as percentiles (e.g., 85th percentile) or standard deviation scores (+2 Zscores). As a result they could not be compared with other reference data in which the BMI cutoffs were defined by age-sex- specific BMI percentiles (e.g., 85th or 95th percentile) or standard deviation scores (e.g., +2SDs). Consequently, Cole and Lobstein (2012) reformulated their original international cutoffs using the LMS curves which permit BMI to be expressed as a percentile or SD score. Table 10.12 presents the sex-specific BMI cut- offs at age 18y for overweight (BMI 25), obesity (BMI 30), and morbid obesity (BMI 35), expressed as a SD score equivalent or percentile equivalent. Only small differences (< 0.2% on average) were observed when these new international IOFT cutoffs were compared with the original cutoffs based on prevalence rates for overweight and obesity from US and Chinese data.| BMI cutoff at 18y (kg/m2) | SD score equivalent | Percentile equivalent |
| Boys | ||
| 25 | 1.310 | 90.5 |
| 30 | 2.288 | 98.9 |
| 35 | 2.930 | 99.83 |
| Girls | ||
| 25 | 1.244 | 89.3 |
| 30 | 2.192 | 96.6 |
| 35 | 2.822 | 99.76 |
- Use of weight-for-stature charts, that cover only a restricted age range, and omit adolescence entirely, are eliminated
- Obesity assessment in adults is integrated with that in children and adolescents
- Existing cutoffs can now be expressed as percentiles or SD scores allowing comparison with other BMI references
- New cutoffs are easy to derive (e.g., BMI for morbid obesity)
10.4.2 WHO classification of over-weight and obesity in children
With the development of international growth references for both young children 0–5y and school-aged children and adolescents for clinical and epidemiological use, WHO has adopted cutoffs points for overweight and obesity for the two age groups based on standard deviation scores (i.e., Z‑scores) derived from the corresponding BMI-for-age curves of the corresponding reference data. For infants and children 0–5y, the WHO Child Growth Standards based on the multicenter study of children aged 0–5y from 6 diverse geographic sites (Brazil, Ghana, India, Norway, Oman, and the United States) should be used (WHO, 2006). whereas, for school-age children and adolescents the WHO international growth reference 2007 is recommended. The latter is a reconstruction of the original 1977 National Center for Health Statistics (NCHS) data set supplemented with data from the WHO Child Growth Standard to ensure a smooth transient at age 5y (de Onis et al., 2007). The statistical methodology used to construct this reference was the same as that used for the WHO Child Growth Standard (2004). The full set of tables and charts for the BMI-for-age curves by sex for both preschool and school-aged children, including application tools, is available (WHO international growth reference 2007). For a child 0–5y, WHO defines “at risk of overweight” as a BMI Z‑score of > +1 but < +2; “overweight” as a BMI Z‑score > +2 and < +3, and “obese” as a BMI Z‑score > +3, based on the WHO Child Growth Standard (WHO, 2006; de Onis & Lobstein, 2010). For a school-aged child aged 5–19y, WHO defines a BMI Z‑score above +1 but < +2 as overweight, and +2 as obesity, based on the WHO 2007 growth reference data (de Onis et al., 2007; de Onis & Lobstein, 2010). Details for the justification of these WHO cutoffs were not provided. The more stringent WHO cutoffs for children aged < 5y compared to those ≥ 5y were proposed to avoid overdiagnosis of obesity in younger children; the increase in average BMI observed in all age groups of children has been greater in the older children since the 1990s. Hence, the current trend in BMI in children no longer reflects what is termed “age agnosticism”, in which the risk of obesity is assumed to be constant throughout infancy and childhood (de Onis & Lobstein, 2010; Wright et al., 2022). Cole and Lobstein (2012) compared the prevalence rates for overweight and obesity defined by the WHO BMI Z‑scores and their extended international IOFT cutoffs using US and Chinese data. There were systematic differences in the prevalence of overweight and obesity; the WHO prevalence rates were lower for children age 2–5y, but higher for those 5–18y, probably due to the method of construction of the WHO percentile curves; see Cole and Lobstein (2012) for more details.10.4.3 U.S. classification of overweight and obesity in children
The approach of Cole et al. (2000; 2012) has not been adopted in the United States. Instead, the U.S 2000 CDC growth charts are used, with overweight among children aged 2–19y defined as BMI > 85th but < 95th percentile, and obesity as BMI > 95th percentile of the sex-specific CDC BMI-for-age growth charts. Two sets of clinical charts for children are available. Set 1 has the outer limits of the curves at the 5th and 95th smoothed percentiles and includes the 85th percentile for BMI-for-age as shown in Figure 10.27.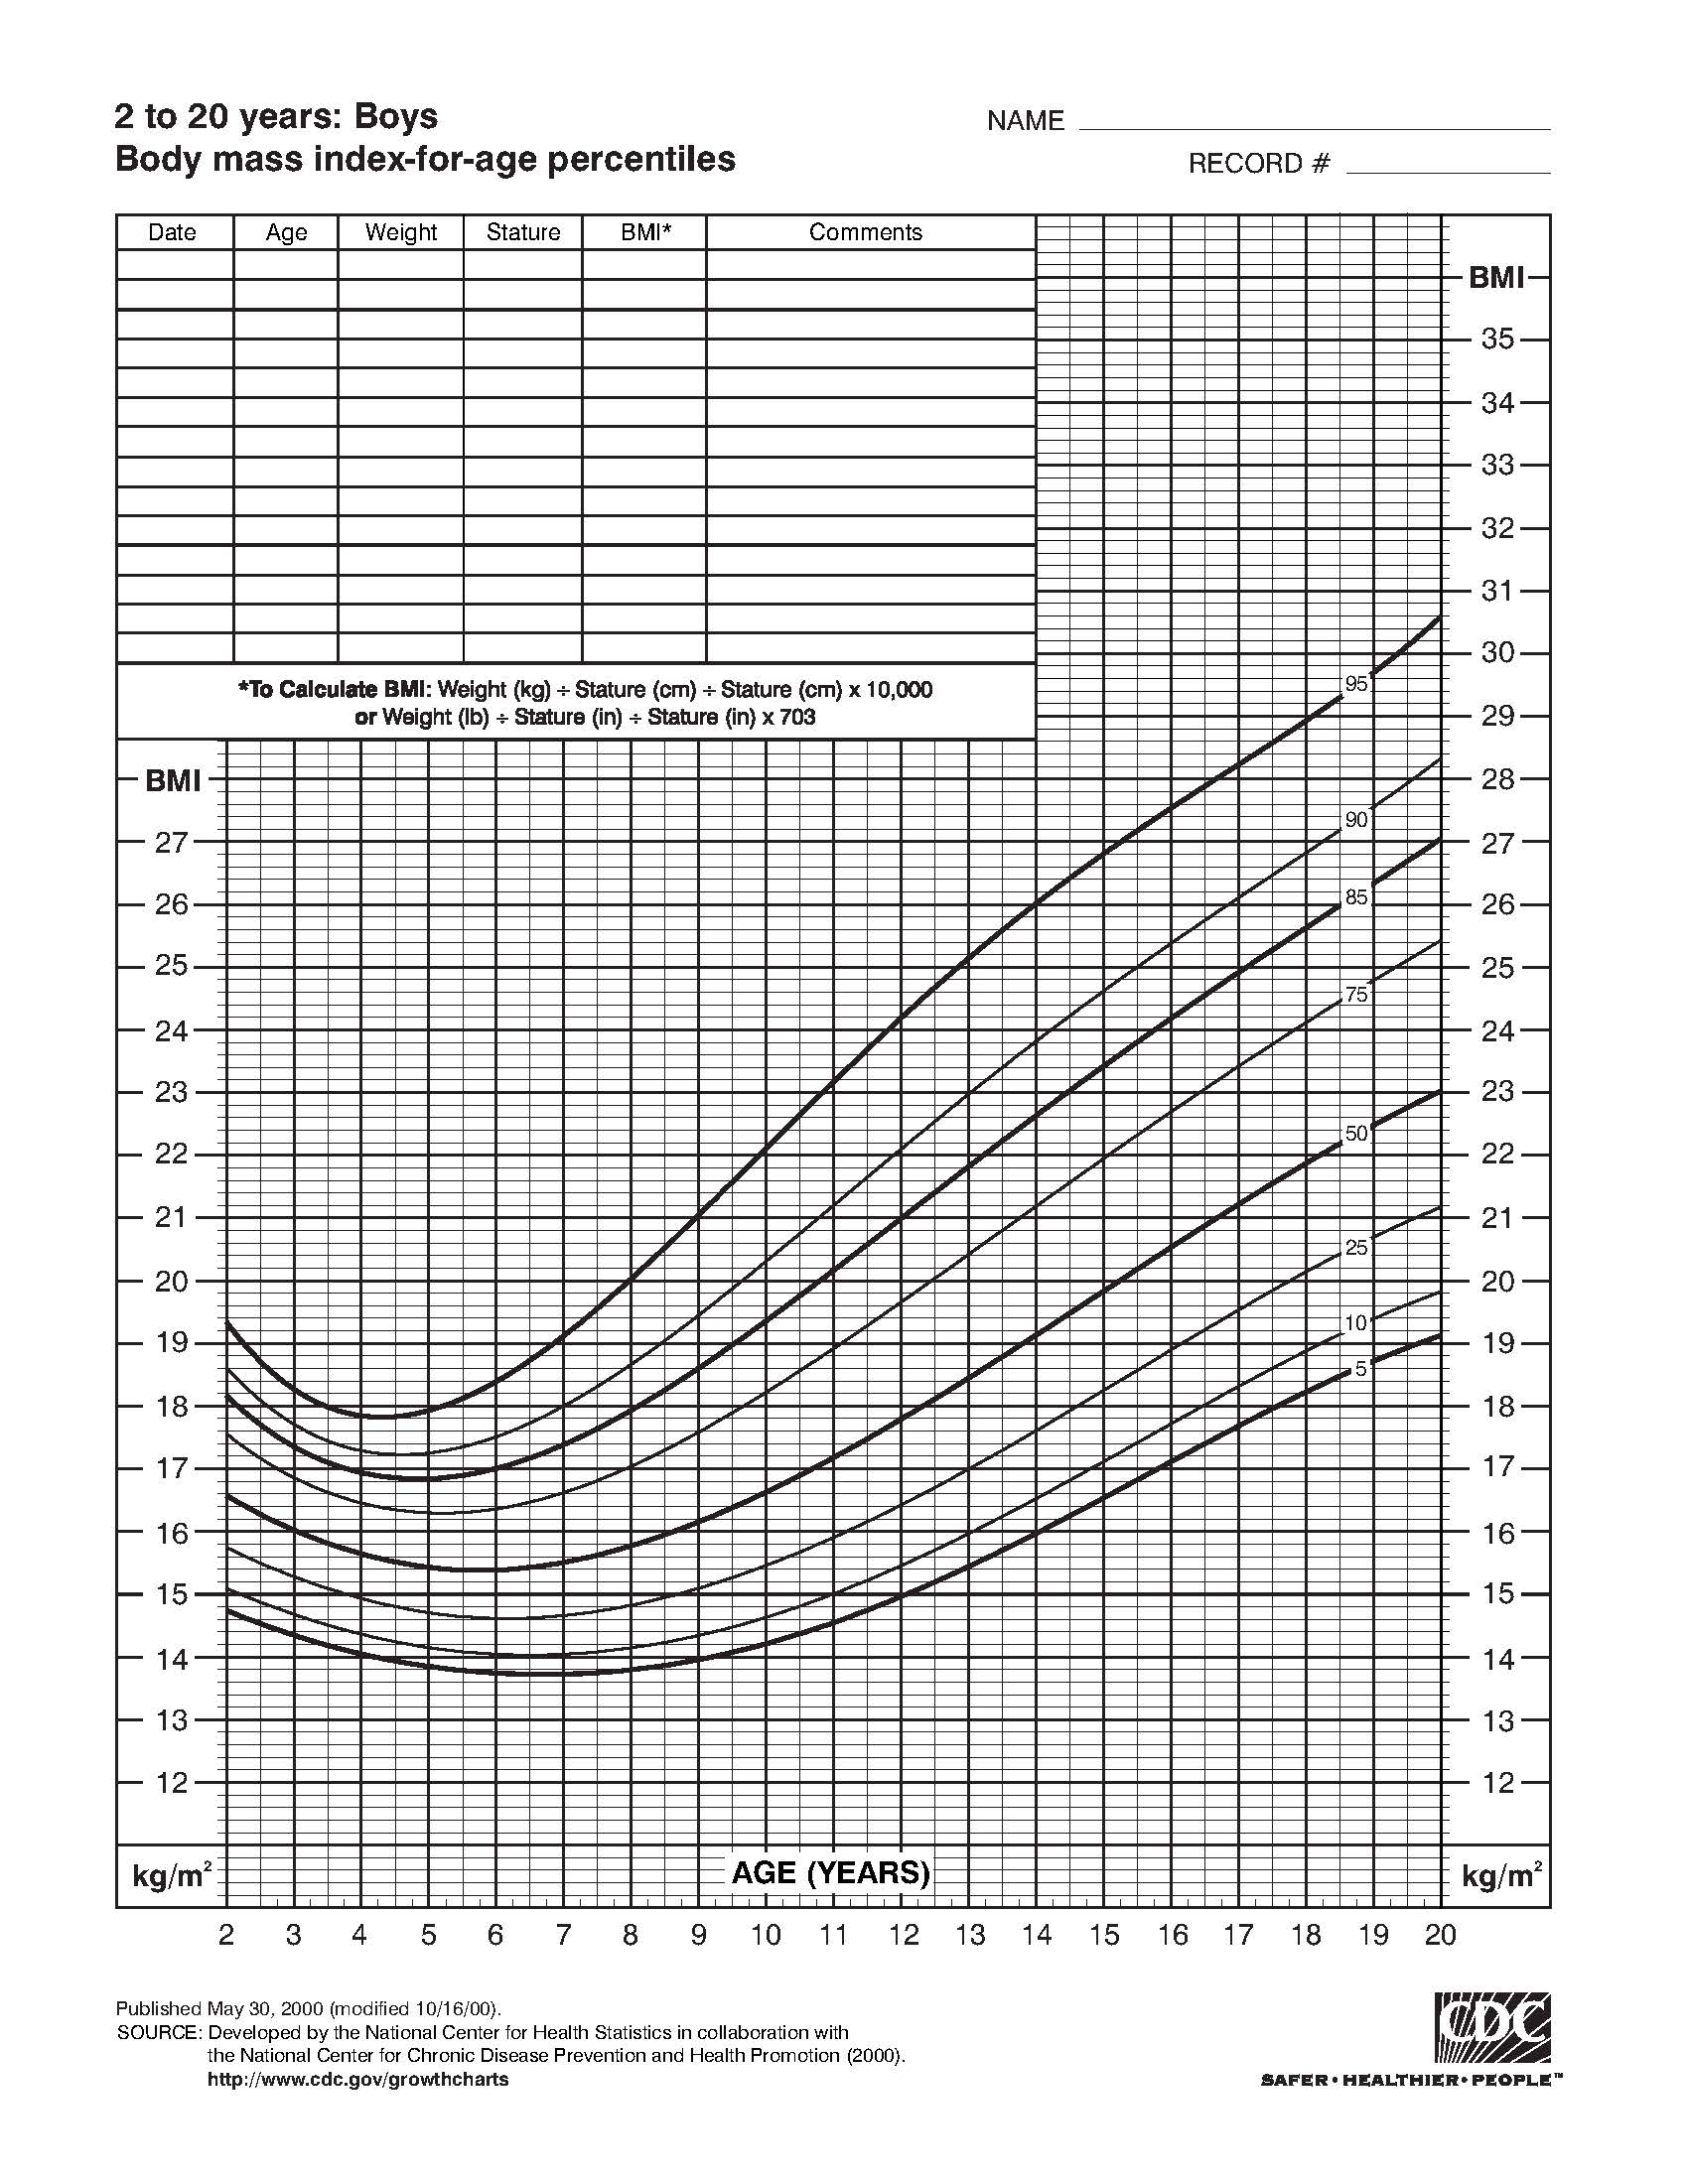
10.4.4 Comparisons of overweight and obesity in children among countries
BMI is accepted as a valid indirect measure of adiposity in children. However, unlike adults, the 50th percentile BMI varies with age as well as weight. Consequently, BMI values in childhood must be compared with age and sex-specific reference data sets. Unfortunately, differences exist in the methods that have been used to construct the curves for the reference data sets, some of which are based on representative national data (e.g., 2000 CDC reference data), whereas others provide international reference data (Cole et al., 2000; WHO, 2006). Marked variations across countries also occur in the terminology used to define the levels of BMI indicative of overweight and obesity. For example, based on the French BMI reference data, “overweight” corresponds to values above the 97th percentile and no cutoff for “obesity” exists (Rolland-Cachera et al., 2002), whereas the US CDC now define overweight as a BMI ≥ 85th percentile but < 95th percentile, and obesity as ≥ 95th percentile. In contrast, WHO apply Z‑scores to indicate “risk of overweight”, “overweight”, and “obesity”, and these differ for children less than and greater than aged 5y (Section 10.4.2). As a result of these differences, comparison of the prevalence of overweight and obesity across countries is challenging, and the prevalence estimates differ even when compared in the same population of children. For example, estimates often appear highest when using the WHO classification systems, intermediate with the 2000 CDC definition, and lowest based on the IOTF definition (Shields & Tremblay, 2010). An additional challenge complicating the interpretation of the data is the absence of international validated gold-standard upper BMI cutoffs for overweight and obesity in childhood. The existing prospective studies in which excess adiposity in children has been associated with risk of cardiovascular disease are limited by small sample sizes (Chung et al., 2018). Moreover, to date, there are no large-scale longitudinal data that relate overweight in childhood with adverse health outcomes in adulthood because of the long-time span required before they appear (i.e., middle-age or beyond) (Wright et al., 2022). This has led to the conventional statistical definitions for the BMI cutoffs for overweight and obesity, with the assumption that the prevalence of overweight or obesity is the same for each age‑ and sex-specific group, even though it appears that older children now experience a greater increase in BMI than younger children. Clearly, an international consensus is necessary before meaningful comparisons between studies of overweight and obesity during childhood can be made (Rolland-Cachera, 2011; Flegel & Ogden, 2011). The current recommendation by the European Childhood Obesity Group (ECOG) is to use the IOTF and WHO definitions for international comparisons of the prevalence of childhood overweight and obesity, despite their limitations. For comparison within countries, however, national age‑ and sex-specific BMI reference data and definitions of overweight and obesity are appropriate (Rolland-Cachera, 2011). Further discussion on the use of international versus national BMI reference data are available in Chinn & Rona (2002) and Reilly et al. (2010). Unfortunately, the evidence to identify children who are truly at risk for future adverse health outcomes arising from overweight or obesity remains insufficient. It appears that the conventional statistical approach to define overweight and obesity is no longer valid and results in overdiagnosis of obesity in younger children when a true measure of total fat mass is determined based on dual energy x‑ray absorptiometry (Vanderwall et al., 2017) or deuterium dilution (Wright et al., 2022). Therefore, more research is urgently needed to improve the diagnosis of childhood obesity and define its adverse health consequences.10.4.5 Using BMI to define thinness in children and adolescents
The term “thinness” was adopted by Cole et al. (2007) to describe a low BMI to avoid confusion with the terms “wasting” (defined by a weight-for-stature< −2 Z‑score) and “underweight” (defined by a weight-for- age < −2 Z‑score). Cole et al. (2007) used the same methods to define grades of thinness in children and adolescents as they used previously to define overweight and obesity in this age group (Section 10.4.1). For each dataset, percentile curves were drawn to pass through the BMI cutoff values of 18.5, 17, and 16kg/m2 at age 18y, consistent with the grades 1, 2, and 3 of thinness used by WHO for adults (Table 10.12). The percentile curve passing through a BMI value of 17kg/m2 at age 18y gave a mean BMI close to a Z‑score of −2, matching the existing WHO criteria for wasting in children less than 5y of age (i.e., weight-for-height below −2 Z‑score). Hence, the authors proposed that this percentile curve should be a basis for an international definition of thinness in children and adolescents. However, a major disadvantage of these childhood BMI cutoffs for thinness is that they are not expressible as BMI percentiles. Consequently, Cole and Lobstein reformulated their international cutoffs for thinness for children aged 2–18y so that BMI could be expressed as percentiles or Z‑scores for comparison with the WHO BMI cutoffs (Cole & Lobstein, 2022). Table 10.13 shows the sex-specific Z‑score cutoffs and their corresponding percentile equivalents to the original international BMI cutoffs (16, 17, and 18.5kg/m2 at age 18y) which are consistent with the grades 3, 2, and 1 of thinness used by WHO for adults (Section 10.3.5). For a comparison of these new cutoffs for thinness with the originals, see Cole & Lobstein (2012).| BMI cutoff at 18y (kg/m2) | SD score equivalent | Percentile equivalent |
| Boys | ||
| 16 | -2.565 | 0.52 |
| 17 | -1877 | 3.0 |
| 18.5 | -1.014 | 15.5 |
| Girls | ||
| 16 | -2.436 | 0.74 |
| 17 | -1.789 | 3.7 |
| 18.5 | -0.975 | 16.5 |