
Gibson RS1,
Principles of
Nutritional Assessment:
Bioavailability of Nutrients
3rd Edition. June, 2025
Abstract
Nutrient intakes calculated from food composition data or determined by direct chemical analysis represent the maximum available to the body and not the amount actually absorbed and utilized. Algorithms have been developed for those nutrients for which the factors affecting their bioavailability are well characterized. Use of these algorithms allows a more reliable assessment of the nutrient adequacy of diets. The earlier algorithms for iron were developed from results of single meal absorption studies now recognized to exaggerate the effects of dietary modifiers on iron absorption. In addition, only the effect of selected dietary modifiers on nonheme iron absorption were considered, with a value of 25% assumed for heme iron absorption. Most recently, an interactive tool based on the probability-based approach has been developed whereby total iron absorption from mixed diets of adults at any level of iron status can be estimated. The newest quantitative zinc algorithms use the trivariate saturation response model to estimate total absorbable zinc for adults, provided intakes of zinc and phytate (a major inhibitor of zinc absorption), are available. Whether these new models are appropriate for young children is uncertain. New terms have been introduced for protein (digestible indispensable amino acid score), folate (dietary folate equivalent), and vitamin A (retinol activity coefficient) to consider the differences in the bioavailability of all sources of these nutrients. However, some uncertainty exists on the bioavailability for the different forms of vitamin D and vitamin E. Currently, both vitamin D2 (ergocalciferol) and vitamin D3 (cholecalciferol) are considered bioequivalent, whereas of the 8 naturally occurring vitamin E analogues, only α-tocopherol is considered by some authoritative groups when measuring vitamin E intake and setting requirements. CITE AS: Gibson RS, Principles of Nutritional Assessment:Bioavailability of Nutrients
https://nutritionalassessment.org/bioavailability/
Email: Rosalind.Gibson@Otago.AC.NZ
Licensed under CC-BY-4.0
( (PDF)
4b.0 Assessment of bioavailable nutrient intakes
Nutrient intakes calculated from food composition data or determined by direct chemical analysis represent the maximum amount of nutrient available to the body. For most nutrients, however, the amount actually absorbed and used by the body is lower than the total intake. The term “bioavailability” is defined as the proportion of the ingested nutrient that is absorbed from the diet and utilized for normal body functions (Chapt17, section 17.1.7, Lynch et al., 2018). Nutrients that are readily taken up following ingestion are termed “bioavailable.” With the increasing use of food fortification / enrichment and dietary supplements worldwide, care must be taken to ensure that the bioavailability (as well as the amount) of any potential fortificant and supplement in the food supply of a country is also considered, so their contributions can be taken into account when estimating the nutrient composition and bioavailability of the total diet. However, because the level of fortification/enrichment is country-specific due to different food standards in each country, caution must be used if food composition values are borrowed from other countries. Depending on the nutrient, bioavailability may be influenced by diet and host-related factors independently and in combination. In general, diet-related factors have less influence on the bioavailability of the macronutrients than micronutrients. Examples of dietary factors include the chemical form of the nutrient and nature of the dietary matrix, interactions among nutrients themselves or with other organic components in the diet, and pretreatment of food from processing and/or preparation practices. At present, the dietary factors influencing the bioavailability of many nutrients are not well established (Gibson, 2007). Information on the host-related factors is often limited, so their effects on nutrient bioavailability are often ignored. Moreover, the extent to which host-related factors influence absorption and/or utilization varies with the nutrient, life-stage group, and environment. Host-related factors are often classified as intestinal or systemic factors. Intestinal factors influence the efficiency of luminal and mucosal digestion and absorption through reductions in the secretion of hydrochloric acid, gastric acid, and intrinsic factor, as well as from alterations in the permeability of the intestinal mucosa. Of these, atrophic gastritis is considered one of the most significant luminal factors influencing nutrient bioavailability, mainly through its association with hypochlorhydria. The latter is characterized by a progressive decrease in the capacity of the parietal cells of the stomach to secrete hydrochloric acid. In children in low-income countries, hypochlorhydria often arises from infection with the bacterium Helicobacter pylori. As a result of the hypochlorhydria, absorption of folate, iron, calcium, and zinc, and the bioconversion of β‑carotene to vitamin A may be impaired (Gibson, 2007). Bacterial overgrowth in the proximal small intestine also occurs with atrophic gastritis. This condition often exacerbates vitamin B12 deficiency because the bacteria may take up any freed vitamin B12 from food. Small intestinal bacterial overgrowth is also a manifestation of environmental enteropathy (EE) (also known as environmental enteric dysfunction (EED). EE/EED is an acquired subclinical condition predominantly affecting the gut of children in low-income countries. EE/EED is hypothesized to be caused from continuous exposure to fecally contaminated food and water and is characterized by multiple abnormalities. These may include loss of intestinal barrier function and low-grade intestinal inflammation, which together result in atrophy of the villi of the small intestine. Increasingly, linear growth faltering, poor neurocognitive development, and oral vaccine low efficacy is being associated with EE/EED in childhood (Watanabe & Petri, 2016; Fasano, 2024). Of the systemic factors that can influence absorption and utilization of nutrients, age, physiological status (e.g., pregnancy or lactation), and nutrient status of the host are those most frequently considered. Coexisting infectious illnesses also impact the bioavailability of nutrients through several mechanisms, including decreased absorption, increased losses, and sequestration of nutrients in the liver or other sites. There is also increasing evidence that the absorption of certain nutrients may also be affected by ethnicity, lifestyle (e.g., smokers, oral contraceptive users), genotype, environmental pollution (e.g., lead pollution) and chronic disease (e.g., asthma, diabetes (Kang et al., 2021). For more discussion of these diet- and host-related factors, see Gibson (2007). For some nutrients, mathematical models termed algorithms have been developed to predict nutrient bioavailability. These mathematical models attempt to predict bioavailability by considering the amount and form of the nutrient (where applicable), the presence of dietary enhancers and inhibitors, and in some cases, the nutrient and health status of the individual. The models then apply certain general principles to the complex whole-diet matrix. Unfortunately, for many nutrients, algorithms have not been developed to predict bioavailability due to the paucity of data. Notable exceptions are the algorithms available for iron, zinc, protein, folate, vitamin A, and vitamin E. Clearly, many factors can limit the accuracy of the algorithms (Hunt, 2010). Hence, as new research findings emerge, algorithms must be modified on an ongoing basis. Currently, the effects of only some of the dietary modifiers and host-related factors are considered in the bioavailability algorithms available.4b.1 Bioavailability of iron
Two forms of iron are present in foods: heme iron and nonheme iron. Heme iron is bound in a porphyrin ring and is derived mainly from hemoglobin and myoglobin in meat, poultry, and fish. The proportion of heme iron in lean meat, poultry and fish is variable and ranges from about 30% in white meats to about 70% in red meats. In individuals consuming omnivorous diets, heme iron contributes only about 10‑ of the total iron consumed, but because of its efficient absorption, it can provide over 40% of the total iron absorbed (Hurrell & Egli, 2010). Nonheme iron is found primarily as iron salts in a variety of foods of both plant and animal origin, and possibly as contaminant iron introduced by food processing and the soil (Harvey et al., 2000; Gibson et al., 2015). Each form of iron is absorbed by separate pathways; heme iron is absorbed as the intact iron porphyrin, whereas nonheme iron is absorbed from the common pool within the gastrointestinal tract. However, once inside the mucosal cells of the small intestine, all iron enters a common pool (Hurrell & Egli, 2010; Lynch et al., 2018). Of the two dietary iron forms, heme iron is much more readily absorbed than nonheme iron, with absorption ranging from 10-40%, depending on the iron status of the individual, compared to 2‑20% for nonheme iron. Absorption of heme iron is little affected by dietary factors; absorption is regulated primarily in response to total body iron. As demand for body iron increases there is a corresponding upregulation in the uptake of heme iron. For example, in iron-deficient individuals, absorption of heme iron can increase to 40% whereas in those who are iron- sufficient, only 10% of heme iron may be absorbed (Hallberg et al., 1998). The absorption of nonheme iron, in contrast to heme iron, is modified by the ingestion of several dietary components when consumed in the same meal as well as the level of iron stores of the individual. Dietary components that inhibit nonheme iron absorption include phytate, polyphenols, and peptides from partially digested proteins (e.g., soybean protein). Phytic acid (myo-inositol hexakisphosphoric acid and its associated magnesium, calcium, or potassium salts collectively termed phytate, are present in high concentrations in unrefined cereals, legumes, and oleaginous seeds. In unrefined cereals, phytate is typically concentrated in the outer aleurone layer, except for maize, where it is mainly in the germ. In legumes and most oilseeds, phytate is uniformly distributed within the protein bodies of the endosperm or kernel (Gibson et al., 2018). Phytic acid (myo-inositol hexakisphosphoric acid) is made up of an inositol ring with six phosphate ester groups (i.e., InsP6) and is the most abundant form of myo-inositol phosphate found in mature, unprocessed, plant-based foods. Phytic acid is the main inhibitor of nonheme iron absorption, forming insoluble complexes with iron (and other minerals) in the upper gastrointestinal tract which cannot be digested or absorbed by humans because of the absence of intestinal phytase enzymes (Iqbal et al., 1994). Several food preparation and processing methods such as soaking, germination, fermentation, and milling can lead to reductions in phytic acid, either by loss of water-soluble phytic acid, or by hydrolysis by phytase enzyme of phytic acid to lower myo-inositol phosphate forms that no longer inhibit nonheme iron absorption (i.e., IP2; IP1).The negative effect of phytate on iron absorption is dose dependent, with phytate-to-iron molar ratios less than at least 1:1, and preferably less than 0.4:1 before iron absorption is enhanced (Gibson et al., 2018). Polyphenol compounds from beverages such as tea, coffee, cocoa, and red wine, vegetables (spinach, aubergine), legumes (colored beans), and cereals such as red sorghum, also inhibit non- heme iron absorption. Their inhibitory effect is dose-dependent, the strength depending on the structure of the phenolic compounds, with the gallate-containing tea polyphenols having the largest inhibitory effect (Brune et al., 1989; Hurrell et al., 1999). Calcium inhibits both nonheme and heme iron absorption, although the inhibitory effect is weak and short-term, especially in complex meals containing absorption enhancers (Abioye et al., 2021). The mechanism is not well understood (Lynch et al., 2018}. Peptides from partially digested proteins such as casein, whey, and egg white have also been shown to inhibit nonheme iron absorption (Hurrell et al., 1988). Reductions in iron absorption associated soybean protein have also been reported, an effect which appears to be independent of its phytate content (Hurrell et al., 1992). Both ascorbic acid and muscle tissue from meat, poultry, fish and liver, enhance nonheme iron absorption when eaten in meals containing inhibitors (Lynch et al., 2018}. Of these, ascorbic acid is the most potent enhancer of nonheme iron absorption through its ability to convert ferric (Fe3+) iron to ferrous (Fe2+) iron at low pH as well as its chelating properties (Conrad & Schade, 1968). The enhancing effect of ascorbic acid is dose-dependent and most marked when consumed with meals that contain high levels of inhibitors, including phytate and polyphenols. Ascorbic acid can also enhance absorption of many iron fortification compounds (Hurrell et al., 2004), except NaFeEDTA (Troesch et al., 2009). The enhancing effect of ascorbic acid on iron absorption, however, is removed by cooking, industrial processing, and storage all of which degrade ascorbic acid (Hurrell & Egli, 2010). The mechanism whereby muscle tissue enhances nonheme iron absorption is not clear. It may be linked to cysteine-containing peptides released during digestion, which have the potential to reduce ferric (Fe3+) iron to ferrous (Fe2+2+) iron and chelate iron as described for ascorbic acid (Taylor et al., 1986). Host-related factors influencing absorption and utilization of iron include the iron status of the individual and physiological status. For example, there is a well established inverse relationship between the size of the body iron store and absorption of iron in healthy individuals so that when iron stores are sufficient, less iron is absorbed, as noted earlier (Cook & Skikne, 1982; Hallberg & Hulthén, 2002). During pregnancy, fractional absorption of iron from the diet is enhanced by the increased demand for iron and the supression of hepcidin, especially during the third trimester (Barrett et al., 1994). Ethnic differences in iron homeostasis have also been reported, with higher concentrations of iron status indicators (serum ferritin, transferrin saturation, and hemoglobin) in East Asians than Europeans, African Americans, or South Asians, although the genetic determinants of these differences are unknown (Kang et al., 2021). Inflammation and obesity are also known to play an important role in iron bioavailability although their effects have only been considered in the more recent algorithms (Collings et al., 2013; Fairweather Tait et al., 2020). During inflammation and obesity, there is an increase in levels of pro-inflammatory cytokines in the systemic circulation, which in turn increase hepatic synthesis of hepcidin levels. Elevated serum hepcidin levels reduce both intestinal absorption of iron as well as the release of iron from body stores (Hurrell & Egli, 2010; Collings et al., 2013). The earlier algorithms estimating iron bioavailability were developed from results of isotopically labeled single meal absorption studies now recognized to exaggerate the effect of dietary enhancers and inhibitors and other factors on iron absorption (Armah et al., 2013). As well, individuals may adapt to the effect of dietary modifiers on iron absorption after prolonged exposure (Hunt & Roughead, 2000). Moreover, initially only the effects of the enhancers of nonheme iron absorption (i.e., ascorbic acid and animal flesh) were considered, with absorption of heme iron assumed to be 25% and to account for 40% of the iron in meat, poultry or fish (Monsen & Balintfy, 1982). Later, algorithms became more complex and included differing numbers of both dietary enhancers and inhibitors of nonheme iron absorption (Murphy et al., 1992; Tseng et al., 1997; Hallberg & Hulthén, 2000; Reddy, 2005; Rickard et al., 2009). Of these, the model of Hallberg and Hulthén (2000) is the most detailed and considered the effects of all known modifiers of nonheme iron absorption, interactions, as well as adjustments for the iron status of the individual. High iron stores are known to increase the expression of hepcidin which reduces iron absorption, whereas with low iron stores hepcidin expression is reduced so iron absorption increases (Franchini et al., 2010). However, the model of Hallberg and Hulthén (2000) is difficult to apply, in part because of incomplete food composition data for the absorption modifiers. For a detailed review of these early algorithms, see Reddy (2005). More recently, several algorithms have been developed to predict the bioavailability of iron in whole diets because of the known exaggerated effects of the dietary modifiers on bioavailability when based on single test meals (Cook & Reddy, 2001). In some of these newer algorithms the form of the iron (i.e., heme or nonheme iron), the content of several known dietary enhancers and inhibitors in the diets, and the iron status of the individual are considered. None, however, attempt to estimate the simultaneous effects of enhancers and inhibitors on iron absorption. Some of the models only predict nonheme iron absorption so assumptions about the absorption of heme iron must be made; 25% is the value most frequently assumed (Murphy et al., 1992; Armah et al., 2013). A further limitation is that phytate values, when included, generally represent the sum of all the myo-inositol phosphate forms in foods rather than only those forms known to inhibit nonheme iron absorption (i.e., InsP6 to IP3) (Tseng et al., 1997; Armah et al., 2013). Using the values for total inositol phosphates is likely to increase the apparent negative impact of InsP6 in the models, thus compromising the ability of the models to accurately predict iron absorption. However, a new global food composition database that includes values for InsP6 and lower myo-inositol phosphate forms (and iron, zinc, and calcium) of plant-based foods, together with details of the processing and analytical methods is now available, enabling users to select myo-inositol phosphate values based on the most appropriate processing and analytical method (FAO/INFOODS/IZiNCG, 2018). Nevertheless, all algorithms have limitations often under-estimating bioavailability when compared with measured absorption. Reports have shown a 3-fold variation in bioavailability estimated by applying different algorithms (Beard et al., 2007; Atkins et al., 2024). Ultimately, the choice of an algorithm to use depends on the population under study, and the type of dietary and biochemical data available. Some examples of algorithms applicable for the diets of children and adults are described briefly below.4b.1.1 FAO/WHO semi-quantitative model
This semi-quantitative classification was based on results from isotopically labeled iron absorption studies on typical single meals in Asia, India, Latin America, and Western countries. FAO/WHO estimated dietary iron bioavailability for three different categories of diet that relate to the amount of meat and dietary iron absorption modifiers, as shown in Box 4b.1, although they do not quantify the exact amounts.
Box 4b.1: FAO/WHO semi-quantitative model to estimate iron bioavailability
Note the estimates of absorption given in Box 4b.1 refer to non-anemic individuals with normal
iron transport (i.e., with normal hemoglobin concentration) but no iron stores. When individuals
have iron deficiency anemia (i.e., low hemoglobin and no iron stores), absorption may be
increased by 50 percent (i.e., increasing to percentages of 7.5, 15, and 22.5, respectively, in
absorption for the low, intermediate, and high-bioavailability diets)
(FAO/WHO, 2002).
Note that for Western-type diets, FAO and WHO now propose two
categories of bioavailability — 12%
and 15% — depending on the meat content of the diet.
There are no data available validating the
results of this model in relation to the iron status of populations
(Reddy, 2005).
- Low-bioavailability diet (iron absorption of about 5 percent): a simple, monotonous diet containing cereals, roots and/or tubers, and negligible quantities of meat, fish, or ascorbic acid-rich foods
- Intermediate-bioavailability diet (iron absorption of about 10 percent): a simple, monotonous diet containing cereals, roots, and/or tubers, and minimal quantities of food of animal origin and ascorbic acid, both of which promote iron bioavailability
- High-bioavailability diet (iron absorption of about 12 or 15 percent depending mainly on the meat content): a diversified diet containing generous quantities of meat, poultry, fish, and/or foods containing high amounts of ascorbic acid.
4b.1.2 Model of Murphy et al. (1992)
This model was adapted from the algorithm of Monsen & Balintfy (1982) to estimate iron bioavailability in diets of children in low-income countries. In this algorithm, heme iron absorption is assumed to be 25%, and to account for 40% of the iron in meat, poultry, and fish. The absorption of nonheme iron is assumed to be lower and to vary according to the amount of meat, poultry, and fish, ascorbic acid, and polyphenols, as well as the level of iron stores of the individual. The inhibitory effect of phytate on iron absorption is not considered in this model. To use this algorithm, quantitative data on the intake of heme iron, nonheme iron, and two enhancers--ascorbic acid and protein from meat, poultry, and fish--are required. The cut-offs applied for these two enhancers are those derived from Monsen but are expressed per 4.18 MJ (1000 kcal), so that the same algorithms can be used for males and females across all age groups. The percentage levels for the bioavailability of nonheme iron given for each class and shown in Table 4b.1 approximate those of the typical meals of the low, medium, high bioavailability categories of the FAO/WHO algorithm.| Ascorbic acid (mg / 4.18 MJ) | Meat + fish + poultry protein (g/4.18MJ) | ||
|---|---|---|---|
| <9 | 9-27 | >27 | |
| < 35 | 5 | 10 | 15 |
| 35–105 | 10 | 15 | 15 |
| >105 | 15 | 15 | 15 |
4b.1.3 Algorithm of Tseng et al. (1997)
This was the first algorithm to adjust iron availability for the inhibitory effect of phytate. The model was adapted from that of Murphy et al. (1992) and included an adjustment for the enhancing effects of meat, poultry, and fish and vitamin C on nonheme iron absorption, followed by a further separate adjustment for the inhibiting effects of both tea and phytate. Heme iron availability was assumed to be 23% in this model, lower than that assumed for Murphy’s model (i.e., 25%). To use this algorithm, both the nonheme and heme iron content of each food consumed on each eating occasion by each individual in the study sample must be included in the nutrient composition database. To derive these estimates, nonheme iron is assumed to be 60% and 100% of the total iron in meats and non-meats, and the remaining iron (if any) is assumed to be heme. This algorithm has had limited use. It was used to estimate the intake of bioavailable iron in both rural and urban children and women in Russia (Tseng et al., 1997), and in preschoolers in Australia (Atkins et al., 2024). Note neither this algorithm nor the one developed by Murphy et al. (1992) attempted to quantify interactions among the dietary factors or adjust for the inclusion of calcium or the proportion of iron derived from fortification.4b.1.4 Algorithm of Armah and co-workers (2013)
This algorithm was used to estimate iron absorption from the US whole-day diet and considered the mean intake of inhibitors (phytate, polyphenols, calcium) and enhancers (ascorbic acid) and the proportion of heme and nonheme iron. The datasets used were from four diet studies designed to measure the effects of ascorbic acid, meat, tea, and calcium on nonheme iron absorption from 5-d complete diets of US male and female adults aged 19-38y (n=53) measured using an extrinsic radio labeling technique. Each participant in the studies was assessed for three one-week periods during which they consumed diets that were typical, high, or low in meat, tea, calcium, or vitamin C. Iron status of the adults was measured using serum ferritin. Absorption of heme iron was assumed to be 25% in this model. Multiple linear regression was used to quantify the effect of different factors on nonheme iron absorption. The investigators claim the algorithm can be used to predict nonheme iron absorption from the diets of different populations. The final fitted regression model for nonheme iron absorption in adults is: \[\small \mbox {Ln Absorption (%)=6.294 – 0.709 ln (SF) + 0.119 ln (C)}\] \[\small \mbox {+ 0.006 ln (MFP + 0.1) −0.055 ln (T + 0.1)}\] \[\small \mbox { – 0.247 ln (P) – 0.137 ln (Ca) – 0.083 ln (NH)}\] Where SF is serum ferritin (µg/L); C is vitamin C (mg); MFP is meat, fish, poultry (g); T is tea (number of cups); P is phytate (mg); Ca is calcium (mg); NH is nonheme iron (mg) The investigators validated this algorithm with single meal and complete diet data and reported the r2 values as 0.57 (p 0.001) for the single meals and 0.84 (p <0001) for the complete diet data. When applying this algorithm, the mean daily intake of nutrients based on at least 3 days of diet records should be determined and serum ferritin concentrations in each participant measured. Of the factors explaining differences in nonheme iron absorption, serum ferritin was the most important; the effect of the dietary modifiers was small. Between-person variation explained a large proportion of the differences in nonheme iron absorption, possibly attributed to other host-related factors besides iron status, such as inflammation and obesity. Further studies are needed to identify other unknown non-dietary factors affecting nonheme iron absorption. Armah et al. (2015) applied this algorithm to estimate both nonheme iron absorption and the total iron bioavailability from the US diet using information on dietary intakes and iron biomarkers from the NHANES 2001-2002 survey. Iron biomarkers included serum ferritin, hemoglobin, and C-reactive protein. For each individual, daily intakes for total iron, vitamin C, meat poultry, fish, calcium, phytate, and polyphenols (as black tea equivalents) were obtained. Of the total iron intake, 90% was estimated as nonheme iron and 10% as heme iron, with a value of 25% for heme iron absorption. In this study, nonheme iron absorption was estimated at the individual level and geometric means estimated by age and gender, and by gender and ethnicity. The unadjusted geometric mean (95% CI) of unadjusted nonheme iron absorption for all individuals was 3.7% (3.6%, 3.8%), and higher in females that males. Two approaches were used to estimate total iron absorption. In the first approach all the participants of the survey were included but the geometric mean of nonheme iron absorption was adjusted to 15µg ferritin/L serum to correspond to values of individuals with no iron stores. In the second approach absorption of nonheme iron was estimated only for nonanemic individuals with no iron stores. Using the two approaches, after correcting individual nonheme iron absorption values and adding fractional absorption from heme iron (i.e., 25%), the calculated percentages of total dietary iron absorption for US diets were 15.5% and 15.1%, compared with the current estimate of 18% (IOM, 2001). See Armah et al. (2015) for details of the equations used for these calculations. The authors cautioned that estimating total iron absorption for all individuals without adjusting for serum ferritin is not advisable because the value obtained underestimates iron absorption for individuals with low iron stores while overestimating absorption for those with very high iron stores. Instead, by adjusting nonheme iron absorption to 15µg ferritin/L serum as carried out in their first approach, absorption is only overestimated in those individuals with adequate iron stores.4b.1.5 Algorithm of Collings and co-workers (2013)
These investigators conducted a systematic review and calculated nonheme iron absorption from pooled data on iron status (serum or plasma ferritin) and dietary modifiers based on five isotope studies on whole diets of 58 U.S adults > 18y. Studies that included participants with unspecified illness or disease were excluded except those with iron deficiency or iron deficiency anemia. From the individual data, a regression equation for nonheme iron absorption was derived based on a simplified scoring system. The latter was used to classify diets in view of the limited effect of the dietary factors on nonheme iron absorption in healthy iron-replete individuals. Age and sex were shown to have no effect and hence were not included in the regression equation shown below: \[\small \mbox {Log[nonheme-iron absorption, %]}\] \[\small \mbox {= −0.73 log[ferritin, µg/L] + 0.11[modifier] + 1.82}\] Where [modifier] is 0 for standard diets, -1 for diets that include an inhibitor, and +1 for diets that include an enhancer. Note this equation was used to predict the effect of dietary modifiers on percentage absorption of nonheme iron in individuals with low to high serum ferritin concentrations (6‑80µg/L). Within this range of serum ferritin concentrations (6‑80µg/L), predicted absorption values for nonheme iron ranged from 2.1 to 23.0%, depending on iron status and type of diet. For individuals with low iron stores (serum ferritin 12µg/L) consuming a standard diet, non-heme iron absorption was predicted to be 10.8%, increasing to 13.9% when a higher bioavailability diet (low calcium, high vitamin C, high meat) was consumed, and decreasing to 8.4% in a lower bioavailability diet (high calcium, low vitamin C, no meat). This algorithm only requires information on the iron status (serum or plasma ferritin) of the population coupled with assumptions about the type of whole diet based on the presence of enhancers and inhibitors. The authors emphasize that many of the studies included, although on whole diets, were of very short duration and did not reflect the diets consumed over time. Such short-term measurements of absorption may overestimate differences in iron bioavailability between diets, as noted earlier (Hunt & Roughead, 2000). In addition, because the individual iron absorption data pooled to develop the regression equation was from US studies and based on young adults, the regression equation should not be extrapolated to predict absorption of nonheme iron from low-income countries or for men and women of different ages.4b.1.6 Probability-based approach of Dainty and co-workers (2014)
To estimate total absorption of dietary iron using the algorithms of Armah et al. (2013) and Collins et al. (2014), an estimate of the quantity of absorbed heme iron using an assumed absorption value must be added to the value for predicted nonheme iron absorption. In contrast, the probability-based approach of Dainty et al. predicts total dietary iron absorption (both heme and nonheme iron) at the population level and can provide estimates of total iron absorption from a mixed Western-style diet at any level of iron status. For this approach, measurements of serum ferritin, intakes of total iron (heme and nonheme iron), and factorial calculations of iron requirements for the population are required. However, unlike most of the earlier algorithms, no data on dietary iron absorption modifiers or heme iron are required. Furthermore, estimates of dietary iron bioavailability can be made not just for adult individuals with low storage age (defined by serum ferritin of 15µg/L), but for any selected mean serum ferritin level. Nevertheless, the method cannot be used for children, pregnant women, and individuals immediately after menopause because of their changing iron requirements. In addition, care must be taken to ensure the serum ferritin concentrations are not confounded by inflammation/infection or obesity by employing the BRINDA correction method (Namaste et al., 2017). This novel approach was developed using adult data on dietary intakes from a mixed Western-style diet (via 7d diet diary), hematological measures (hemoglobin and serum ferritin) from a representative group of men (n=495; mean age 42.7±12.1y) and pre-menopausal women (n=378; mean age 35.7±8.2y) from the 2000‑2001 adult cohort of the UK National Diet and Nutrition Survey (NDNS). Individuals with elevated serum ferritin concentrations due to inflammation (i.e., elevated α‑1‑antichymotrypsin) or those taking iron supplements were excluded. The first step involved estimating the distribution of dietary iron requirements for the NDNS study sample. This was achieved by employing the factorial modeling developed by the US Institute of Medicine (IOM, 2000) that calculated the distribution of estimated iron requirements needed to meet body functions with a minimal iron store for several age and sex groups. The IOM values for pre-menopausal women (mixed population of oral contraceptive users and non-users) and men were used. The derived dietary iron requirements for the UK NDNS study sample were converted to requirements for absorbed iron for individuals with low levels of storage ion but were not anemic by multiplying by 0.18 (U.S. IOM values assume 18% iron absorption from a US mixed adult diet). In addition, a full probability approach was also applied to the dietary iron intake data from the UK NDNS to predict the prevalence of a dietary iron intake that would be sufficient to maintain iron balance for the men and women based on their estimated daily iron intake and a series of percentage iron absorption values from 1‑40%. An average dietary iron absorption in the population sample was then calculated for selected serum ferritin concentrations by matching the observed prevalence of inadequacy (i.e., from prevalence of serum ferritin below the designated level) with the prevalence predicted for the range of absorption estimates (from 1‑40%). Using this approach, the mean calculated dietary iron absorption was 8% in men (50th percentile for serum ferritin 85µg/L) and 17% in women (50th percentile for serum ferritin 38µg/L). With a serum ferritin level of 45mg/L, the estimated absorption for iron was similar for both men (14%) and for women (13%) (Dainty et al., 2014). The European Food Safety Authority (2015) applied this approach to predict total iron absorption in European diets and selected a target value of 30µg/L for serum ferritin concentrations for men and premenopausal women because this reflects iron stores of approximately 120mg. At this level of ferritin, the predicted iron absorption values for European men and premenopausal women were 16% and 18%, respectively (EFSA, 2015). An interactive tool based on the probability approach has been developed for estimating total dietary iron absorption in adult populations with a selected target serum ferritin concentration; for more details see Fairweather-Tait et al. (2017). To download the correct table, see Dainty et al. (2024). Note that because both the iron requirements and dietary iron must be in a steady state for at least a year when applying this approach, it is not suitable for certain groups, as noted earlier. Care must be taken to ensure the appropriate correction for the impact of inflammation on serum ferritin concentrations is performed, when necessary (see “Acute and chronic inflam- mation” in Chapter 17, Section 17.7.1 for more details). Subsequently, additional data from a nationally representative survey in Ireland and data collected in older people in the UK have been included in the model (Fairweather-Tait et al., 2017). This predictive model has also been used in women of child-bearing age from Benin to estimate country-specific percentage iron absorption at different levels of iron status (Fairweather-Tait et al., 2020). For diets in Benin in which 29% of iron was from cereals and 30% from animal products, predicted iron absorption was 6% at a serum ferritin value of 30µg/L compared with 18% for the Western diet reported earlier (EFSA, 2015). Moreover, iron absorption remained low until the serum ferritin fell below 25µg/L. More work is required to adapt the existing model for adults from other low and middle-income countries in which intakes of iron absorption inhibitors may be higher and heme iron intakes lower than those in whole diets in Benin.4b.2 Bioavailability of zinc
The absorption of dietary zinc, unlike iron, does not change in response to alterations in whole- body zinc homeostasis or status. Instead, zinc absorption is influenced by current zinc intake, not the past or long-term zinc intakes, or status. With increasing zinc intakes, the total amount of absorbed zinc over the whole day increases while the percent absorbed (i.e., fractional absorption) declines (Figure 4b.1). Fractional zinc absorption is determined by dividing the amount absorbed by the amount digested.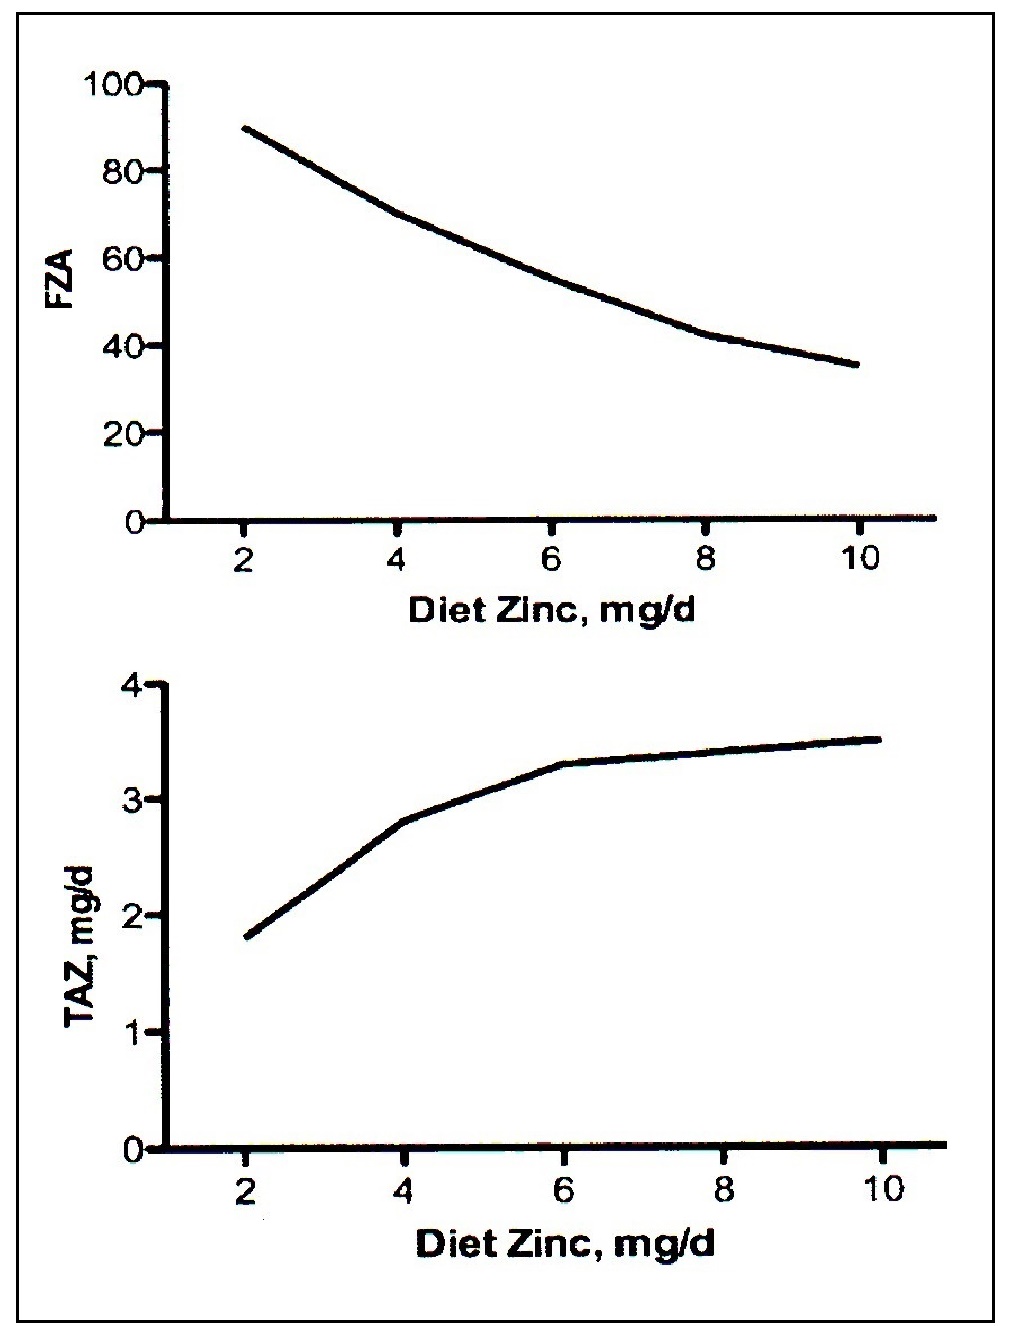
4b.2.1 WHO semi-quantitative classification for bioavailable zinc
This was developed in 1996 by WHO and adopted by FAO and WHO in 2002 and in 2004. WHO applied zinc absorption data from published isotope studies on adults that focused mainly on single meals, individual foods, and some whole-day diets. To determine the proportion of dietary zinc that was absorbed by the intestine (i.e., fractional zinc absorption), the mean amount of absorbed zinc was regressed against total zinc intakes from diet types that differed in their composition. The WHO system takes into account three dietary variables, considered important predictors of the bioavailability of zinc at that time. These include the amount and source of dietary protein, the proportion of phytic acid to zinc in the whole diet, and high levels of calcium, particularly calcium salts, as noted earlier. In general, however, the calcium content of most plant-based diets is probably too low to have any detrimental effect. No allowance for an adaptive response to meet the additional physiological demands for zinc during pregnancy or lactation was considered by WHO in view of the paucity of data at that time. The FAO/WHO (2004) system of classifying diets into three broad categories of low, moderate, and high zinc bioavailability is described in Box 4b.2.
Box 4b.2: FAO/WHO semi-quantitative model for estimating the bioavailability of zinc
Low-bioavailability diets: zinc absorption of about 15%. Such diets are characterized by:
As noted earlier, because of the conflicting effects of calcium and the limited effect of dietary
protein on zinc absorption, neither calcium or protein are included in more recent zinc
bioavailability algorithms.
- diets high in unrefined, unfermented and ungerminated cereal grains (e.g., flat breads or sorghum), especially when fortified with inorganic calcium salts and when intake of animal protein is negligible;
- diets in which the phytate : zinc molar ratio typically exceeds 15 or 18;
- diets in which high-phytate soy-protein products constitute the primary protein source;
- diets in which approximately 50% of the energy intake is accounted for either by one or a combination of the following high-phytate foods: high-extraction-rate (>90%) wheat, rice, maize grains and flours, oatmeal and millet (chapatti flours and tanok), sorghum, pigeon peas, grams, blackeye beans, kidney beans, groundnut flours; and
- diets that have high intakes of inorganic calcium salts (more than 1g Ca++/d) either as supplements or as adventitious contaminants (e.g., from calcareous geophagia) which potentiate the inhibitory effects of low-availability diets; low intakes of animal protein exacerbate these effects.
- mixed diets containing animal or fish protein;
- lacto-ovo, ovo-vegetarian, or vegan diets not based primarily on unrefined cereal grains or high-extraction-rate flours;
- diets in which a phytate : zinc molar ratio of the total diet is within the range of 5 to 15 or not exceeding 10 if more than 50% of the energy intake is accounted for by unfermented, unrefined cereal grains and flours while the diet is fortified with inorganic calcium salts (more than 1g Ca++/day);
- modern diets in which the bioavailability of zinc improves when the diet includes animal protein or other protein sources or milks;
- refined diets low in cereal fiber, with a low phytic acid content and with a phytate : zinc molar ratio less than 5; and adequate protein content, mainly from non-vegetable sources such as meat and fish, and including semisynthetic formula diets based on animal protein.
4b.2.2 IZiNCG (2019) qualitative estimate for the intake of total absorbable zinc
Since 1996, new research has led to the development of revised qualitative and quantitative models for estimating zinc absorption. IZiNCG (2019) has provided a qualitative estimate for the intake of total absorbable zinc which is presented in a technical brief entitled: Determining the risk of zinc deficiency. To determine this qualitative estimate, the first step is to calculate the total intake of zinc and phytate from the dietary intake data, based preferable on three non-consecutive days. Local food composition data for zinc should be used, as these can vary with local soil conditions (Alloway, 2004). Data on the zinc content of local foods can be obtained from regional and national centers of the FAO Network of Food Data Systems (INFOODs). These food composition tables can be downloaded free of charge from the (FAO/INFOODS website). The values for the phytate content of raw and processed plant-based staples are available in the FAO/INFOODS/IZiNCG Global Food Composition Database for phytate. Care must also be taken to ensure the myo-inositol phosphate values selected consider both the most appropriate food processing and analytical method. Next, the phytate : zinc molar ratios of the whole diets must be calculated, as shown in Box 4b.2 to provide an estimate of likely zinc absorption. Diets with phytate : zinc molar ratios greater than 18 are considered unrefined cereal-based diets and classified as having low zinc bioavailability (i.e., 18% absorption for males and 25% absorption for females), whereas diets with ratios 4-18 are considered mixed or refined vegetarian diets and classified as having average zinc bioavailability (i.e., 26% absorption for males and 34% absorption for females). Note that if information on the phytate content of the diets cannot be calculated, then the zinc bioavailability of the diets should be categorized based on whether they are based on unrefined cereals and/or legumes (i.e., low bioavailability) or mixed or refined vegetarian diets (i.e., average zinc bioavailability)4b.2.3 European Food Safety Authority (EFSA) quantitative trivariate model
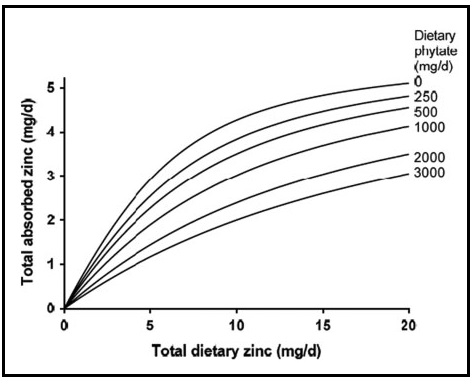
This model provides estimates for adults of total absorbed zinc from Western diets. It is based on a refinement of the trivariate saturation response model of total absorbed zinc developed initially by Miller et al. (2007). The model examines the relationship between total absorbed zinc, total dietary zinc, and phytate, as shown in Figure 4b.2.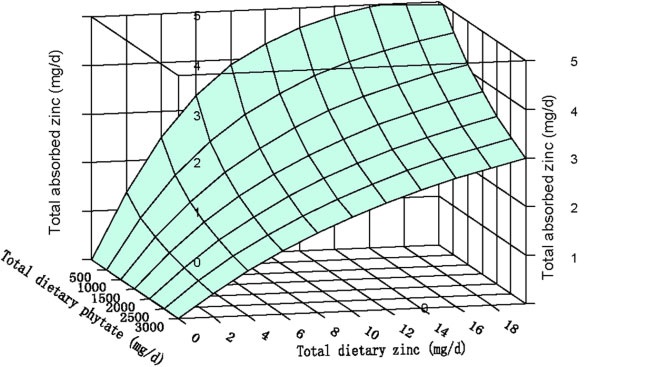
| Phytate level (mg/d) | Men, Zn absorption (%) | Women, Zn absorption (%) |
|---|---|---|
| 300 | 42 | 46 |
| 600 | 33 | 38 |
| 900 | 28 | 32 |
| 1200 | 24 | 28 |
4b.2.4 IZiNCG quantitative estimate of intake of total absorbable zinc for non-pregnant, non-lactating adults aged >19y
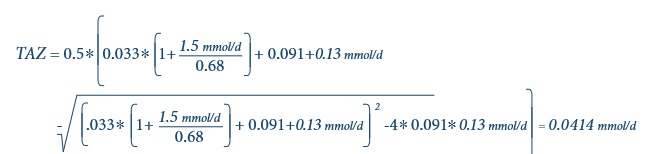
For non-pregnant, non-lactating adult >19y, the total intakes of zinc and phytate for each individual can be used to estimate total absorbale zinc using the updated trivariate saturation response model refined by EFSA (2014) and outlined above. Details are described in IZiNCG Technical Brief No.3, 2019 2nd Edition, and summarized by the following equation where TAZ is the total absorbable zinc; TDZ is the total dietary zinc. and TDP is the total dietary phytate.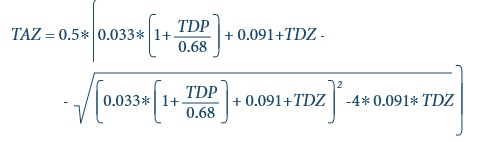
Box 4b.3: How to estimate total absorbable zinc in a national diet
Assuming a mean intake of total dietary zinc (TDZ) of 8.5mg/d
and a mean intake of total dietary phytate (TDP) of 900mg/d
from the Cameroon national food consumption survey, then
- Convert TDZ and TDP as mmol/d as follows:
Mean TDZ in mmol/d = 8.5 mg/d / 65.4 = 0.13 mmol/d
Mean TDP in mmol/d = 990 mg/d / 660 = 1.5 mmol/d - Substitute TDZ = 0.13 mmol/d and TDP = 1.5 mmol/d into this equation
- Convert TAZ as mmol/d back to mg/d
TAZ = 0.0414 × 65.4 = 2.7 mg/d - From this, fractional absorption of zinc (FAZ)
(i.e. bioavailability) in the Cameroon
national diet can be calculated as follows:
FAZ = TAZ/TDZ (× 100%) = 2.7/8.5 (× 100%) = 32 percent
4b.3 Bioavailability of other nutrients
Research on factors affecting the bioavailability of other nutrients in contemporary diets is urgently required. For several nutrients, the amount available for absorption can be only estimated. Such estimates are generally made by the expert committees formulating the nutrient recommendations, and they vary primarily according to the characteristics of the habitual diet of a country. More work is required to develop algorithms for predicting the bioavailability of these micronutrients in diets of differing compositions. So far, steps have been taken to develop algorithms to quantify the bioavailability of protein, folate, vitamin A, vitamin E, and vitamin D in human diets; these are considered below. Niacin is discussed in Section 4a.2.4.4b.3.1 Protein-digestibility corrected amino acid score (PDCAAS).
This score considers the content of amino acids and the digestibility of the ingested protein, attributes of protein quality which have frequently been neglected in many studies investigating the adequacy of dietary protein (Arsenault & Brown, 2017). The method was recommended by FAO / WHO in 1993 and WHO / FAO / UNU in (2007). It is based on a comparison of the first limiting amino acid in the test protein (i.e., the amino acid present in the lowest concentration in a food) with the concentration of that amino acid in a reference scoring pattern. Initially, the amino acid requirements of preschool-age children (i.e., 1-2y) was used as this was considered the most demanding in terms of protein quality of indispensable amino acids). However, with the recognition that requirements for the indispensable amino acids differ among age groups, age-specific amino acid scoring patterns (mg/g protein) for calculating protein quality were recommended by FAO in (2013). The three age-related reference patterns recommended as shown in Table 4b.3 are- 0‑6mos (infant based on breast milk pattern)
- 0.5‑3y (based on pattern for 0.5y infant)
- >3y (based on pattern for 3‑10y old child) for the remainder of the population;
| Age (y) | HIS | ILE | LEU | LYS | SAA | AAA | THR | TRP | VAL |
|---|---|---|---|---|---|---|---|---|---|
| 0.5 | 20 | 32 | 66 | 57 | 27 | 52 | 31 | 8.5 | 43 |
| 1–2 | 18 | 31 | 63 | 52 | 25 | 46 | 27 | 7.4 | 42 |
| 3–10 | 16 | 31 | 61 | 48 | 23 | 41 | 25 | 6.6 | 40 |
| Rice | Wheat | Sorghum | Maize | Lentils | Milk | |
|---|---|---|---|---|---|---|
| USDA code1 | 20450 | 20630 | 20648 | 20320 | 16069 | 01077 |
| Protein, g/100g | 6.6 | 9.7 | 8.4 | 8.1 | 24.6 | 24.6 |
| Amino acids, mg/g protein of food | ||||||
| Lysine | 36 | 27 | 21 | 28 | 70 | 84 |
| Sulfur-AA | 44 | 41 | 37 | 39 | 22 | 32 |
| Threonine | 36 | 27 | 37 | 38 | 36 | 43 |
| Tryptophan | 12 | 11.6 | 12.6 | 7.0 | 9.0 | 12.7 |
| Ratio of amino acid/g protein in food to reference protein scoring pattern2 | ||||||
| Lysine | 0.63 | 0.47 | 0.36 | 0.49 | 1.23 | 1.47 |
| Sulfur-AA | 1.62 | 1.50 | 1.37 | 1.44 | 0.80 | 1.20 |
| Threonine | 1.15 | 0.88 | 1.20 | 1.21 | 1.16 | 1.37 |
| Tryptophan | 1.37 | 1.37 | 1.48 | 0.83 | 1.06 | 1.40 |
| Amino Acid Score3 | 0.63 | 0.47 | 0.36 | 0.49 | 0.80 | 1.003 |
| Digestibility factor4 | 0.88 | 0.96 | 0.74 | 0.85 | 0.78 | 0.95 |
| PDCAAS (lowest ratio digestibility factor) | 0.56 | 0.45 | 0.27 | 0.42 | 0.62 | 0.95 |
| Food item | Consu- med, g | Protein g/100g food2 | Amino acid content of food, mg/g protein2 | Protein consu- med, g | Digest- ibility factor3 | |||
|---|---|---|---|---|---|---|---|---|
| A | B | C | D | E | F | G | H | |
| Lys | SAA | Thr | Trp | |||||
| Milk | 150 | 3.2 | 84 | 32 | 43 | 13 | 4.8 | 0.95 |
| Maize | 50 | 8.1 | 28 | 39 | 38 | 7 | 4.1 | 0.85 |
| Rice | 100 | 6.6 | 36 | 44 | 36 | 12 | 6.6 | 0.88 |
| Weighted average digestibility (sum of digestible protein/total protein (2010). | 0.89 | |||||||
| Digestable protein, g | Digestible amino acid, mg | |||||||
| Food item | (G x H) | C × G x H | D × G x H | E × G x H | F x G x H | |||
| Milk | 4.6 | 383 | 146 | 196 | 59 | |||
| Maize | 3.4 | 97 | 134 | 130 | 24 | |||
| Rice | 5.8 | 210 | 255 | 208 | 68 | |||
| Total: | 13.8 | 690 | 535 | 533 | 151 | |||
| Lys | SAA | Thr | Trp | |||||
| Amino acid mg/g protein (total of each digested AA/total digestible protein) | 50 | 39 | 39 | 11 | ||||
| Reference pattern mg/g protein | 57 | 27 | 31 | 8.5 | ||||
| Amino acid score: AA mg/g protein divided by mg/g reference protein | 0.88 | 1.44 | 1.25 | 1.29 | ||||
| PDCAAS (lowest AA score x weighted digestibility factor) | 0.78 | |||||||
4b.3.2 Digestible Indispensable Amino Acid Score (DIAAS)
There is increasing recognition that the PDCAAS has several limitations. They include: true fecal nitrogen digestibility does not consider the loss from the colon of indispensable amino acids that were not absorbed in the ileum; failure to credit additional nutritional value to high biological value proteins; overestimation of protein foods that contain antinutritional factors; and overestimation of protein foods of lower digestibility when supplemented with limiting amino acids (Boye et al., 2012). As a result, a newer method, the Digestible Indispensable Amino Acid Score (DIAAS) has been proposed. DIAAS relies on measures of true ileal digestibility of individual amino acids and lysine bioavailability because they better reflect the true quantity of amino acids digested and absorbed. It also avoids truncation of the score obtained. The most limiting digestible indispensable amino acid content (DIAA) defines the DIAAS value of a protein. For DIAAS, the three age-related amino acid reference scoring patterns shown in Table 4b.3 are used. To calculate DIAAS of single protein source, data on the complete indispensable amino acid (IAA) composition of the protein, the crude protein content (CP), and the IAA standardized ileal digestibility (SID) are required. For a given IAAy, DIAAy ratio is calculated as follows: \[\small \mbox {DIAAS = 100 x lowest DIAAy ratio among IAAs}\] where IAAy is expressed as mg/g CP. The lowest DIAA ratio leads to the DIAAS value of the protein. Values for DIAAS can also be calculated for protein mixtures. To accomplish this, average values of each single protein for IAAy and SIDy in the mixture must be obtained. See Herreman et al. (2020) for details of the calculation. The maximum DIAAS calculated among all possible ratios represents the optimal protein mixture. Care must be taken to ensure, where possible, that the values for IAAy and SIDy selected consider any processing and cooking conditions. A protein source or protein mixture with a DIAAS of 100 or above indicates that none of its indispensable amino acids is limiting and this source of protein has the potential to meet physiological requirements. This method was first introduced by FAO (2013), but at that time there was a lack of human digestibility data available that utilized DIAAS. However, in a later joint FAO-IAEA meeting in 2022, valid in vitro models of ileal amino acid digestibility were presented and a database of ileal digestibility of proteins and individual amino acids in foods created (Lee et al., 2016). The need for data on foods consumed by individuals in developing countries where environmental enteropathy has the potential to affect their digestion and absorption together with data on the effects of processing and storage on protein quality was emphasized (Lee et al., 2016). Access to such a database in the future will facilitate calculation of the protein quality of individual foods and mixtures of foods (Tome et al., 2024). See Bandyopadhyay et al. (2022) for a review of current approaches to measure ileal amino acid digestibility in humans and currently available data.4b.3.3 Bioavailability of the polyglutamate and monoglutamate forms of folate
The polyglutamate form of folate occurs naturally in foods, whereas the monoglutamate form comprises synthetic folic acid commonly used for fortifying foods and dietary supplements. The polyglutamate form has a lower bioavailability than synthetic folic acid. As a result, the IOM (1998) introduced a new term — dietary folate equivalents (DFE) — to consider the differences in the bioavailability of all sources of ingested folate. Total dietary folate equivalent (DFE) is defined as the quantity of natural food folate plus 1.7 times the quantity of folic acid in the diet. \[\small \mbox {µg DFE = µg natural food folate + (1.7 × µg synthetic folic acid)}\] This equation assumes that the bioavailability of food folate is about 50%, whereas that of synthetic folic acid taken with food is 85% (either as a food fortificant or as a supplement) or 100% when a supplement is taken on an empty stomach with water. Hence, folic acid taken with food is 85/50 = 1.7 times more available than folate naturally occurring in food (Caudill, 2010). Many countries are now fortifying foods such as breads and grains with the synthetic monoglutamate form of folate (i.e., folic acid). In the USA, Canada, Australia, Chile and more recently New Zealand, fortification on a mandatory (population wide) basis has been introduced, and has proved to be highly effective, not only in increasing folate status and reducing folate deficiency (Yang et al., 2010) but also in reducing neural tube defects in that country (Honein et al., 2001; Lopez-Camelo et al., 2005; De Wals et al., 2007; Sayed et al., 2008). Mandatory fortification is now in place in 85 countries worldwide, both high and low-middle income countries. For a recent review of the concerns of potential adverse effects of excess folic acid intake and/or elevated folate status, see Maruvada et al. (2020). Some food composition tables fail to distinguish between folate found naturally in foods and any synthetic folic acid added to foods as a fortificant. Work is underway to provide values for the total dietary folate equivalent (DFE) content of foods in food composition tables. Examples providing total dietary folate equivalents include the USDA Nutrient Database for Standard Reference and the New Zealand FOODfiles (2021). Caution must be used when borrowing dietary folate values from other food composition tables as they are not universally applicable and depend on the fortification regulations of the country. The following examples in Box 4b.4 provide guidance on how to convert folate values in a food composition database to µg DFE:
Box 4b.4: Conversion of folate values to µg dietary folate equivalents
Bailey et al.
(2010)
calculated folate intakes, expressed as DFEs, for the U.S
population from the National Health and Nutrition Examination Survey 2003-2006.
In contrast to earlier U.S surveys, this was the first study to include estimates
of folic acid from dietary supplements as well as dietary folate intakes. Hence, the
data generated reflect intakes that account for differences in the bioavailability of
all sources of folate, as noted above. In this survey, 34.5% of the US population
used dietary supplements that contained folic acid. These data emphasize that in a
population such as the U.S where more than one-half of the population report the
use of dietary supplements, monitoring folate status without the inclusion of such
an important contributor of folic acid will yield inaccurate data.
Recently, rhe use of a single bioavailability value to accurately reflect food folate,
especially when used in whole diets, has been questioned. Recent research has
highlighted the influence of many post-absorptive factors shown to modify the
bioavailability of folate, both naturally occurring and as folic acid. Examples of
such factors include genetics, ethnicity-race, and sex. Clearly, in the current era of
fortification and dietary supplement use, more large-scale studies are needed to
refine folate bioequivalency values for use in whole diets.
- To convert naturally occurring folate in a food to DFE:
Folate (µg DFE) = naturally occurring folate content of food per 100g × 1.0. - To convert a food that only contains synthetic folic acid to DFE:
Folate (µg DFE) = Folic acid (µg/per 100g) × 1.7 (conversion factor for folic acid) - To convert a food that contains both naturally occurring folate and synthetic folic acid:
Folate (µg DFE) = (naturally occurring folate (µg/100g) × 1.0) + synthetic folic acid (µg/100g) × 1.7
4b.3.4 Bioavailability of preformed vitamin A and pro-vitamin A carotenoids.
In the diets of most developed countries, vitamin A occurs mainly as preformed vitamin A derived only from animal products: fish-liver oils, liver, butterfat, and egg yolk are the major dietary sources. Muscle meats are poor sources of preformed vitamin A. In contrast, in most low-income countries the main food sources are the provitamin A carotenoids from yellow and orange fruits (West, 2000) and dark-green leafy vegetables. Red palm oil, and certain indigenous plants such as palm fruits (buriti) in Latin America, and the fruit termed "gac” in Vietnam, are unusually rich sources of provitamin A carotenoids (FAO/WHO, 2002). Provitamin A carotenoids, when derived from ripe yellow- and orange-colored fruits and cooked yellow tubers (e.g., sweet potatoes), appear to be more efficiently converted to retinol than when derived from dark green leafy vegetables (IOM, 2001; West et al., 2002). Processing methods, the food matrix, fat content of a meal, and more recently, genetic variations reportedly affect the bioavailability of provitamin A carotenoids (Torronen et al., 1996; van het Hof et al., 1988; Borel & Desmarchelier, 2017). Provitamin A carotenoids include β-carotene, β-cryptoxanthin, α-carotene, lutein, lycopene, and zeaxanthin, of which β-carotene and β-cryptoxanthin are the most important in the diet. There is a lack of consensus about the bioavailability of ingested provitamin A carotenoids from food and the efficiency with which these absorbed carotenoids are subsequently converted to retinol (i.e., their bioconversion). Currently two conversion factors are used for calculating the amount of vitamin A activity in foods from provitamin A carotenoids, and the values applied differ across agencies. FAO/WHO (2002) still maintain the use of 1µg retinol equals 6µg of β-carotene and 12µg of other provitamin A carotenoids (mainly α-carotene and β-cryptoxanthin). These same carotenoid / equivalency ratios have also been adopted by the European Food Safety Authority (EFSA, 2017) and by Australia and New Zealand (2021). Furthermore, these agencies express the substances with vitamin A activity as retinol equivalents (RE), whether they are preformed vitamin A (mainly retinol and retinyl esters) in foods of animal origin or provitamin A carotenoids. The U.S. Food and Nutrition Board, however, concluded that the bioavailability of provitamin A β‑carotene from plant sources is 12µg to 1µg retinol and 24µg to 1µg for other provitamin A carotenoids for healthy individuals. For a detailed justification of these conversion factors, see IOM (2001). The U.S has also adopted the term retinol activity equivalents (RA) for use when calculating the total amount of vitamin A in mixed dishes or diets. Such inconsistencies in the specific carotenoids/retinol equivalency ratios applied exacerbate problems when comparing vitamin A values among food composition databases and, in turn, vitamin A intakes across countries. For example, vitamin A intakes calculated from some food composition data may be higher if the lower bioconversion factors for provitamin A carotenoids recommended by FAO/WHO and EFSA were used, rather than the higher bioconversion factors adopted by the United States. Some older food composition tables continue to express vitamin A in terms of international units (IU). Use of these older units is no longer appropriate for assessing dietary adequacy of vitamin A and should be discontinued (FAO/WHO, 2002). Increasingly, synthetic sources of retinol and provitamin A compounds (mainly β‑carotene) are being added to foods or used as dietary supplements worldwide. In developed countries, foods fortified with preformed vitamin A may include ready-to-eat cereals, snack foods, beverages, margarine, and processed dairy products, whereas in low‑ and middle-income countries sugar, cereal flours, edible oils, margarine, and noodles are sometimes fortified with preformed vitamin A. Commercial dietary supplements may contain both preformed vitamin A and provitamin A (predominately as β‑carotene) (Tanumihardjo et al., 2016). As a result, when estimating the bioavailability (and the quantity) of vitamin A, both fortified foods and dietary supplements must also be considered. For more discussion of the confusion that may arise when assessing dietary vitamin A intakes, see Melse-Boonstra et al. (2017).4b.3.5 Bioavailability of α‑tocopherol
Vitamin E, a fat-soluble vitamin, is present in the diet as eight naturally occurring vitamin E analogues: four tocopherols (α, β, γ, and δ) and four tocotrienols that have varying levels of biological activity. Major food sources of natural vitamin E are vegetable seed oils (wheat germ, sunflower, corn, soyabean, safflower, palm), and olive oil. Synthetic forms of α‑tocopherol are called all‑racemic‑α‑tocopherol and are widely used as antioxidants, dietary supplements, and fortified products (e.g., ready‑to‑eat breakfast cereals) (Ranard & Erdman, 2018; Borel et al., 2013). The United States (IOM, 2000) and European Food Safety Authority (EFSA, 2015) consider the natural sources of α‑tocopherol (i.e. RRR‑α‑tocopherol) and the synthetic forms of α‑tocopherol (i.e., all‑racemic) as the only biologically active forms of vitamin E. The other naturally occurring forms of vitamin E in food (β‑, γ‑, and δ‑tocopherols and the tocotrienols), although absorbed, do not appear to be converted to α‑tocopherol by humans, and are poorly recognized by the α‑tocopherol transfer protein (α‑TTP) in the liver. Hence the β‑, γ‑, and δ‑tocopherols and the tocotrienols are not considered by the IOM or EFSA when assessing vitamin E intakes or setting requirements. In contrast, WHO/FAO (2004) express dietary vitamin E activity as α‑tocopherol equivalents (α‑TEs) to account for the combined biological activity assumed for the naturally occurring (i.e. RRR‑α‑tocopherol) and synthetic (all‑racemic‑α‑tocopherol) forms of vitamin E. However, WHO/FAO chose not to set any requirements for vitamin E due to the lack of information on the role of vitamin E in biological processes other than its involvement in antioxidant function at that time. In food composition tables and databases in the past, the vitamin E content of foods has been expressed as α‑tocopherol equivalents (α‑TEs). Factors have been used to convert the tocopherols and tocotrienols in food to α‑tocopherol equivalents (α‑TEs). For example, α‑TEs are defined by WHO/FAO (2004) as α‑tocopherol, mg × 1.0; β‑tocopherol, mg × 0.5; γ‑tocopherol, mg × 0.1; α‑tocotrienol, mg × 0.3. The biological activities of δ‑tocopherol and γ‑ and δ‑tocotrienol were below detection. All the synthetic all‑racemic‑α‑tocopherols when present in a food are multiplied by 0.74 (WHO/FAO, 2004). Today, in some food composition tables or databases (e.g., recent releases from USDA, Finland and Sweden), the vitamin E content of foods is expressed only by their α‑tocopherol content (mg/100g) (EFSA, 2015). The content of other chemical forms of tocopherol naturally occurring but with less biological activity are ignored. Hence, the vitamin E content of foods when expressed as their α‑tocopherol content (mg/100g) alone will be less than when based on intake of α‑tocopherol equivalents. The activity of synthetic sources (i.e., all‑racemic‑α‑tocopherol) relative to the natural sources of α‑tocopherol (i.e, RRR‑α‑tocopherol) is considered to be 50% by the US IOM (2000) and EFSA (2015) who define 1mg all‑racemic‑α‑tocopherol as equal to 0.5mg RRR‑α‑tocopherol. This is the ratio now used for food‑labelling purposes in the United States as shown below:
1mg α‑tocopherol (α‑T)
= 1mg of RRR‑α‑tocopherol 1mg α‑tocopherol (α‑T)
= 2mg of all‑racemic‑α‑tocopherol
Nevertheless, there remains considerable uncertainty regarding the
bioavailability and biopotency of the natural sources of α‑tocopherol
(RRR‑α‑tocopherol) compared with the synthetic sources
(all‑racemic‑α‑tocopherol).
In part, this has arisen because the 2:1 biopotency ratio shown above
was based on bioavailability data and not on the measurement of a clinical
endpoint. More research is urgently required that compares the relevant dose
levels of RRR and all‑racemic‑α‑tocopherol in relation to human diseases to
resolve this uncertainty
(Hoppe & Krennrich, 2000;
Ranard & Erdman, 2018).
Limited data exists on factors affecting the bioavailability of α‑tocopherol;
both dietary and some host-related factors may be implicated
(Borel et al., 2013).
For a usual mixed diet, 75% was considered the average
absorption for α‑tocopherol by EFSA (2015). Absorption of α‑tocopherol
increases in the presence of dietary fat, so that in conditions associated
with malabsorption of fat, intestinal absorption of vitamin E is impaired.
Food matrix and interactions, including competition with other fat-soluble
vitamins and carotenoids, might also influence the absorption of vitamin E,
although existing evidence is limited
(Borel et al., 2013).
Among the host-related factors, in adults with metabolic syndrome, in the elderly,
and in those who smoke cigarettes absorption tends to be reduced
(Borel et al., 2013;
Mah et al., 2015).
Genetic variants may have a role, at least in part, considering the
wide interindividual variability in absorption efficiency of vitamin E.
(Borel et al., 2013;
Mah et al., 2015).
= 1mg of RRR‑α‑tocopherol 1mg α‑tocopherol (α‑T)
= 2mg of all‑racemic‑α‑tocopherol